Intuit Inc. and Cadence Design Systems, Inc. are two prominent players in the software application industry, each leading innovation in distinct yet overlapping markets. Intuit focuses on financial management solutions for businesses and consumers, while Cadence specializes in electronic design automation for integrated circuits. This comparison highlights their growth strategies and market positions, helping you decide which company could be the most promising addition to your investment portfolio.
Table of contents
Companies Overview
I will begin the comparison between Intuit Inc. and Cadence Design Systems, Inc. by providing an overview of these two companies and their main differences.
Intuit Inc. Overview
Intuit Inc. focuses on financial management and compliance products for consumers, small businesses, and accounting professionals across the US, Canada, and internationally. Its portfolio includes QuickBooks, TurboTax, Credit Karma, and ProConnect, offering cloud-based and desktop software, payroll and payment processing, and personal finance solutions. Founded in 1983, Intuit is a leading player in the software application industry with a market cap of 152B USD.
Cadence Design Systems, Inc. Overview
Cadence Design Systems, Inc. provides software, hardware, and services for integrated circuit (IC) design and verification worldwide. Its offerings include functional verification platforms, digital IC design tools, custom IC design, and system design products, catering to sectors like 5G, aerospace, automotive, and healthcare. Incorporated in 1987, Cadence operates in the software application industry with a market cap of 87B USD and is headquartered in San Jose, California.
Key similarities and differences
Both Intuit and Cadence operate in the software application sector and serve technology-driven markets, but their business models diverge significantly. Intuit targets financial software for end consumers and small businesses, emphasizing cloud services and financial tools. Cadence specializes in design and verification software and hardware for semiconductor and electronics industries, focusing on complex IC and system design solutions. Their customer bases and product applications reflect distinct market niches within technology.
Income Statement Comparison
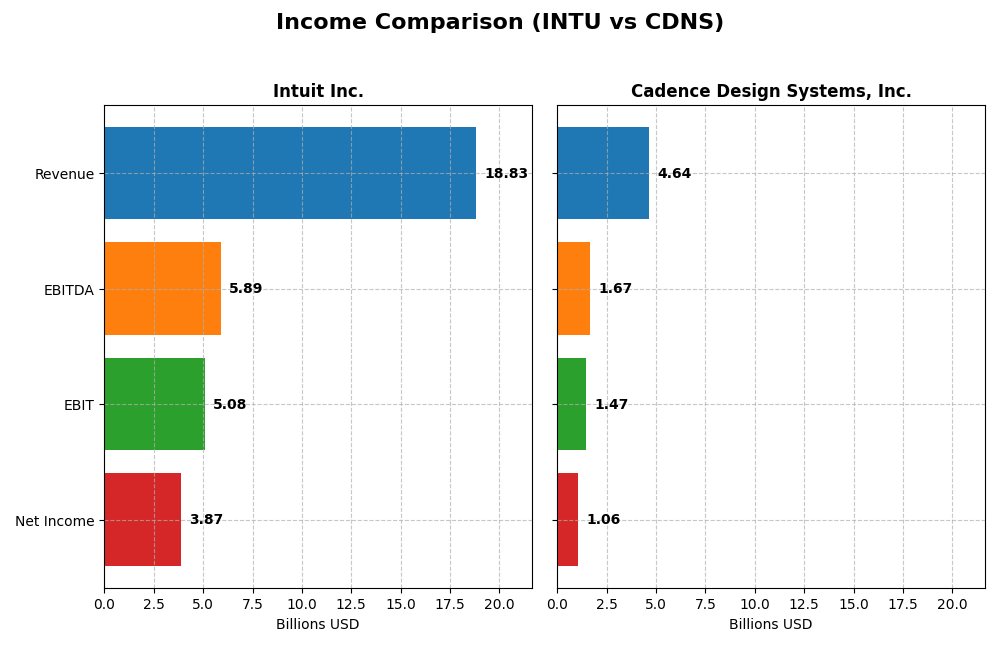
This table presents a side-by-side comparison of key income statement metrics for Intuit Inc. and Cadence Design Systems, Inc. based on their most recent fiscal year results.
| Metric | Intuit Inc. (INTU) | Cadence Design Systems, Inc. (CDNS) |
|---|---|---|
| Market Cap | 152B | 87B |
| Revenue | 18.8B | 4.6B |
| EBITDA | 5.9B | 1.7B |
| EBIT | 5.1B | 1.5B |
| Net Income | 3.9B | 1.1B |
| EPS | 13.82 | 3.89 |
| Fiscal Year | 2025 | 2024 |
Income Statement Interpretations
Intuit Inc.
Intuit has experienced strong revenue growth from 2021 to 2025, nearly doubling its top line with a 95.5% increase. Net income followed a similar trajectory, rising by 87.6%, although net margin slightly declined by 4%. In 2025, Intuit posted favorable improvements in gross and EBIT margins, with net income surging 31.1%, indicating robust profitability expansion despite some margin pressure over the longer term.
Cadence Design Systems, Inc.
Cadence showed consistent revenue growth of 73% over five years, with net income increasing 78.7%. Margins remain healthy, with a gross margin of 86% and EBIT margin of 31.7%. The latest year saw a 13.5% revenue increase and an 11.7% EBIT growth, though net margin contracted by 10.7%, and EPS growth was nearly flat, reflecting some margin compression despite solid top-line gains.
Which one has the stronger fundamentals?
Both companies demonstrate favorable income statement fundamentals with solid revenue and net income growth. Intuit excels with higher revenue growth and significant EPS improvement, offset slightly by a minor net margin decline. Cadence maintains higher margins but shows margin pressure recently. Overall, Intuit presents stronger growth dynamics, while Cadence offers stable profitability metrics.
Financial Ratios Comparison
The following table presents a side-by-side comparison of key financial ratios for Intuit Inc. and Cadence Design Systems, Inc. based on their most recent fiscal year data.
| Ratios | Intuit Inc. (2025) | Cadence Design Systems, Inc. (2024) |
|---|---|---|
| ROE | 19.6% | 22.6% |
| ROIC | 14.8% | 13.4% |
| P/E | 56.8 | 77.2 |
| P/B | 11.2 | 17.4 |
| Current Ratio | 1.36 | 2.93 |
| Quick Ratio | 1.36 | 2.74 |
| D/E (Debt-to-Equity) | 0.34 | 0.55 |
| Debt-to-Assets | 18.0% | 28.8% |
| Interest Coverage | 19.9 | 17.8 |
| Asset Turnover | 0.51 | 0.52 |
| Fixed Asset Turnover | 12.5 | 7.7 |
| Payout Ratio | 30.7% | 0% |
| Dividend Yield | 0.54% | 0% |
Interpretation of the Ratios
Intuit Inc.
Intuit shows a generally favorable ratio profile with strong profitability metrics such as a 20.55% net margin and 19.63% return on equity, though valuation ratios like P/E at 56.82 and P/B at 11.15 appear stretched. Liquidity is balanced with a current ratio of 1.36. Intuit pays dividends with a 0.54% yield, supported by solid free cash flow, but the low yield may concern income-focused investors.
Cadence Design Systems, Inc.
Cadence demonstrates robust profitability with a 22.74% net margin and 22.58% return on equity. Its liquidity ratios are strong, including a current ratio of 2.93, though the debt-to-equity ratio is moderate at 0.55. The company does not pay dividends, likely reinvesting in its high R&D intensity and growth focus. Valuation ratios like P/E at 77.2 and P/B at 17.44 are relatively high.
Which one has the best ratios?
Both Intuit and Cadence exhibit favorable overall financial ratios, particularly in profitability and liquidity. Intuit’s lower leverage and dividend payments contrast with Cadence’s zero dividend and higher liquidity. However, both face valuation concerns with elevated P/E and P/B ratios, making neither clearly superior purely on ratios.
Strategic Positioning
This section compares the strategic positioning of Intuit Inc. and Cadence Design Systems, Inc., focusing on market position, key segments, and exposure to technological disruption:
Intuit Inc.
- Leading financial management software provider with $152B market cap, facing competitive pressure.
- Diversified revenue from Small Business, Consumer, Credit Karma, and Professional Tax segments.
- Operates in financial software, less exposed to rapid tech disruption but must adapt to digital trends.
Cadence Design Systems, Inc.
- Strong player in IC design software with $87B market cap, operating in specialized verification markets.
- Revenue driven by product maintenance and technology services for IC design and verification solutions.
- High exposure to technological disruption in semiconductor design, requiring continuous innovation.
Intuit Inc. vs Cadence Design Systems, Inc. Positioning
Intuit adopts a diversified approach across financial software segments, offering stability but requiring broad management. Cadence focuses on specialized IC design and verification, allowing deep expertise but higher dependency on chip industry cycles.
Which has the best competitive advantage?
Both companies create value with ROIC above WACC but show declining profitability. Their slight economic moats indicate modest competitive advantages, with neither demonstrating a clearly superior moat based on current data.
Stock Comparison
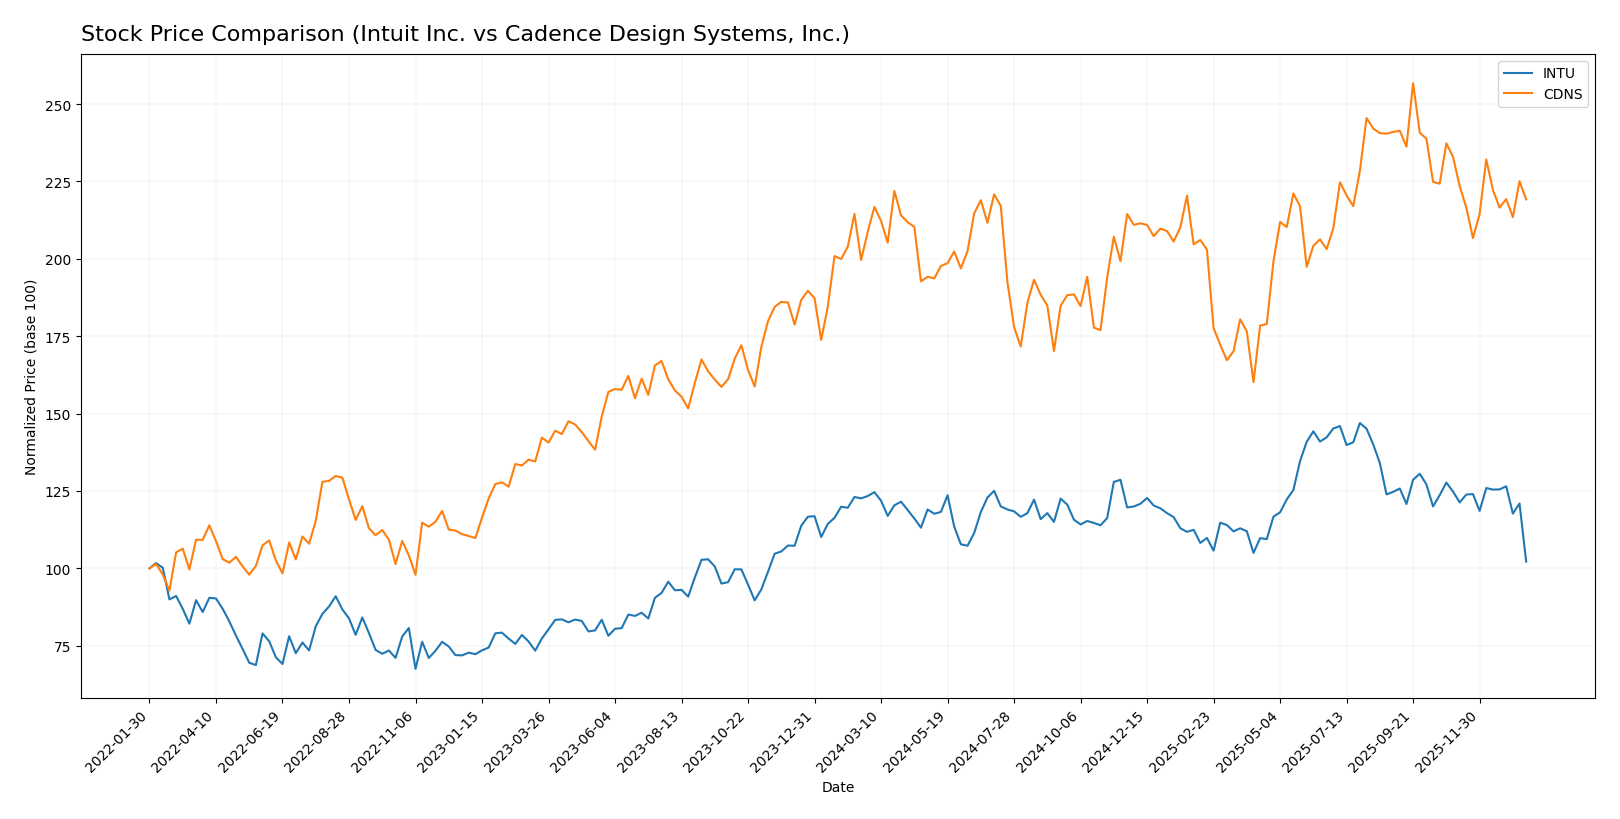
The stock price chart highlights contrasting trends for Intuit Inc. and Cadence Design Systems, Inc. over the past year, with notable price fluctuations and shifts in trading volume dynamics.
Trend Analysis
Intuit Inc. (INTU) experienced a bearish trend over the past 12 months with a -17.17% price change, showing deceleration and a high volatility of 51.48. The stock peaked at 785.95 and bottomed at 546.5.
Cadence Design Systems, Inc. (CDNS) showed a bullish trend over the same period with a 5.01% gain, also decelerating, and lower volatility at 29.13. Its price ranged between 232.88 and 373.35.
Comparing both, Cadence outperformed Intuit with positive growth, while Intuit posted a significant decline, marking Cadence as the stronger market performer.
Target Prices
Analysts present a clear target price consensus for Intuit Inc. and Cadence Design Systems, Inc.
| Company | Target High | Target Low | Consensus |
|---|---|---|---|
| Intuit Inc. | 880 | 700 | 798.4 |
| Cadence Design Systems, Inc. | 418 | 275 | 381 |
The consensus targets suggest significant upside potential for both stocks compared to current prices: Intuit at $546.58 and Cadence at $318.93, indicating optimistic analyst expectations.
Analyst Opinions Comparison
This section compares analysts’ ratings and grades for Intuit Inc. and Cadence Design Systems, Inc.:
Rating Comparison
INTU Rating
- Rating: B, considered Very Favorable by analysts.
- Discounted Cash Flow Score: 4, Favorable, indicating a relatively strong DCF.
- Return on Equity Score: 4, Favorable, showing efficient profit generation.
- Return on Assets Score: 5, Very Favorable, indicating excellent asset use.
- Debt To Equity Score: 2, Moderate, suggesting moderate financial risk.
- Overall Score: 3, Moderate, reflecting a balanced financial standing.
CDNS Rating
- Rating: B, also considered Very Favorable by analysts.
- Discounted Cash Flow Score: 3, Moderate, indicating a less strong DCF.
- Return on Equity Score: 4, Favorable, similarly showing efficient profit use.
- Return on Assets Score: 5, Very Favorable, indicating excellent asset use.
- Debt To Equity Score: 2, Moderate, also suggesting moderate financial risk.
- Overall Score: 3, Moderate, reflecting a balanced financial standing.
Which one is the best rated?
Both Intuit and Cadence share the same overall rating of B and an equal overall score of 3, indicating similar moderate financial standing. Intuit has a slightly stronger discounted cash flow score, while other key scores are identical, making their analyst ratings broadly comparable.
Scores Comparison
Here is a comparison of the Altman Z-Score and Piotroski Score for Intuit Inc. and Cadence Design Systems, Inc.:
Intuit Inc. Scores
- Altman Z-Score: 9.35, indicating a safe zone with very low bankruptcy risk
- Piotroski Score: 9, classified as very strong financial health
Cadence Design Systems Scores
- Altman Z-Score: 14.51, indicating a safe zone with very low bankruptcy risk
- Piotroski Score: 7, classified as strong financial health
Which company has the best scores?
Cadence Design Systems has a higher Altman Z-Score, signaling slightly lower bankruptcy risk, while Intuit has a superior Piotroski Score indicating stronger financial health. Each leads in a different score category based on the data provided.
Grades Comparison
Here is the detailed grades comparison for Intuit Inc. and Cadence Design Systems, Inc.:
Intuit Inc. Grades
The following table lists recent grades from notable financial institutions for Intuit Inc.:
| Grading Company | Action | New Grade | Date |
|---|---|---|---|
| Wells Fargo | Downgrade | Equal Weight | 2026-01-08 |
| Wells Fargo | Maintain | Overweight | 2025-11-21 |
| RBC Capital | Maintain | Outperform | 2025-11-21 |
| BMO Capital | Maintain | Outperform | 2025-11-21 |
| Evercore ISI Group | Maintain | Outperform | 2025-11-18 |
| RBC Capital | Maintain | Outperform | 2025-09-02 |
| RBC Capital | Maintain | Outperform | 2025-08-22 |
| UBS | Maintain | Neutral | 2025-08-22 |
| Morgan Stanley | Maintain | Overweight | 2025-08-22 |
| Barclays | Maintain | Overweight | 2025-08-22 |
Intuit’s grades show a strong consensus of Outperform and Overweight ratings, with a recent slight downgrade by Wells Fargo to Equal Weight.
Cadence Design Systems, Inc. Grades
The following table outlines recent grades from recognized rating firms for Cadence Design Systems, Inc.:
| Grading Company | Action | New Grade | Date |
|---|---|---|---|
| Needham | Maintain | Buy | 2025-12-22 |
| Wells Fargo | Maintain | Overweight | 2025-10-28 |
| Baird | Maintain | Outperform | 2025-10-28 |
| Needham | Maintain | Buy | 2025-10-28 |
| JP Morgan | Maintain | Overweight | 2025-10-28 |
| Oppenheimer | Maintain | Underperform | 2025-10-28 |
| Rosenblatt | Maintain | Neutral | 2025-10-28 |
| Rosenblatt | Maintain | Neutral | 2025-10-22 |
| Needham | Maintain | Buy | 2025-07-29 |
| Loop Capital | Maintain | Buy | 2025-07-29 |
Cadence Design Systems exhibits a majority of Buy and Overweight ratings, but also includes an Underperform and Neutral ratings, indicating a more mixed outlook.
Which company has the best grades?
Both companies hold a “Buy” consensus, but Intuit’s grades lean more consistently toward Outperform and Overweight, while Cadence shows more variation with some Underperform and Neutral ratings. Investors might interpret Intuit’s steadier positive trend as indicative of stronger analyst confidence.
Strengths and Weaknesses
Below is a comparative overview of key strengths and weaknesses for Intuit Inc. (INTU) and Cadence Design Systems, Inc. (CDNS) based on recent financial and operational data.
| Criterion | Intuit Inc. (INTU) | Cadence Design Systems, Inc. (CDNS) |
|---|---|---|
| Diversification | Highly diversified revenue streams: Consumer ($4.87B), Global Business Solutions ($11.08B), Credit Karma ($2.26B) | Less diversified; revenue mainly from Product & Maintenance ($4.21B) and Technology Service ($428M) |
| Profitability | Strong profitability: Net margin 20.55%, ROIC 14.78%, ROE 19.63% | Strong profitability: Net margin 22.74%, ROIC 13.43%, ROE 22.58% |
| Innovation | Moderate innovation with steady but declining ROIC trend (-5.3%) | High innovation potential but facing sharper ROIC decline (-29.7%) |
| Global presence | Global reach with significant business solutions segment | Global presence focused on semiconductor and electronic design markets |
| Market Share | Leading in financial software and tax solutions | Leading in electronic design automation software |
Key takeaways: Both Intuit and Cadence create value with favorable profitability ratios, yet both face declining ROIC trends, signaling caution. Intuit benefits from broader diversification, while Cadence relies heavily on niche tech markets with sharper profitability declines. Investors should weigh diversification against innovation risks.
Risk Analysis
Below is a comparative table summarizing key risks for Intuit Inc. and Cadence Design Systems, Inc. as of the most recent fiscal years:
| Metric | Intuit Inc. (INTU) | Cadence Design Systems, Inc. (CDNS) |
|---|---|---|
| Market Risk | Beta 1.254, moderate volatility | Beta 1.022, lower volatility |
| Debt level | Debt-to-equity 0.34 (favorable) | Debt-to-equity 0.55 (moderate risk) |
| Regulatory Risk | Moderate, financial software compliance | Moderate, semiconductor industry regulations |
| Operational Risk | Moderate, reliance on cloud services | Moderate, complexity of IC design tools |
| Environmental Risk | Low, limited direct impact | Low, mainly indirect through suppliers |
| Geopolitical Risk | Moderate, US-focused but global presence | Moderate, exposure to global chip supply chains |
Intuit faces higher market volatility but benefits from a stronger balance sheet with lower debt risk. Both companies encounter moderate regulatory and operational risks in their respective tech niches. Geopolitical risks are relevant due to global supply chains and regulatory environments, with no immediate critical threats reported.
Which Stock to Choose?
Intuit Inc. (INTU) shows strong income growth with a 95% revenue increase over five years and a favorable net margin of 20.55%. Its financial ratios are mostly favorable, including a solid return on equity near 20% and low debt levels. The company maintains a slightly favorable economic moat despite a declining ROIC trend and holds a very favorable rating with moderate overall scores.
Cadence Design Systems, Inc. (CDNS) also presents favorable income growth, with nearly 73% revenue growth over five years and a higher net margin at 22.74%. Its financial ratios are similarly favorable, highlighted by a strong return on equity above 22% and moderate debt metrics. The firm exhibits a slightly favorable moat with a declining ROIC trend and carries a very favorable rating with moderate scores.
Investors focused on growth might find both companies appealing due to favorable income and financial metrics; however, those prioritizing stability could note Intuit’s lower debt-to-equity ratio and stronger margin expansion. Cadence’s higher net margin and return on equity may appeal to investors seeking higher profitability potential despite a more elevated debt profile. Both companies display strengths and risks that could be interpreted differently depending on individual investment profiles.
Disclaimer: Investment carries a risk of loss of initial capital. The past performance is not a reliable indicator of future results. Be sure to understand risks before making an investment decision.
Go Further
I encourage you to read the complete analyses of Intuit Inc. and Cadence Design Systems, Inc. to enhance your investment decisions: