In the rapidly evolving software application industry, Cadence Design Systems, Inc. (CDNS) and Figma, Inc. (FIG) stand out as innovators with overlapping market presence. Cadence focuses on integrated circuit design and verification, while Figma leads in collaborative interface design tools. Both companies leverage cutting-edge technology to fuel growth and innovation. This article will help you determine which company presents the most compelling investment opportunity in 2026.

Table of contents
Companies Overview
I will begin the comparison between Cadence Design Systems, Inc. and Figma, Inc. by providing an overview of these two companies and their main differences.
Cadence Design Systems Overview
Cadence Design Systems, Inc. provides software, hardware, services, and reusable integrated circuit design blocks globally. The company focuses on functional verification, digital IC design, custom IC design, and system design, serving markets such as 5G communications, aerospace, automotive, and healthcare. With a market cap of 86.4B USD and over 12K employees, Cadence is a well-established leader in the semiconductor design software industry.
Figma Overview
Figma, Inc. develops a browser-based collaborative design tool for user interfaces, enabling design and development teams to prototype and streamline product development. Founded in 2012, Figma offers various tools including Figma Design, FigJam, and AI-powered Figma Make. The company operates primarily in the software application sector with a market cap of 14.4B USD and around 1.6K employees, focusing on modern UI/UX design workflows.
Key similarities and differences
Both companies operate in the software application industry but serve distinct niches: Cadence specializes in electronic design automation for integrated circuits, while Figma targets collaborative UI design. Cadence has a much larger market cap and employee base, reflecting its established position and broad product portfolio. In contrast, Figma emphasizes cloud-based collaboration and design innovation, with a younger market presence and a focus on creative teams.
Income Statement Comparison
This table compares the key income statement metrics of Cadence Design Systems, Inc. and Figma, Inc. for the fiscal year 2024, highlighting differences in scale and profitability.

| Metric | Cadence Design Systems, Inc. | Figma, Inc. |
|---|---|---|
| Market Cap | 86.4B | 14.4B |
| Revenue | 4.64B | 749M |
| EBITDA | 1.67B | -870M |
| EBIT | 1.47B | -877M |
| Net Income | 1.06B | -732M |
| EPS | 3.89 | -3.11 |
| Fiscal Year | 2024 | 2024 |
Income Statement Interpretations
Cadence Design Systems, Inc.
Cadence Design Systems showed consistent revenue growth from 2020 to 2024, reaching $4.64B in 2024, with net income rising to $1.06B. Margins remained strong and stable, with a gross margin of 86.05% and net margin around 22.74%. In 2024, revenue growth slowed slightly to 13.48%, while net margin declined by 10.66%, indicating some margin pressure despite overall expansion.
Figma, Inc.
Figma experienced rapid revenue growth from 2023 to 2024, increasing 48.36% to $749M. Despite a high gross margin of 88.32%, it reported significant losses with a net margin of -97.74% and negative net income of $732M in 2024. Operating expenses grew unfavorably, and earnings per share deteriorated sharply, reflecting continued investment at the expense of profitability in its early years.
Which one has the stronger fundamentals?
Cadence Design Systems demonstrates stronger fundamentals with sustained revenue and net income growth, favorable margins, and positive earnings per share trends over five years. Conversely, Figma’s income statement reveals unfavorable profitability metrics and negative net income, despite rapid revenue expansion. Cadence’s stable margins and profitability outweigh Figma’s high growth but substantial losses.
Financial Ratios Comparison
The table below presents a side-by-side comparison of key financial ratios for Cadence Design Systems, Inc. (CDNS) and Figma, Inc. (FIG) based on their latest fiscal year data ending 2024.
| Ratios | Cadence Design Systems, Inc. (CDNS) | Figma, Inc. (FIG) |
|---|---|---|
| ROE | 22.6% | -55.3% |
| ROIC | 13.4% | -59.7% |
| P/E | 77.2 | -70.7 |
| P/B | 17.4 | 39.1 |
| Current Ratio | 2.93 | 3.66 |
| Quick Ratio | 2.74 | 3.66 |
| D/E | 0.55 | 0.02 |
| Debt-to-Assets | 28.8% | 1.6% |
| Interest Coverage | 17.8 | 0 |
| Asset Turnover | 0.52 | 0.42 |
| Fixed Asset Turnover | 7.68 | 17.1 |
| Payout Ratio | 0 | 0 |
| Dividend Yield | 0% | 0% |
Interpretation of the Ratios
Cadence Design Systems, Inc.
Cadence Design Systems shows strong profitability with favorable net margin of 22.74% and ROE of 22.58%, indicating effective management and solid returns. Liquidity ratios, including a current ratio of 2.93, are robust, while valuation multiples like PE of 77.2 appear stretched. The company does not pay dividends, reflecting a reinvestment or growth strategy without shareholder distributions.
Figma, Inc.
Figma’s financial ratios reveal weaknesses, with negative net margin (-97.74%) and ROE (-55.29%), signaling operational losses and poor profitability. The low debt and high quick ratio are positives, but overall unfavorable ratios dominate. Figma also does not pay dividends, consistent with its high growth phase and focus on reinvestment and R&D rather than returning cash to shareholders.
Which one has the best ratios?
Cadence Design Systems has a more favorable ratio profile, balancing strong profitability and liquidity with some valuation concerns. In contrast, Figma’s ratios reflect significant losses and financial challenges, despite some liquidity strength. Overall, Cadence’s ratios suggest a healthier financial standing compared to Figma’s currently unfavorable metrics.
Strategic Positioning
This section compares the strategic positioning of Cadence Design Systems, Inc. and Figma, Inc. in terms of market position, key segments, and exposure to technological disruption:
Cadence Design Systems, Inc.
- Leading established player in software and hardware for IC design with competitive pressure from tech firms.
- Focuses on IC design software, hardware platforms, and IP products serving 5G, aerospace, automotive, and computing sectors.
- Faces moderate disruption risk with ongoing innovation in semiconductor verification and design automation technologies.
Figma, Inc.
- Emerging design software company with high market volatility and competitive pressure in creative collaboration tools.
- Concentrates on browser-based design and prototyping tools mainly for UI/UX teams and product development workflows.
- High exposure to disruption with rapid changes in design collaboration and AI-driven prototyping tools.
Cadence Design Systems, Inc. vs Figma, Inc. Positioning
Cadence’s diversified portfolio spans multiple hardware and software segments across several industries, offering stability but requiring broad innovation. Figma’s concentrated focus on collaborative design software targets a niche but rapidly evolving market, facing higher volatility and disruption risk.
Which has the best competitive advantage?
Cadence holds a slightly favorable moat with value creation despite declining profitability, indicating better sustained competitive advantage. Figma’s very unfavorable MOAT status reflects value destruction and significant profitability challenges, weakening its competitive position.
Stock Comparison
The stock price movements over the past 12 months reveal contrasting trends between Cadence Design Systems, Inc. and Figma, Inc., with notable shifts in price change percentages and trading volume dynamics.
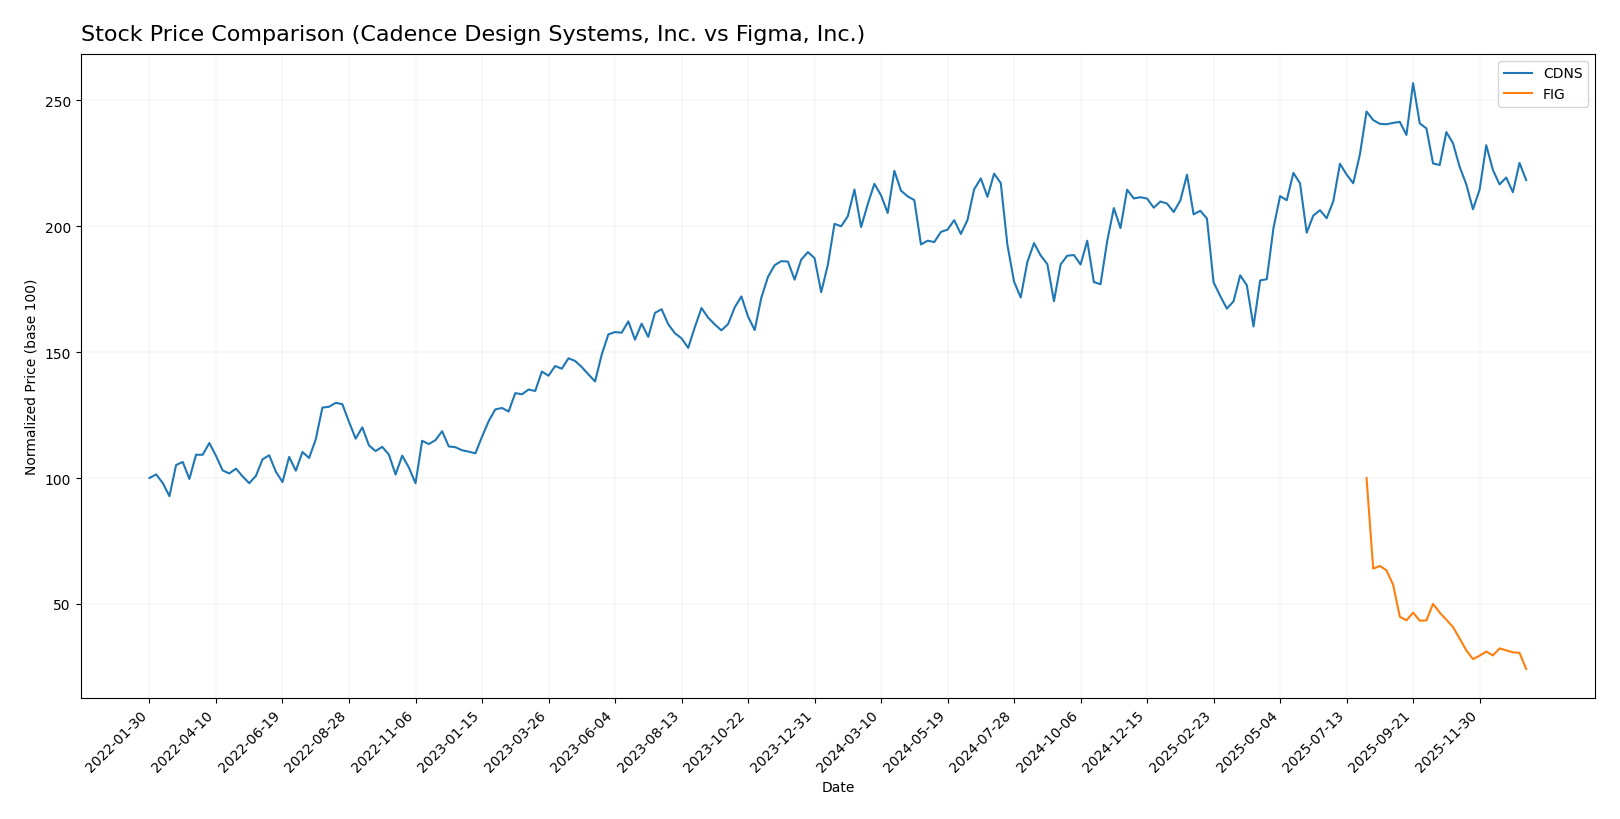
Trend Analysis
Cadence Design Systems, Inc. (CDNS) showed a bullish trend over the past year with a 4.59% price increase, though recent months indicate a deceleration with a 6.27% decline and seller dominance in volume.
Figma, Inc. (FIG) experienced a strong bearish trend with a 75.76% price drop and accelerating decline, accompanied by decreasing volume and increased selling pressure in recent periods.
Comparing both, Cadence Design Systems delivered the highest market performance with a positive overall trend, whereas Figma’s stock showed a significant negative trajectory.
Target Prices
The consensus target prices for Cadence Design Systems, Inc. and Figma, Inc. suggest promising upside potential based on analyst projections.
| Company | Target High | Target Low | Consensus |
|---|---|---|---|
| Cadence Design Systems, Inc. | 418 | 275 | 381 |
| Figma, Inc. | 52 | 38 | 43.6 |
Analysts see Cadence trading well above its current price of $317.45, indicating confidence in growth. Figma’s target consensus of $43.6 also suggests significant appreciation potential from its $29.57 current price.
Analyst Opinions Comparison
This section compares analysts’ ratings and grades for Cadence Design Systems, Inc. (CDNS) and Figma, Inc. (FIG):
Rating Comparison
CDNS Rating
- Rating: B, considered Very Favorable by analysts.
- Discounted Cash Flow Score: 3, indicating a moderate valuation based on future cash flows.
- ROE Score: 4, reflecting a favorable ability to generate profit from shareholders’ equity.
- ROA Score: 5, very favorable efficiency in asset utilization to generate earnings.
- Debt To Equity Score: 2, moderate financial risk with some reliance on debt.
- Overall Score: 3, a moderate overall financial standing.
FIG Rating
- Rating: C+, also considered Very Favorable by analysts.
- Discounted Cash Flow Score: 4, showing a favorable valuation on future cash flows.
- ROE Score: 1, indicating a very unfavorable ability to generate profit from shareholders’ equity.
- ROA Score: 1, very unfavorable efficiency in asset utilization.
- Debt To Equity Score: 4, favorable financial risk profile with lower reliance on debt.
- Overall Score: 2, a moderate overall financial standing but lower than CDNS.
Which one is the best rated?
Based solely on the provided data, CDNS is better rated overall, with higher scores in return on equity and assets, despite FIG having a slightly better discounted cash flow and debt to equity profile. CDNS holds a superior overall score and rating.
Scores Comparison
Here is a comparison of the Altman Z-Score and Piotroski Score for Cadence Design Systems, Inc. and Figma, Inc.:
CDNS Scores
- Altman Z-Score: 14.51, well within the safe zone indicating low bankruptcy risk.
- Piotroski Score: 7, representing strong financial health.
FIG Scores
- Altman Z-Score: 14.34, also in the safe zone with low bankruptcy risk.
- Piotroski Score: 4, indicating average financial strength.
Which company has the best scores?
Based strictly on the provided data, CDNS has a slightly higher Altman Z-Score and a significantly stronger Piotroski Score than FIG. This suggests CDNS exhibits stronger financial health compared to FIG according to these metrics.
Grades Comparison
The following analysis compares the available grades and ratings for Cadence Design Systems, Inc. and Figma, Inc.:
Cadence Design Systems, Inc. Grades
This table summarizes recent grades from established financial institutions for Cadence Design Systems, Inc.:
| Grading Company | Action | New Grade | Date |
|---|---|---|---|
| Needham | Maintain | Buy | 2025-12-22 |
| Wells Fargo | Maintain | Overweight | 2025-10-28 |
| Baird | Maintain | Outperform | 2025-10-28 |
| Needham | Maintain | Buy | 2025-10-28 |
| JP Morgan | Maintain | Overweight | 2025-10-28 |
| Oppenheimer | Maintain | Underperform | 2025-10-28 |
| Rosenblatt | Maintain | Neutral | 2025-10-28 |
| Rosenblatt | Maintain | Neutral | 2025-10-22 |
| Needham | Maintain | Buy | 2025-07-29 |
| Loop Capital | Maintain | Buy | 2025-07-29 |
Overall, Cadence Design Systems shows a predominantly positive rating trend, with multiple “Buy,” “Overweight,” and “Outperform” grades, although a minority maintain a neutral or underperform stance.
Figma, Inc. Grades
This table presents recent grades from reputable financial firms for Figma, Inc.:
| Grading Company | Action | New Grade | Date |
|---|---|---|---|
| Morgan Stanley | Maintain | Equal Weight | 2026-01-15 |
| Wells Fargo | Upgrade | Overweight | 2026-01-08 |
| RBC Capital | Maintain | Sector Perform | 2026-01-05 |
| Goldman Sachs | Maintain | Neutral | 2025-11-07 |
| JP Morgan | Maintain | Neutral | 2025-11-06 |
| Piper Sandler | Maintain | Overweight | 2025-11-06 |
| Wells Fargo | Maintain | Equal Weight | 2025-11-05 |
| Wells Fargo | Maintain | Equal Weight | 2025-09-04 |
| Morgan Stanley | Maintain | Equal Weight | 2025-09-04 |
| RBC Capital | Maintain | Sector Perform | 2025-09-04 |
Figma’s grades mostly range from “Equal Weight” to “Overweight” and “Sector Perform,” indicating a more cautious or moderate outlook compared to Cadence.
Which company has the best grades?
Cadence Design Systems has received consistently stronger grades, mostly “Buy,” “Overweight,” and “Outperform,” while Figma’s ratings are generally “Equal Weight” and “Sector Perform.” Investors might interpret Cadence’s stronger consensus as reflecting higher confidence from analysts, potentially affecting portfolio decisions accordingly.
Strengths and Weaknesses
Below is a comparison of key strengths and weaknesses of Cadence Design Systems, Inc. (CDNS) and Figma, Inc. (FIG) based on the most recent financial and strategic data.
| Criterion | Cadence Design Systems, Inc. (CDNS) | Figma, Inc. (FIG) |
|---|---|---|
| Diversification | Moderate: Revenue split between Product & Maintenance ($4.21B) and Technology Services ($428M) | Limited: Focused mainly on design software services |
| Profitability | Strong profitability: Net margin 22.74%, ROIC 13.43%, creating value with a slightly declining trend | Negative profitability: Net margin -97.74%, ROIC -59.68%, value destroying with steep decline |
| Innovation | Consistent innovation in electronic design automation tools | Emerging innovator in collaborative design tools but struggling financially |
| Global presence | Established global footprint in semiconductor and software markets | Growing presence but primarily US-centric currently |
| Market Share | Significant share in EDA market with steady revenue growth | Smaller market share in design software, rapidly expanding |
Key takeaways: Cadence demonstrates solid profitability and global reach with a balanced revenue mix, though ROIC has slightly declined. Figma, while innovative and growing in popularity, is currently unprofitable and destroying value, indicating higher risk for investors.
Risk Analysis
Below is a comparative table of key risks for Cadence Design Systems, Inc. (CDNS) and Figma, Inc. (FIG) based on the latest available data for 2024:
| Metric | Cadence Design Systems, Inc. (CDNS) | Figma, Inc. (FIG) |
|---|---|---|
| Market Risk | Beta 1.02 (moderate market sensitivity) | Beta -3.80 (high volatility, counter-cyclical moves) |
| Debt level | Debt-to-Equity 0.55 (moderate) | Debt-to-Equity 0.02 (very low) |
| Regulatory Risk | Moderate (Tech sector with standard software regulation) | Moderate (Software, potential IP and data privacy focus) |
| Operational Risk | Low (strong financials, stable operations) | High (negative margins, operational losses) |
| Environmental Risk | Low (software sector, limited direct impact) | Low (software sector, limited direct impact) |
| Geopolitical Risk | Moderate (US-based with global clients) | Moderate (US-based, global SaaS exposure) |
The most impactful and likely risk for Figma is its operational risk due to significant negative margins (-97.7%) and unfavorable return ratios, reflecting ongoing losses and challenges in profitability. Cadence’s main concern lies in market risk and valuation, with a high P/E ratio of 77.2 signaling potential overvaluation despite solid fundamentals. Both companies face moderate geopolitical and regulatory risks typical for US-based software firms with global operations.
Which Stock to Choose?
Cadence Design Systems, Inc. (CDNS) shows a favorable income evolution with a 13.48% revenue growth in 2024 and strong profitability, including a 22.74% net margin and a 22.58% ROE. Its debt levels are moderate and well-managed, supported by a very favorable overall rating of B and a strong financial moat despite a slightly declining ROIC trend.
Figma, Inc. (FIG) exhibits rapid revenue growth of 48.36% but suffers from unfavorable profitability metrics, including a -97.74% net margin and negative ROE. The company carries low debt and a strong liquidity position, yet its overall financial ratios and moat evaluation are unfavorable, with a very unfavorable rating of C+ reflecting value destruction and declining profitability.
Investors focused on stability and proven profitability might find CDNS more favorable given its strong financial ratios, positive income trends, and value-creating moat. Conversely, those with a higher risk tolerance seeking rapid growth exposure could see potential in FIG, despite its current financial challenges and unfavorable profitability metrics.
Disclaimer: Investment carries a risk of loss of initial capital. The past performance is not a reliable indicator of future results. Be sure to understand risks before making an investment decision.
Go Further
I encourage you to read the complete analyses of Cadence Design Systems, Inc. and Figma, Inc. to enhance your investment decisions: