Home > Comparison > Technology > CDNS vs FICO
The strategic rivalry between Cadence Design Systems, Inc. and Fair Isaac Corporation shapes the technology software sector’s evolution. Cadence operates as a capital-intensive provider of integrated circuit design tools, while Fair Isaac focuses on high-margin decision analytics software. This head-to-head highlights a clash between hardware-driven innovation and data-centric solutions. This analysis aims to identify which corporate strategy delivers superior risk-adjusted returns for a diversified portfolio in 2026.

Table of contents
Companies Overview
Cadence Design Systems and Fair Isaac Corporation anchor crucial segments of the software application industry with distinct market footprints.
Cadence Design Systems, Inc.: Premier Electronic Design Automation Leader
Cadence dominates the electronic design automation space by offering software, hardware, and services that enable integrated circuit and system design worldwide. Its revenue stems from advanced verification platforms like JasperGold and Xcelium, alongside digital IC design tools. In 2026, Cadence focuses strategically on expanding its chip verification and design-for-test solutions to meet rising demands in 5G, automotive, and hyperscale computing markets.
Fair Isaac Corporation: Analytics and Decision Management Pioneer
Fair Isaac specializes in analytic software and data management to automate business decisions globally. It generates revenue through its Scores and Software segments, offering decision management solutions and consumer/business scoring services. The company’s 2026 strategy centers on enhancing its FICO Platform modular software and expanding advanced analytics to address fraud detection, customer engagement, and financial compliance challenges.
Strategic Collision: Similarities & Divergences
Both firms leverage software to optimize complex processes but diverge sharply in focus—Cadence operates a closed ecosystem around chip design, while Fair Isaac offers flexible, modular decision analytics. Their primary battleground lies in technology-driven market segments, with Cadence targeting hardware design and Fair Isaac addressing business intelligence. These differences create distinct investment profiles: Cadence’s growth is tethered to semiconductor innovation, while Fair Isaac rides the wave of data-driven decision automation.
Income Statement Comparison
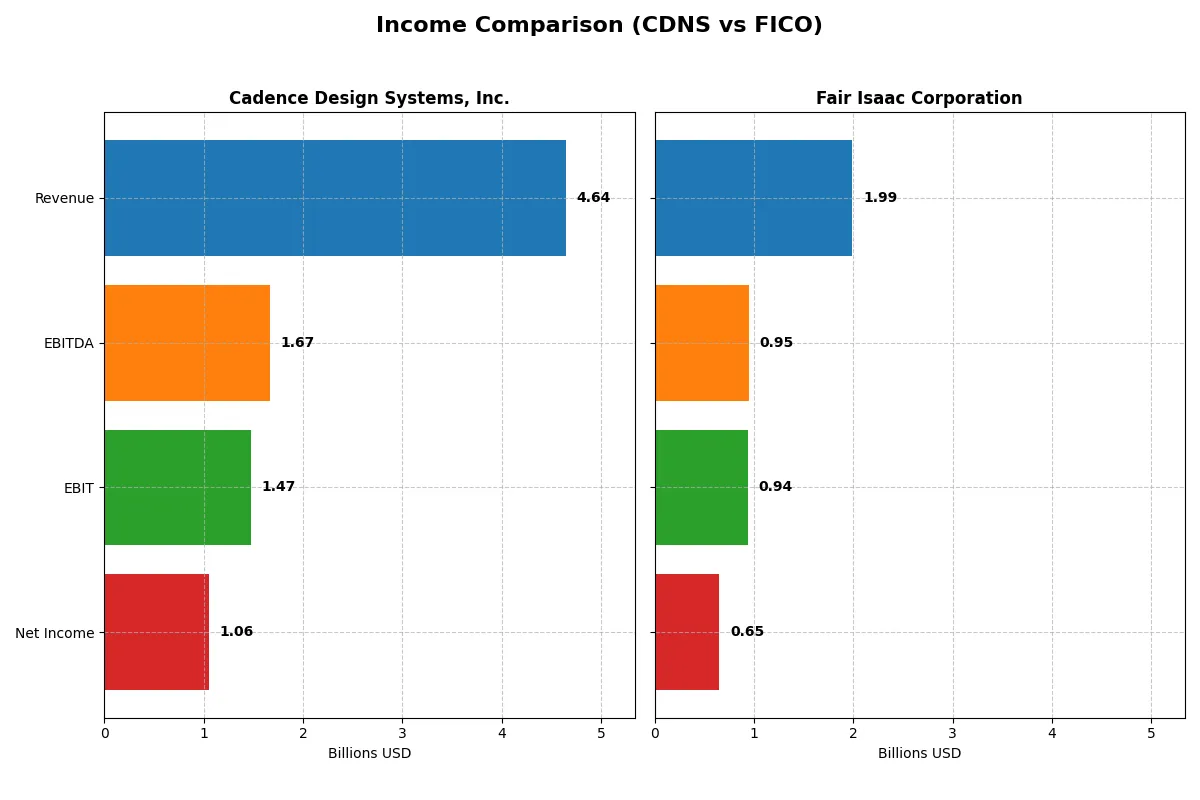
This data dissects the core profitability and scalability of both corporate engines to reveal who dominates the bottom line:
| Metric | Cadence Design Systems, Inc. (CDNS) | Fair Isaac Corporation (FICO) |
|---|---|---|
| Revenue | 4.64B | 1.99B |
| Cost of Revenue | 648M | 354M |
| Operating Expenses | 2.64B | 712M |
| Gross Profit | 3.99B | 1.64B |
| EBITDA | 1.67B | 951M |
| EBIT | 1.47B | 936M |
| Interest Expense | 76M | 134M |
| Net Income | 1.06B | 652M |
| EPS | 3.89 | 26.9 |
| Fiscal Year | 2024 | 2025 |
Income Statement Analysis: The Bottom-Line Duel
This income statement comparison reveals which company runs its financial engine with greater efficiency and sustained growth momentum.
Cadence Design Systems, Inc. Analysis
Cadence’s revenue climbed steadily from 2.68B in 2020 to 4.64B in 2024, with net income following suit, reaching 1.06B. The company maintains a robust gross margin of 86%, reflecting strong cost control. Despite a slight dip in net margin growth last year, overall margins remain healthy, signaling operational strength and consistent earnings expansion.
Fair Isaac Corporation Analysis
Fair Isaac’s revenue rose from 1.32B in 2021 to 1.99B in 2025, paralleled by net income growth to 652M. The firm boasts an impressive 47% EBIT margin and a 33% net margin, reflecting excellent profitability. Its revenue and net income growth accelerated recently, with a notable 30% EPS increase, indicating strong operational leverage and margin improvement.
Margin Power vs. Revenue Scale
Cadence leads in revenue scale and maintains a superior gross margin, delivering solid top-line growth and stable net income. Fair Isaac, while smaller in revenue, outshines with higher EBIT and net margins and faster EPS growth. For investors, Cadence offers steady expansion with margin resilience; Fair Isaac presents a leaner, high-margin profile with stronger recent momentum.
Financial Ratios Comparison
These vital ratios act as a diagnostic tool to expose the underlying fiscal health, valuation premiums, and capital efficiency of the companies compared:
| Ratios | Cadence Design Systems, Inc. (CDNS) | Fair Isaac Corporation (FICO) |
|---|---|---|
| ROE | 22.6% | -37.3% |
| ROIC | 13.4% | 52.9% |
| P/E | 77.2x | 55.6x |
| P/B | 17.4x | -20.8x |
| Current Ratio | 2.93 | 0.83 |
| Quick Ratio | 2.74 | 0.83 |
| D/E (Debt-to-Equity) | 0.55 | -1.76 |
| Debt-to-Assets | 28.8% | 164.6% |
| Interest Coverage | 17.8x | 6.9x |
| Asset Turnover | 0.52 | 1.07 |
| Fixed Asset Turnover | 7.68 | 21.2 |
| Payout ratio | 0% | 0% |
| Dividend yield | 0% | 0% |
| Fiscal Year | 2024 | 2025 |
Efficiency & Valuation Duel: The Vital Signs
Ratios act as a company’s DNA, revealing operational strengths and hidden risks that shape investment decisions and future growth potential.
Cadence Design Systems, Inc.
Cadence boasts a robust 22.6% ROE and 22.7% net margin, signaling solid profitability. Its elevated P/E of 77.2 and P/B of 17.4 suggest an expensive valuation. The firm retains earnings, investing heavily in R&D, fueling innovation rather than paying dividends. Its strong current and quick ratios reflect healthy liquidity.
Fair Isaac Corporation
Fair Isaac posts a high 32.8% net margin and an exceptional 53.0% ROIC, indicating operational efficiency. Yet, a negative ROE of -37.3% and a low current ratio of 0.83 raise red flags. Its P/E of 55.6 is stretched but less than Cadence’s. The company does not pay dividends, focusing on growth investments instead.
Premium Valuation vs. Operational Safety
Cadence offers a more balanced liquidity profile and consistent profitability, though at a premium valuation. Fair Isaac’s stellar ROIC contrasts with weak equity returns and solvency concerns. Investors targeting operational safety may prefer Cadence, while those seeking aggressive growth may consider Fair Isaac’s riskier profile.
Which one offers the Superior Shareholder Reward?
Cadence Design Systems (CDNS) and Fair Isaac Corporation (FICO) both forgo dividends, reinvesting free cash flow aggressively. CDNS maintains a robust buyback program, sustaining free cash flow per share near $4.1B with zero payout ratio, signaling growth focus. FICO’s buybacks are less transparent but free cash flow per share surged to $31.8B, although heavy debt clouds sustainability. CDNS’s conservative leverage and consistent buybacks offer a safer total return profile. In 2026, I find CDNS’s shareholder rewards superior due to sustainable capital allocation and lower financial risk.
Comparative Score Analysis: The Strategic Profile
The radar chart reveals the fundamental DNA and trade-offs of Cadence Design Systems, Inc. and Fair Isaac Corporation:
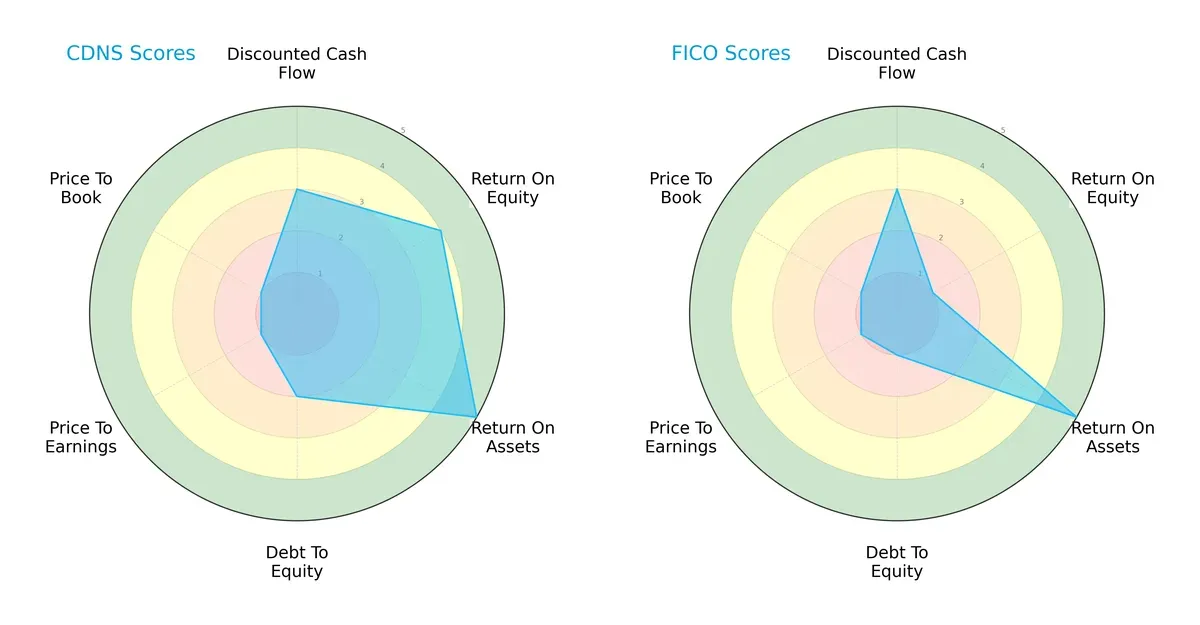
Cadence shows a more balanced profile with solid ROE (4) and very favorable ROA (5), contrasting Fair Isaac’s weak ROE (1) but matching ROA (5). Cadence’s debt-to-equity (2) is moderate, while Fair Isaac’s (1) signals higher leverage risk. Both firms suffer from poor valuation scores (PE/PB = 1), indicating potential overvaluation or market skepticism. Cadence leans on operational efficiency, while Fair Isaac relies heavily on asset utilization.
Bankruptcy Risk: Solvency Showdown
Cadence’s Altman Z-Score (14.24) and Fair Isaac’s (12.20) both place them firmly in the safe zone:
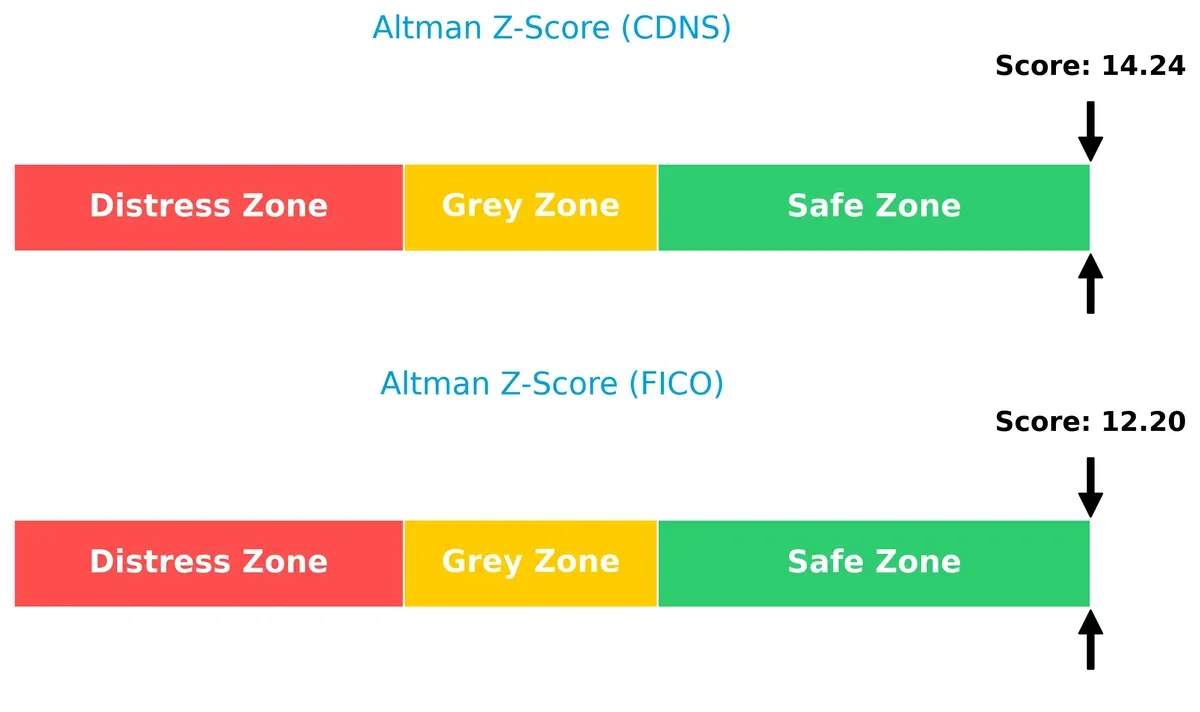
These high scores signal robust financial stability and very low bankruptcy risk, vital for surviving economic downturns and market volatility in 2026.
Financial Health: Quality of Operations
Both companies score 7 on the Piotroski F-Score, indicating strong financial health:
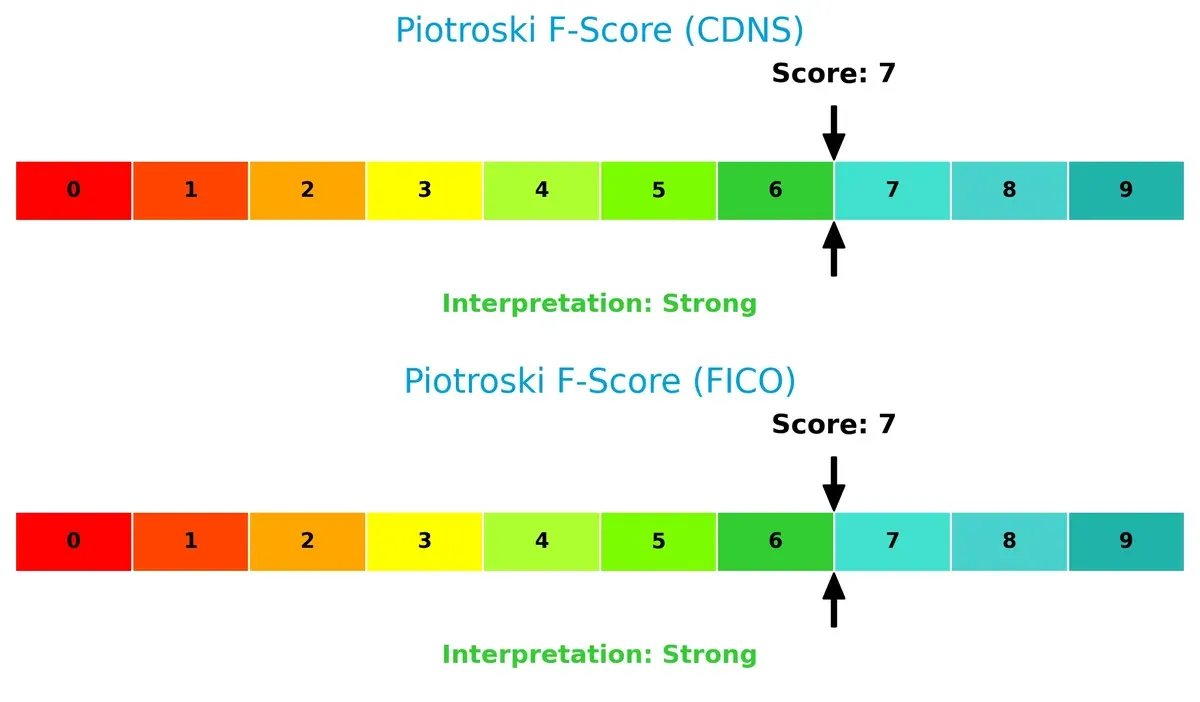
This suggests solid profitability, liquidity, and operational efficiency with no immediate red flags. Investors can view both as fundamentally sound, though ongoing monitoring remains essential given sector dynamics.
How are the two companies positioned?
This section dissects the operational DNA of Cadence Design Systems and Fair Isaac Corporation by comparing their revenue distribution and internal dynamics. The goal is to confront their economic moats to identify which model offers the most resilient, sustainable competitive advantage today.
Revenue Segmentation: The Strategic Mix
This revenue comparison dissects how Cadence Design Systems, Inc. and Fair Isaac Corporation diversify their income streams and where their primary sector bets lie:
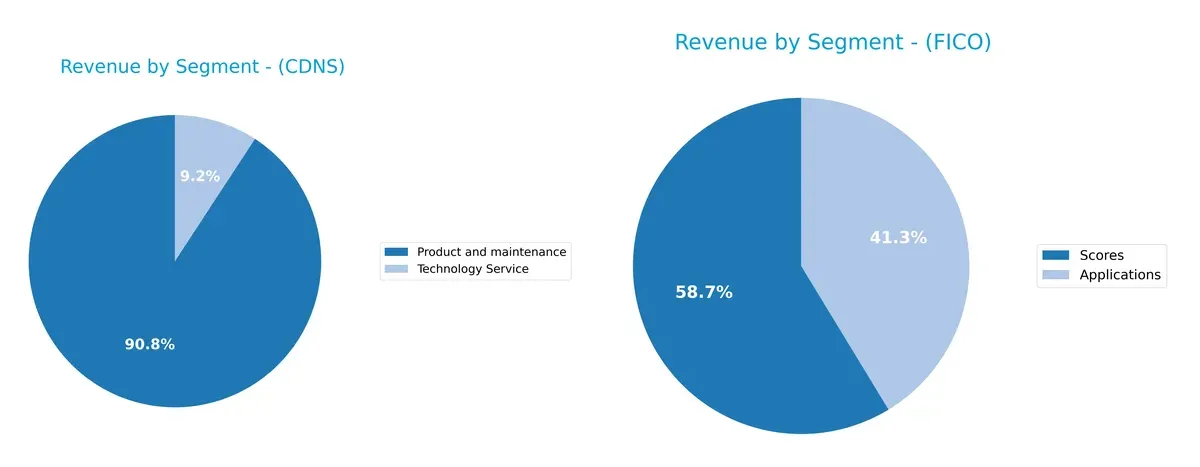
Cadence Design Systems anchors 2024 revenue heavily in Product and Maintenance at $4.21B, with Technology Service trailing at $428M. This concentration suggests strong ecosystem lock-in around core design tools. Fair Isaac’s 2025 revenue splits between Scores ($1.17B) and Applications ($822M), showing a more balanced mix. FICO’s diversification reduces concentration risk, while Cadence’s dominance in one segment signals infrastructure leadership but potential vulnerability to market shifts.
Strengths and Weaknesses Comparison
This table compares the Strengths and Weaknesses of Cadence Design Systems, Inc. and Fair Isaac Corporation:
Cadence Strengths
- Strong profitability with 22.74% net margin
- Favorable ROE at 22.58%
- Solid ROIC of 13.43% above WACC
- High current and quick ratios above 2.7
- Diverse revenue from Products and Technology Services
- Broad global presence across Americas, Asia, EMEA, Japan
FICO Strengths
- Highest net margin at 32.75%
- Exceptional ROIC at 52.96%
- Favorable asset and fixed asset turnover ratios
- Strong interest coverage of 7.01
- Diverse revenue streams from Applications and Scores
- Global footprint including Americas, Asia Pacific, EMEA
Cadence Weaknesses
- Unfavorable high P/E at 77.2 and P/B at 17.44
- Zero dividend yield
- Moderate debt-to-equity ratio at 0.55
- Neutral asset turnover at 0.52
- Reliance on high-margin product segment
FICO Weaknesses
- Negative ROE at -37.34 signals equity losses
- Low current ratio at 0.83 indicates liquidity risk
- Very high debt-to-assets at 164.6%
- Unfavorable P/E at 55.64 despite strong profits
- Zero dividend yield
Overall, Cadence exhibits financial stability with strong liquidity and consistent profitability, supporting steady growth across global markets. FICO shows superior ROIC and operational efficiency but faces significant equity and liquidity challenges that may constrain strategic flexibility.
The Moat Duel: Analyzing Competitive Defensibility
A structural moat is the essential barrier that shields long-term profits from relentless competition erosion. Let’s dissect the moats of Cadence Design Systems and Fair Isaac Corporation:
Cadence Design Systems, Inc.: Intangible Assets & Technological Expertise
Cadence’s moat stems from proprietary software and hardware for IC design, reflected in its stable 31.7% EBIT margin and 4.98% ROIC above WACC. However, declining ROIC signals emerging pressure. Expansion into 5G and AI chip markets could either deepen or strain this advantage by 2026.
Fair Isaac Corporation: Network Effects & Data Analytics Dominance
FICO’s moat is anchored in its vast analytic data and decision management software, delivering a commanding 47% EBIT margin and a soaring 43.6% ROIC above WACC. Unlike Cadence, FICO’s ROIC trend is strongly positive, fueled by expanding cloud offerings and AI-driven credit scoring, enhancing growth opportunities.
Technology Moats Faceoff: Intellectual Property vs. Data Network Power
FICO clearly holds the deeper moat with its robust ROIC growth and dominant data network effects. Cadence creates value but faces margin pressure, making FICO better positioned to defend and expand its market share in 2026 and beyond.
Which stock offers better returns?
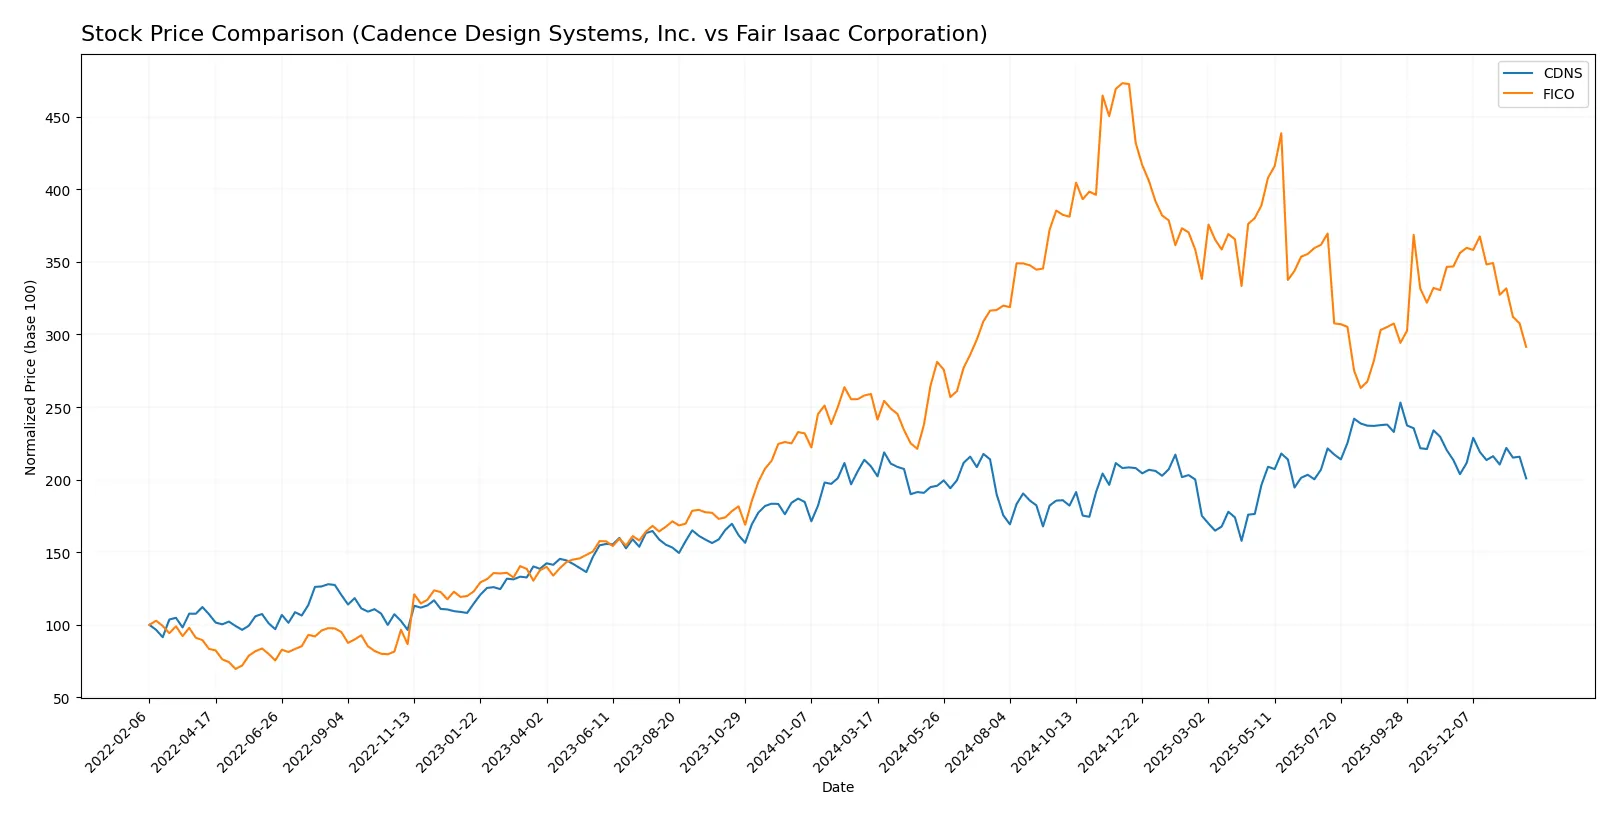
Over the past year, Cadence Design Systems, Inc. and Fair Isaac Corporation have shown diverging price trends, with notable highs and lows shaping their respective trading dynamics.
Trend Comparison
Cadence Design Systems, Inc. experienced a bearish trend with a -3.97% price decline over 12 months. The trend shows deceleration, with a high of 373.35 and a low of 232.88.
Fair Isaac Corporation posted a bullish trend, gaining 12.51% over the same period. Despite deceleration, it reached a peak of 2375.03 and a low of 1110.85.
Fair Isaac outperformed Cadence, delivering the highest market return over the last year based on the provided price changes.
Target Prices
Analysts show a bullish consensus for Cadence Design Systems, Inc. and Fair Isaac Corporation.
| Company | Target Low | Target High | Consensus |
|---|---|---|---|
| Cadence Design Systems, Inc. | 275 | 418 | 382.17 |
| Fair Isaac Corporation | 1640 | 2400 | 2115 |
The target consensus for Cadence exceeds its current price of 296.36 by a significant margin, signaling upside potential. Fair Isaac’s consensus target also sits well above its 1463.17 share price, indicating strong analyst confidence.

Don’t Let Luck Decide Your Entry Point
Optimize your entry points with our advanced ProRealTime indicators. You’ll get efficient buy signals with precise price targets for maximum performance. Start outperforming now!
How do institutions grade them?
The following tables summarize recent institutional grades for Cadence Design Systems, Inc. and Fair Isaac Corporation:
Cadence Design Systems, Inc. Grades
This table lists recent grades and actions by major grading companies for Cadence Design Systems, Inc.
| Grading Company | Action | New Grade | Date |
|---|---|---|---|
| Needham | maintain | Buy | 2025-12-22 |
| Baird | maintain | Outperform | 2025-10-28 |
| JP Morgan | maintain | Overweight | 2025-10-28 |
| Needham | maintain | Buy | 2025-10-28 |
| Wells Fargo | maintain | Overweight | 2025-10-28 |
| Rosenblatt | maintain | Neutral | 2025-10-28 |
| Oppenheimer | maintain | Underperform | 2025-10-28 |
| Rosenblatt | maintain | Neutral | 2025-10-22 |
| Stifel | maintain | Buy | 2025-07-29 |
| Keybanc | maintain | Overweight | 2025-07-29 |
Fair Isaac Corporation Grades
This table lists recent grades and actions by major grading companies for Fair Isaac Corporation.
| Grading Company | Action | New Grade | Date |
|---|---|---|---|
| Needham | maintain | Buy | 2026-01-29 |
| Jefferies | maintain | Buy | 2026-01-16 |
| Wells Fargo | maintain | Overweight | 2026-01-14 |
| JP Morgan | maintain | Neutral | 2025-11-06 |
| Baird | maintain | Outperform | 2025-11-06 |
| Jefferies | maintain | Buy | 2025-11-06 |
| BMO Capital | maintain | Outperform | 2025-11-06 |
| Wells Fargo | maintain | Overweight | 2025-10-14 |
| Barclays | maintain | Overweight | 2025-10-02 |
| Needham | maintain | Buy | 2025-10-02 |
Which company has the best grades?
Fair Isaac Corporation holds a stronger consensus with multiple “Buy” and “Outperform” ratings from top firms, including recent updates in 2026. Cadence Design Systems shows a mixed range, including some “Neutral” and “Underperform” grades. Investors may interpret Fair Isaac’s grades as reflecting higher confidence in its near-term prospects.
Risks specific to each company
The following categories identify the critical pressure points and systemic threats facing both firms in the 2026 market environment:
1. Market & Competition
Cadence Design Systems, Inc. (CDNS)
- Faces intense competition in software application and semiconductor verification markets.
Fair Isaac Corporation (FICO)
- Competes in analytics and decision software with growing pressure from AI-driven startups.
2. Capital Structure & Debt
Cadence Design Systems, Inc. (CDNS)
- Maintains moderate leverage with debt-to-assets at 28.8%, interest coverage strong at 19.4x.
Fair Isaac Corporation (FICO)
- Exhibits high financial risk with debt-to-assets at 164.6%, negative debt-to-equity ratio signals balance sheet stress.
3. Stock Volatility
Cadence Design Systems, Inc. (CDNS)
- Beta near 1.02 indicates market-correlated volatility, volume above average shows active trading.
Fair Isaac Corporation (FICO)
- Higher beta at 1.29 signals more volatility; lower trading volume means less liquidity.
4. Regulatory & Legal
Cadence Design Systems, Inc. (CDNS)
- Subject to technology export controls and IP protection risks in global markets.
Fair Isaac Corporation (FICO)
- Faces regulatory scrutiny over data privacy and compliance in financial services sectors.
5. Supply Chain & Operations
Cadence Design Systems, Inc. (CDNS)
- Relies on semiconductor supply chain and cloud infrastructure, which face geopolitical disruptions.
Fair Isaac Corporation (FICO)
- Depends on robust data centers and software delivery, vulnerable to cyber threats and operational outages.
6. ESG & Climate Transition
Cadence Design Systems, Inc. (CDNS)
- Increasing ESG commitments amid pressure to reduce carbon footprint in hardware manufacturing.
Fair Isaac Corporation (FICO)
- ESG risks tied to data ethics and sustainability of AI models, with rising investor scrutiny.
7. Geopolitical Exposure
Cadence Design Systems, Inc. (CDNS)
- Exposure to US-China tensions impacts semiconductor design and sales in Asia-Pacific.
Fair Isaac Corporation (FICO)
- Global operations face risks from regional regulatory fragmentation and political instability.
Which company shows a better risk-adjusted profile?
Cadence’s most impactful risk lies in intense market competition and high valuation multiples, yet its solid capital structure and liquidity mitigate financial stress. Fair Isaac’s critical weakness is a highly leveraged balance sheet paired with regulatory complexity. Given these factors, Cadence presents a better risk-adjusted profile supported by safer debt metrics and operational resilience in a volatile 2026 environment.
Final Verdict: Which stock to choose?
Cadence Design Systems shines with its superpower: operational efficiency fueled by strong R&D and a solid balance sheet. Its slightly declining ROIC signals a point of vigilance but not immediate concern. It fits well in portfolios targeting steady, innovation-driven growth.
Fair Isaac Corporation’s moat stems from its data-driven decision analytics and recurring revenue model. Its growing ROIC and high profitability indicate durable competitive advantages, though its leveraged balance sheet demands caution. It suits investors prioritizing high returns with a tolerance for financial risk.
If you prioritize operational stability and consistent innovation, Cadence outshines with its balanced capital structure and efficiency. However, if you seek growth fueled by a durable moat and superior ROIC, Fair Isaac offers better upside despite higher leverage and volatility. Both represent compelling but distinct analytical scenarios for different investor profiles.
Disclaimer: Investment carries a risk of loss of initial capital. The past performance is not a reliable indicator of future results. Be sure to understand risks before making an investment decision.
Go Further
I encourage you to read the complete analyses of Cadence Design Systems, Inc. and Fair Isaac Corporation to enhance your investment decisions: