In the dynamic world of software applications, Cadence Design Systems, Inc. (CDNS) and Elastic N.V. (ESTC) stand out as innovative leaders. Both operate at the forefront of technology, serving markets that demand cutting-edge software solutions—from integrated circuit design to advanced data search and analytics. Their overlapping focus on software innovation makes them compelling candidates for comparison. Join me as we explore which company offers the most promising opportunity for investors in 2026.
Table of contents
Companies Overview
I will begin the comparison between Cadence Design Systems and Elastic by providing an overview of these two companies and their main differences.
Cadence Design Systems Overview
Cadence Design Systems, Inc. specializes in software, hardware, and services for integrated circuit (IC) design and verification. The company offers a broad portfolio including functional verification platforms, digital IC design tools, and custom IC simulation products. Serving markets such as 5G communications, aerospace, automotive, and healthcare, Cadence holds a strong position in the semiconductor and electronics design industry.
Elastic Overview
Elastic N.V. focuses on delivering software solutions for search, analysis, and data visualization across multi-cloud environments. Its Elastic Stack platform includes products like Elasticsearch, Kibana, Beats, and Logstash, enabling users to process and analyze diverse data types. Elastic primarily serves enterprises requiring real-time search and analytics capabilities, positioning itself as a leader in cloud-based data solutions.
Key similarities and differences
Both companies operate in the software application industry with technology-driven solutions, yet Cadence centers on IC design and verification tools, while Elastic specializes in data search and analytics software. Cadence’s offerings are hardware-integrated and tailored to semiconductor markets, whereas Elastic’s products cater to cloud computing and data analytics environments. Each company targets distinct but technologically intensive sectors with complementary business models.
Income Statement Comparison
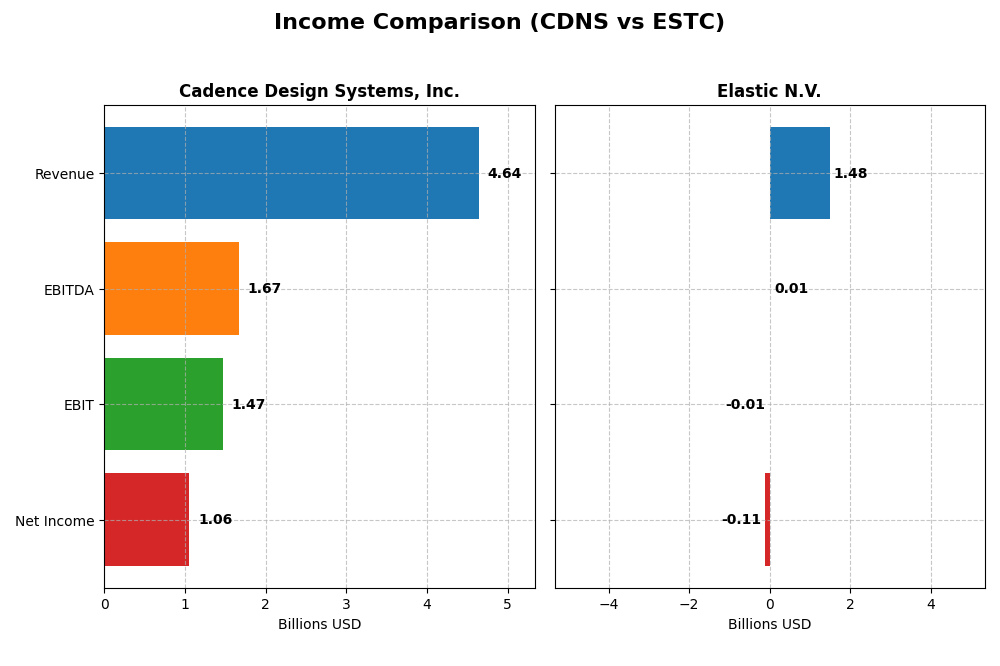
This table compares the key income statement metrics for Cadence Design Systems, Inc. and Elastic N.V. based on their most recent fiscal year data.
| Metric | Cadence Design Systems, Inc. | Elastic N.V. |
|---|---|---|
| Market Cap | 86.4B | 7.5B |
| Revenue | 4.64B | 1.48B |
| EBITDA | 1.67B | 6.1M |
| EBIT | 1.47B | -6.3M |
| Net Income | 1.06B | -108.1M |
| EPS | 3.89 | -1.04 |
| Fiscal Year | 2024 | 2025 |
Income Statement Interpretations
Cadence Design Systems, Inc.
Cadence Design Systems exhibited strong revenue growth from 2020 to 2024, rising from $2.68B to $4.64B, with net income also increasing substantially from $591M to $1.06B. Margins remained robust, with gross margin at 86.05% and net margin near 23% in 2024. The latest year showed a favorable 13.5% revenue increase, although net margin slightly declined by 10.7%, indicating some pressure on profitability despite overall growth.
Elastic N.V.
Elastic’s revenue surged from $608M in 2021 to $1.48B in 2025, with net income fluctuating and turning negative in the most recent year at -$108M. Gross margin held at a respectable 74.4%, but EBIT margin was negative at -0.42%, reflecting operating losses. The 2025 fiscal year saw a strong 17% revenue growth and a 94% EBIT improvement, yet net margin deteriorated sharply, signaling ongoing challenges in converting growth into profitability.
Which one has the stronger fundamentals?
Cadence Design Systems demonstrates stronger fundamentals with consistently high and improving profitability margins alongside steady revenue and net income growth. Elastic, while growing revenue rapidly, struggles with profitability and negative net margins, highlighting operational challenges. Both companies have favorable income statement evaluations overall, but Cadence’s more stable profit generation suggests a more resilient earnings profile.
Financial Ratios Comparison
The table below presents the most recent financial ratios for Cadence Design Systems, Inc. (CDNS) and Elastic N.V. (ESTC) as of their latest fiscal years, to facilitate a clear comparison of key performance and financial health metrics.
| Ratios | Cadence Design Systems, Inc. (2024) | Elastic N.V. (2025) |
|---|---|---|
| ROE | 22.58% | -11.66% |
| ROIC | 13.43% | -3.45% |
| P/E | 77.20 | -82.65 |
| P/B | 17.44 | 9.64 |
| Current Ratio | 2.93 | 1.92 |
| Quick Ratio | 2.74 | 1.92 |
| D/E | 0.55 | 0.64 |
| Debt-to-Assets | 28.80% | 22.95% |
| Interest Coverage | 17.77 | -2.17 |
| Asset Turnover | 0.52 | 0.57 |
| Fixed Asset Turnover | 7.68 | 51.28 |
| Payout ratio | 0 | 0 |
| Dividend yield | 0 | 0 |
Interpretation of the Ratios
Cadence Design Systems, Inc.
Cadence Design Systems shows predominantly strong financial ratios with favorable net margin at 22.74%, ROE at 22.58%, and ROIC at 13.43%, supported by a robust current ratio of 2.93. However, valuation multiples like PE at 77.2 and PB at 17.44 are unfavorable, indicating potentially high market expectations. The company does not pay dividends, focusing instead on growth and reinvestment.
Elastic N.V.
Elastic N.V.’s ratios reveal several weaknesses, including negative net margin (-7.29%), ROE (-11.66%), and ROIC (-3.45%), reflecting operational challenges. The interest coverage ratio is also unfavorable at -0.25, despite a decent current ratio of 1.92. Elastic does not pay dividends, likely due to ongoing reinvestment and a growth phase, with no indication of share buybacks.
Which one has the best ratios?
Cadence Design Systems has a more favorable overall ratio profile, with 57.14% favorable metrics and strong profitability and liquidity measures. In contrast, Elastic exhibits a more mixed profile with 42.86% unfavorable ratios and persistent losses. Thus, Cadence presents a stronger financial standing based on the provided ratios.
Strategic Positioning
This section compares the strategic positioning of Cadence Design Systems, Inc. and Elastic N.V. across market position, key segments, and exposure to technological disruption:
Cadence Design Systems, Inc.
- Leading provider in software and hardware for IC design; faces competition in semiconductor tools industry.
- Key segments include product and maintenance with $4.2B revenue, plus technology services; serves 5G, automotive, aerospace sectors.
- Exposure includes advanced IC design tools and verification platforms; innovation critical to chip manufacturing efficiency.
Elastic N.V.
- Focused on search technology solutions for multi-cloud environments; competes in cloud software and analytics markets.
- Dominates subscription-based software with $1.38B revenue and professional services; targets data search, analysis, and visualization.
- Faces disruption from evolving cloud technologies and data analytics; Elastic Stack adapts to diverse data formats and sources.
Cadence Design Systems, Inc. vs Elastic N.V. Positioning
Cadence’s diversified approach spans hardware, software, and services in semiconductor design, benefiting multiple high-tech markets. Elastic concentrates on cloud-based search and analytics software, relying heavily on subscription revenue. Cadence’s broader portfolio may provide stability, while Elastic’s focused model targets niche cloud applications.
Which has the best competitive advantage?
Cadence shows a slightly favorable moat with value creation despite declining profitability, indicating efficient capital use. Elastic has a slightly unfavorable moat, shedding value but improving profitability. Cadence currently holds a stronger competitive advantage based on MOAT evaluation.
Stock Comparison
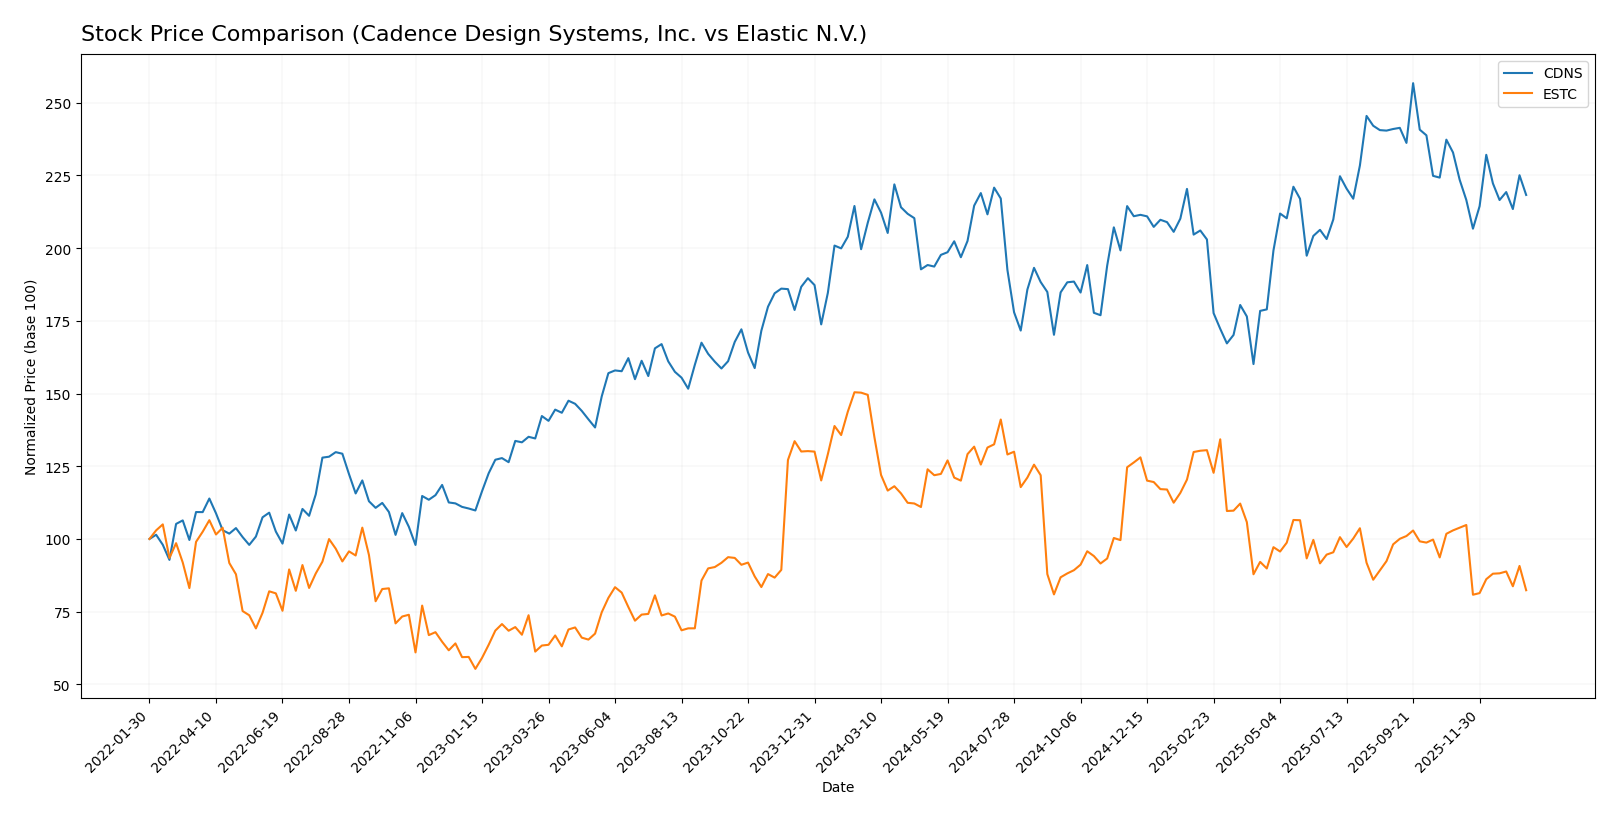
The stock price movements of Cadence Design Systems, Inc. (CDNS) and Elastic N.V. (ESTC) over the past 12 months reveal contrasting dynamics, with CDNS showing mild gains amid decelerating momentum while ESTC experiences significant declines despite strong buyer dominance.
Trend Analysis
Cadence Design Systems, Inc. (CDNS) exhibited a bullish trend over the past year with a 4.59% price increase, though momentum has decelerated. The stock ranged between 232.88 and 373.35, showing notable volatility with a standard deviation of 29.12.
Elastic N.V. (ESTC) faced a bearish trend marked by a 44.93% price decline over the same period, also with decelerating downward momentum. Its price fluctuated between 70.04 and 129.62, with a lower volatility indicated by a 14.08 standard deviation.
Comparing both, CDNS delivered the highest market performance with a positive price change, contrasting with ESTC’s significant negative trend over the past year.
Target Prices
The consensus target prices from recognized analysts indicate optimistic outlooks for both companies.
| Company | Target High | Target Low | Consensus |
|---|---|---|---|
| Cadence Design Systems, Inc. | 418 | 275 | 381 |
| Elastic N.V. | 134 | 76 | 108 |
Analysts expect Cadence Design Systems’ stock to appreciate significantly from the current $317.45, while Elastic’s consensus target price of $108 suggests a strong upside from its current $71.38.
Analyst Opinions Comparison
This section compares analysts’ ratings and grades for Cadence Design Systems, Inc. (CDNS) and Elastic N.V. (ESTC):
Rating Comparison
CDNS Rating
- Rating: B, evaluated as Very Favorable overall.
- Discounted Cash Flow Score: 3, indicating a moderate valuation perspective.
- ROE Score: 4, reflecting a favorable ability to generate profit from equity.
- ROA Score: 5, very favorable asset utilization effectiveness.
- Debt To Equity Score: 2, moderate financial risk level.
- Overall Score: 3, indicating a moderate overall financial standing.
ESTC Rating
- Rating: C-, also marked as Very Favorable overall.
- Discounted Cash Flow Score: 3, similarly moderate valuation perspective.
- ROE Score: 1, showing very unfavorable efficiency in profit generation.
- ROA Score: 1, very unfavorable asset utilization effectiveness.
- Debt To Equity Score: 1, very unfavorable financial risk profile.
- Overall Score: 1, indicating a very unfavorable overall financial standing.
Which one is the best rated?
Based strictly on the provided data, CDNS is better rated overall with a higher rating (B vs. C-) and stronger financial scores in ROE, ROA, debt to equity, and overall score. ESTC scores are mostly very unfavorable except for its moderate discounted cash flow score.
Scores Comparison
Here is a comparison of the Altman Z-Score and Piotroski Score for Cadence Design Systems and Elastic N.V.:
CDNS Scores
- Altman Z-Score: 14.51, indicating a safe zone, very low bankruptcy risk.
- Piotroski Score: 7, classified as strong financial health.
ESTC Scores
- Altman Z-Score: 3.51, in the safe zone, low bankruptcy risk.
- Piotroski Score: 4, classified as average financial health.
Which company has the best scores?
Based strictly on the provided data, CDNS has higher Altman Z-Score and Piotroski Score values than ESTC, indicating stronger financial stability and health in comparison.
Grades Comparison
Here is a detailed comparison of recent grades assigned to Cadence Design Systems, Inc. and Elastic N.V.:
Cadence Design Systems, Inc. Grades
This table shows the latest grades from recognized grading companies for Cadence Design Systems, Inc.:
| Grading Company | Action | New Grade | Date |
|---|---|---|---|
| Needham | Maintain | Buy | 2025-12-22 |
| Wells Fargo | Maintain | Overweight | 2025-10-28 |
| Baird | Maintain | Outperform | 2025-10-28 |
| Needham | Maintain | Buy | 2025-10-28 |
| JP Morgan | Maintain | Overweight | 2025-10-28 |
| Oppenheimer | Maintain | Underperform | 2025-10-28 |
| Rosenblatt | Maintain | Neutral | 2025-10-28 |
| Rosenblatt | Maintain | Neutral | 2025-10-22 |
| Needham | Maintain | Buy | 2025-07-29 |
| Loop Capital | Maintain | Buy | 2025-07-29 |
Overall, Cadence’s grades predominantly indicate positive analyst sentiment, with multiple “Buy,” “Outperform,” and “Overweight” ratings, alongside a few neutral and one underperform opinion.
Elastic N.V. Grades
This table presents recent grades given by reputable grading firms for Elastic N.V.:
| Grading Company | Action | New Grade | Date |
|---|---|---|---|
| Barclays | Maintain | Overweight | 2026-01-12 |
| RBC Capital | Maintain | Outperform | 2026-01-05 |
| Jefferies | Maintain | Buy | 2026-01-05 |
| Citigroup | Maintain | Buy | 2025-11-24 |
| Wedbush | Maintain | Outperform | 2025-11-21 |
| B of A Securities | Maintain | Neutral | 2025-11-21 |
| Guggenheim | Maintain | Buy | 2025-11-21 |
| Wells Fargo | Maintain | Equal Weight | 2025-11-21 |
| RBC Capital | Maintain | Outperform | 2025-11-21 |
| Canaccord Genuity | Maintain | Buy | 2025-11-21 |
Elastic’s grades show a strong positive consensus with multiple “Buy,” “Outperform,” and “Overweight” ratings, some neutral, and no sell or underperform grades.
Which company has the best grades?
Both Cadence Design Systems and Elastic have received predominantly positive grades, but Elastic N.V. displays a slightly broader range of “Buy” and “Outperform” ratings with no underperform grades, potentially signaling stronger analyst confidence. This may impact investors’ perception of growth and risk differently between the two companies.
Strengths and Weaknesses
Below is a comparison of the key strengths and weaknesses of Cadence Design Systems, Inc. (CDNS) and Elastic N.V. (ESTC) based on recent financial and strategic data.
| Criterion | Cadence Design Systems, Inc. (CDNS) | Elastic N.V. (ESTC) |
|---|---|---|
| Diversification | Strong product and maintenance revenue stream (~$4.2B in 2024), with growing technology services | Heavy reliance on subscription revenue (~$1.38B in 2025), less diversified with smaller professional services segment |
| Profitability | High net margin (22.74%), ROIC (13.43%), and ROE (22.58%) – favorable profitability ratios | Negative net margin (-7.29%), ROIC (-3.45%), and ROE (-11.66%) – currently unprofitable but improving ROIC trend |
| Innovation | Consistent investment in technology services, supporting product growth | Increasing ROIC trend (+85.8%) indicates improving efficiency and innovation potential |
| Global presence | Established presence with diversified product lines globally | Growing global subscription base but still developing broader market penetration |
| Market Share | Leading position in electronic design automation with strong market share | Niche player in search and data analytics with increasing adoption |
In summary, Cadence Design Systems demonstrates solid profitability and diversified revenue streams, though its ROIC is declining. Elastic shows improving profitability trends and innovation but currently struggles with negative margins and value destruction. Investors should weigh CDNS’s stability against ESTC’s growth potential and elevated risk.
Risk Analysis
Below is a comparative risk analysis table for Cadence Design Systems, Inc. (CDNS) and Elastic N.V. (ESTC) based on the most recent data available for 2025-2026.
| Metric | Cadence Design Systems, Inc. (CDNS) | Elastic N.V. (ESTC) |
|---|---|---|
| Market Risk | Moderate (Beta 1.02, stable tech sector) | Moderate (Beta 0.93, volatile software market) |
| Debt Level | Moderate (Debt/Equity 0.55, favorable coverage) | Moderate (Debt/Equity 0.64, weaker interest coverage) |
| Regulatory Risk | Low (US-based, established compliance) | Moderate (US and EU exposure, evolving privacy laws) |
| Operational Risk | Low (Strong operational efficiency, Piotroski 7) | Moderate (Negative margins, Piotroski 4) |
| Environmental Risk | Low (Technology sector, low direct impact) | Low (Cloud software, limited environmental footprint) |
| Geopolitical Risk | Moderate (Global chip design customers) | Moderate (Multi-cloud global operations) |
In synthesis, Cadence exhibits lower operational and financial risk with strong profitability and balance sheet health, despite high valuation multiples. Elastic faces higher operational and financial risks due to negative profitability and weaker coverage ratios. Market and geopolitical risks are similar given their global technology exposure. Investors should prioritize Cadence for stability but monitor valuation risks, while Elastic requires caution due to ongoing losses and regulatory uncertainties.
Which Stock to Choose?
Cadence Design Systems, Inc. (CDNS) shows favorable income evolution with strong revenue and net income growth over 2020-2024. Its financial ratios are mostly favorable, highlighting solid profitability and manageable debt. The company carries a slightly favorable moat, despite a declining ROIC trend. Its rating is very favorable with a safe Altman Z-Score and a strong Piotroski score.
Elastic N.V. (ESTC) presents a mixed income evolution with positive revenue growth but negative net margins and profitability ratios over 2021-2025. Financial ratios are neutral overall, with several unfavorable profitability metrics and a slightly unfavorable moat due to value destruction despite improving ROIC. It holds a very favorable rating but with a lower Piotroski score and a safe Altman Z-Score.
Investors seeking stability and consistent value creation might find CDNS’s solid profitability and financial health more appealing, while those with higher risk tolerance or a focus on growth potential could view ESTC’s improving profitability trend and revenue expansion as worth monitoring. The choice might depend on individual risk profiles and investment strategies.
Disclaimer: Investment carries a risk of loss of initial capital. The past performance is not a reliable indicator of future results. Be sure to understand risks before making an investment decision.
Go Further
I encourage you to read the complete analyses of Cadence Design Systems, Inc. and Elastic N.V. to enhance your investment decisions: