In today’s fast-evolving tech landscape, choosing the right software company to invest in requires a sharp eye for innovation and market positioning. Cadence Design Systems, Inc. (CDNS) and Domo, Inc. (DOMO) both operate in the software application industry but serve distinct niches—Cadence focuses on integrated circuit design and verification, while Domo specializes in cloud-based business intelligence platforms. This article will help you decide which company presents the most compelling opportunity for your investment portfolio.
Table of contents
Companies Overview
I will begin the comparison between Cadence Design Systems, Inc. and Domo, Inc. by providing an overview of these two companies and their main differences.
Cadence Design Systems Overview
Cadence Design Systems, Inc. is a technology company specializing in software, hardware, and services for integrated circuit design and verification. Founded in 1987 and based in San Jose, California, Cadence serves diverse markets including 5G communications, aerospace, automotive, and healthcare. Its offerings include verification platforms, digital IC design tools, and intellectual property products, positioning it as a leader in the semiconductor design industry.
Domo Overview
Domo, Inc. operates a cloud-based business intelligence platform that connects organizational data and people from executives to frontline employees. Established in 2010 and headquartered in American Fork, Utah, Domo enables real-time data access and business management via smartphones. It focuses on delivering insights and connectivity to businesses across the U.S., Japan, and international markets through its software application.
Key similarities and differences
Both companies operate in the software application industry within the technology sector and are publicly traded on NASDAQ. Cadence focuses on semiconductor design automation and verification tools, serving hardware-intensive industries, while Domo provides cloud-based business intelligence aimed at organizational data management. Cadence has a significantly larger market capitalization and workforce, reflecting its established position compared to Domo’s more specialized and smaller-scale business model.
Income Statement Comparison
This table presents a side-by-side comparison of the most recent fiscal year income statement metrics for Cadence Design Systems, Inc. and Domo, Inc., providing insight into their financial performance.
| Metric | Cadence Design Systems, Inc. | Domo, Inc. |
|---|---|---|
| Market Cap | 86.4B | 257M |
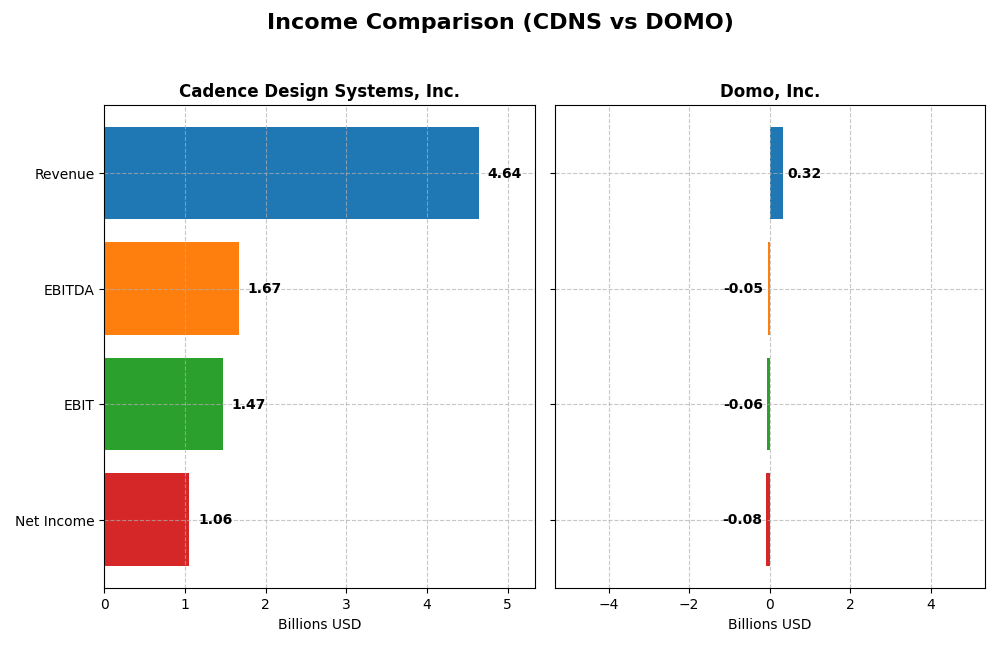
| Revenue | 4.64B | 317M |
| EBITDA | 1.67B | -50M |
| EBIT | 1.47B | -59M |
| Net Income | 1.06B | -82M |
| EPS | 3.89 | -2.13 |
| Fiscal Year | 2024 | 2025 |
Income Statement Interpretations
Cadence Design Systems, Inc.
Cadence Design Systems has shown consistent revenue growth from 2020 to 2024, reaching $4.64B in 2024, with net income rising to $1.06B. Margins remain strong and stable, with a gross margin of 86.05% and net margin around 22.74%. The most recent year saw a favorable 13.48% revenue increase but a slight net margin decline by 10.66%, indicating some margin pressure despite overall growth.
Domo, Inc.
Domo’s revenue increased overall to $317M in 2025 but declined slightly by 0.61% compared to 2024. The company continues to report negative net income, worsening to a loss of $82M in 2025. While its gross margin remains favorable at 74.45%, EBIT and net margins are negative, reflecting ongoing profitability challenges and a 9.09% decline in net margin growth in the last year.
Which one has the stronger fundamentals?
Cadence Design Systems displays stronger fundamentals with robust revenue and net income growth, high and stable margins, and mostly favorable income statement metrics. In contrast, Domo struggles with sustained losses, negative EBIT and net margins, and recent declines in profitability measures. The overall income statement evaluation favors Cadence due to its consistent profitability and margin strength.
Financial Ratios Comparison
The table below presents the most recent financial ratios for Cadence Design Systems, Inc. (CDNS) and Domo, Inc. (DOMO) based on their latest fiscal year data, providing a snapshot of their financial health and valuation metrics.
| Ratios | Cadence Design Systems, Inc. (CDNS) (2024) | Domo, Inc. (DOMO) (2025) |
|---|---|---|
| ROE | 22.6% | 46.2% |
| ROIC | 13.4% | 194.7% |
| P/E | 77.2 | -3.98 |
| P/B | 17.4 | -1.84 |
| Current Ratio | 2.93 | 0.56 |
| Quick Ratio | 2.74 | 0.56 |
| D/E (Debt to Equity) | 0.55 | -0.76 |
| Debt-to-Assets | 28.8% | 63.2% |
| Interest Coverage | 17.8 | -3.0 |
| Asset Turnover | 0.52 | 1.48 |
| Fixed Asset Turnover | 7.68 | 8.17 |
| Payout Ratio | 0 | 0 |
| Dividend Yield | 0 | 0 |
Interpretation of the Ratios
Cadence Design Systems, Inc.
Cadence Design Systems shows a generally favorable financial profile with strong net margin (22.74%), ROE (22.58%), and ROIC (13.43%), indicating efficient profitability and capital use. However, elevated valuation multiples like a PE of 77.2 and PB of 17.44 suggest overvaluation risks. The company does not pay dividends, likely focusing on reinvestment and growth opportunities.
Domo, Inc.
Domo’s ratios present a mixed picture with a negative net margin of -25.84%, signaling operational challenges, yet very high ROE (46.23%) and ROIC (194.73%) indicate strong returns on invested capital. Liquidity ratios are weak, with a current ratio of 0.56, raising short-term solvency concerns. It does not pay dividends, reflecting a focus on growth and reinvestment amid losses.
Which one has the best ratios?
Cadence Design Systems holds a more favorable ratio profile overall, balancing profitability and liquidity with moderate leverage. Domo’s financials are more volatile and riskier, marked by negative profitability and liquidity issues despite impressive returns on capital. Thus, Cadence’s ratios appear more stable and consistent compared to Domo’s mixed metrics.
Strategic Positioning
This section compares the strategic positioning of Cadence Design Systems (CDNS) and Domo (DOMO) in terms of market position, key segments, and exposure to technological disruption:
Cadence Design Systems, Inc.
- Leading software provider in IC design with strong competitive pressure in tech applications.
- Focuses on integrated circuit design software, verification, and IP products; key drivers include 5G, automotive, aerospace sectors.
- Exposure to disruption through evolving chip design technologies and verification platforms in semiconductor industry.
Domo, Inc.
- Smaller cloud-based BI platform with high beta, facing competitive pressure in data analytics market.
- Concentrates on subscription-based cloud BI services, linking CEOs to frontline employees through real-time data.
- Exposure to disruption from cloud computing advances and evolving business intelligence technologies.
Cadence Design Systems, Inc. vs Domo, Inc. Positioning
Cadence operates a diversified portfolio spanning multiple tech sectors including 5G and automotive, offering software and hardware solutions. Domo concentrates on subscription cloud BI services, focusing on organizational data connectivity. Cadence’s scale contrasts with Domo’s niche focus and smaller workforce.
Which has the best competitive advantage?
Based on MOAT evaluation, Domo shows a very favorable moat with growing ROIC, indicating durable competitive advantage. Cadence also creates value but with a slightly favorable moat and declining ROIC, suggesting less robust profitability sustainability.
Stock Comparison
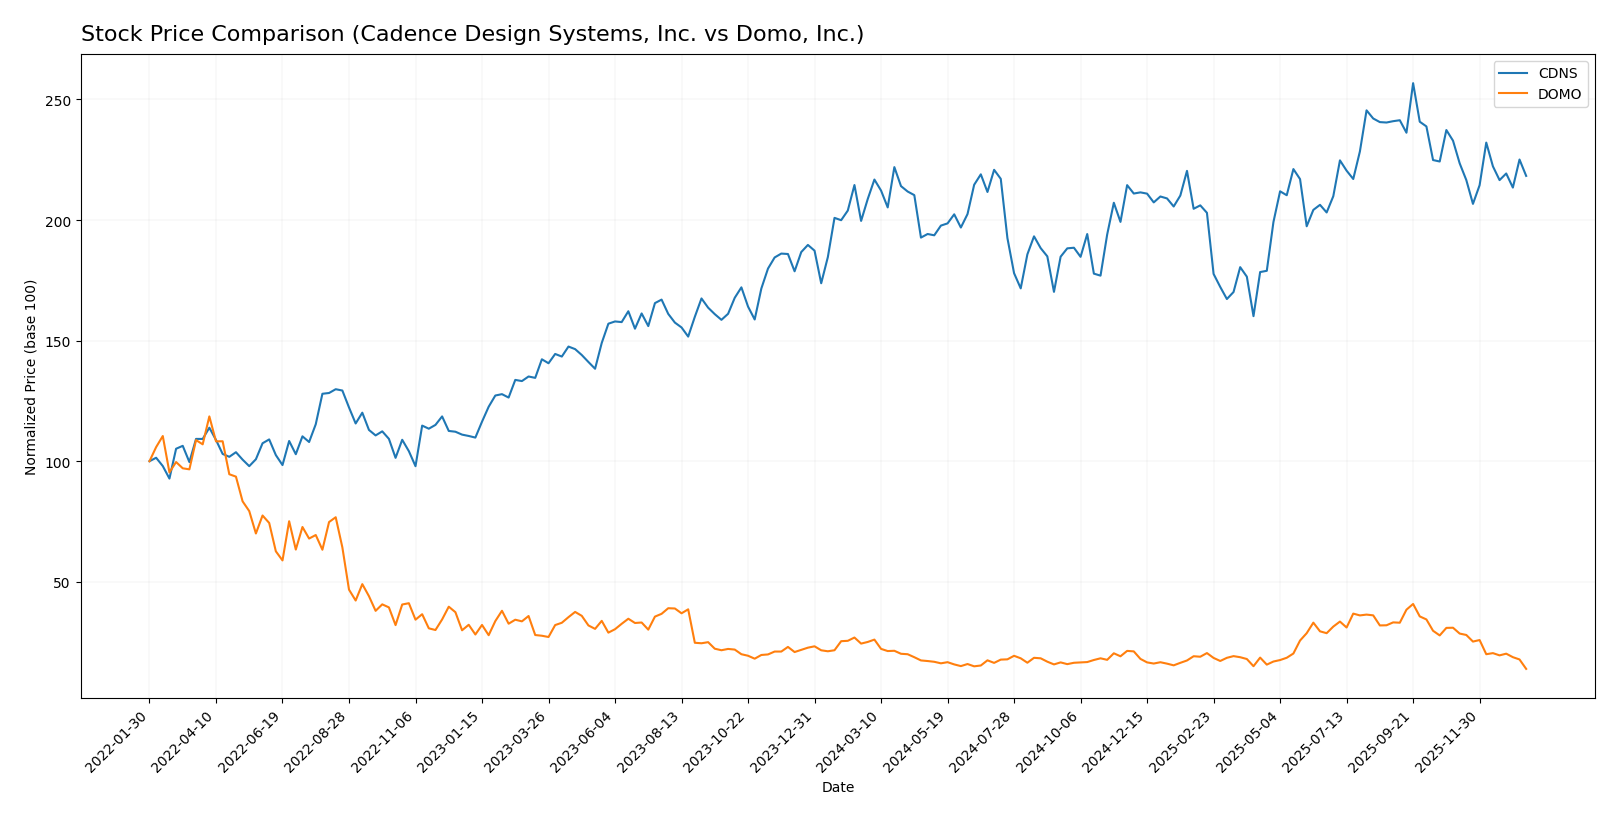
The stock prices of Cadence Design Systems, Inc. (CDNS) and Domo, Inc. (DOMO) have exhibited contrasting dynamics over the past 12 months, with CDNS showing moderate gains and DOMO enduring significant declines amid shifting buyer-seller balances.
Trend Analysis
Cadence Design Systems, Inc. recorded a 4.59% price increase over the past year, indicating a bullish trend with decelerating momentum. The stock showed notable volatility with a 29.12 standard deviation, peaking at 373.35 and bottoming at 232.88.
Domo, Inc. experienced a 44.54% price decline over the same period, marking a bearish trend with deceleration. Its price volatility was much lower, with a 3.01 standard deviation, reaching a high of 18.06 and a low of 6.15.
Comparing both stocks, Cadence Design Systems has delivered the highest market performance over the past year, contrasting with Domo’s significant value erosion during this timeframe.
Target Prices
Here is the current target price consensus for Cadence Design Systems, Inc. and Domo, Inc.:
| Company | Target High | Target Low | Consensus |
|---|---|---|---|
| Cadence Design Systems, Inc. | 418 | 275 | 381 |
| Domo, Inc. | 13 | 10 | 11.5 |
Analysts expect Cadence’s stock to rise above its current price of $317.45, reflecting strong confidence. Domo’s consensus target of $11.5 also suggests potential upside from its current $6.15 price.
Analyst Opinions Comparison
This section compares analysts’ ratings and grades for Cadence Design Systems, Inc. and Domo, Inc.:
Rating Comparison
CDNS Rating
- Rating: B, considered very favorable by analysts.
- Discounted Cash Flow Score: 3, indicating moderate valuation.
- ROE Score: 4, showing favorable profit generation from equity.
- ROA Score: 5, very favorable use of assets to generate earnings.
- Debt To Equity Score: 2, moderate financial risk level.
- Overall Score: 3, moderate overall financial standing.
DOMO Rating
- Rating: C, also marked as very favorable despite lower grade.
- Discounted Cash Flow Score: 1, considered very unfavorable.
- ROE Score: 5, rated very favorable for equity returns.
- ROA Score: 1, very unfavorable asset utilization.
- Debt To Equity Score: 1, very unfavorable due to higher risk.
- Overall Score: 2, moderate but lower than CDNS.
Which one is the best rated?
Based strictly on provided data, Cadence Design Systems holds a higher overall rating (B vs. C) with better discounted cash flow and asset utilization scores. Although Domo shows a stronger ROE, its weaker scores in other financial metrics result in a lower overall assessment.
Scores Comparison
The following table presents a comparison of Cadence Design Systems, Inc. (CDNS) and Domo, Inc. (DOMO) based on their Altman Z-Score and Piotroski Score:
CDNS Scores
- Altman Z-Score: 14.51, indicating a safe zone with very low bankruptcy risk.
- Piotroski Score: 7, representing strong financial health.
DOMO Scores
- Altman Z-Score: -10.10, indicating distress zone with high bankruptcy risk.
- Piotroski Score: 3, categorized as very weak financial strength.
Which company has the best scores?
Based strictly on the data, CDNS has significantly better scores than DOMO, with a much higher Altman Z-Score in the safe zone and a stronger Piotroski Score. DOMO’s scores suggest financial distress and weak financial health.
Grades Comparison
The grades from various reliable financial institutions for Cadence Design Systems, Inc. and Domo, Inc. are summarized below:
Cadence Design Systems, Inc. Grades
This table lists recent grades from reputable grading companies for Cadence Design Systems, Inc.:
| Grading Company | Action | New Grade | Date |
|---|---|---|---|
| Needham | Maintain | Buy | 2025-12-22 |
| Wells Fargo | Maintain | Overweight | 2025-10-28 |
| Baird | Maintain | Outperform | 2025-10-28 |
| Needham | Maintain | Buy | 2025-10-28 |
| JP Morgan | Maintain | Overweight | 2025-10-28 |
| Oppenheimer | Maintain | Underperform | 2025-10-28 |
| Rosenblatt | Maintain | Neutral | 2025-10-28 |
| Rosenblatt | Maintain | Neutral | 2025-10-22 |
| Needham | Maintain | Buy | 2025-07-29 |
| Loop Capital | Maintain | Buy | 2025-07-29 |
Most grades for Cadence Design Systems, Inc. indicate a positive outlook with numerous “Buy” and “Overweight” ratings, though a minority maintain “Neutral” or “Underperform” stances.
Domo, Inc. Grades
This table presents recent grades from reputable grading companies for Domo, Inc.:
| Grading Company | Action | New Grade | Date |
|---|---|---|---|
| DA Davidson | Maintain | Neutral | 2025-12-05 |
| TD Cowen | Maintain | Buy | 2025-12-05 |
| Lake Street | Maintain | Hold | 2025-12-05 |
| DA Davidson | Maintain | Neutral | 2025-12-01 |
| JMP Securities | Maintain | Market Outperform | 2025-09-10 |
| DA Davidson | Maintain | Neutral | 2025-08-28 |
| Cantor Fitzgerald | Maintain | Overweight | 2025-08-28 |
| TD Cowen | Upgrade | Buy | 2025-08-26 |
| JMP Securities | Maintain | Market Outperform | 2025-06-25 |
| Cantor Fitzgerald | Maintain | Overweight | 2025-06-25 |
Grades for Domo, Inc. show a generally positive trend with multiple “Buy,” “Market Outperform,” and “Overweight” ratings, alongside several “Neutral” and “Hold” grades.
Which company has the best grades?
Cadence Design Systems, Inc. has received a greater number of consistent “Buy” and “Overweight” ratings compared to Domo, Inc., which shows a mixed profile with some “Neutral” and “Hold” grades. This difference may influence investors’ confidence levels regarding the growth potential and risk profiles of the two companies.
Strengths and Weaknesses
Below is a comparison of key strengths and weaknesses for Cadence Design Systems, Inc. (CDNS) and Domo, Inc. (DOMO) based on the most recent financial and operational data.
| Criterion | Cadence Design Systems, Inc. (CDNS) | Domo, Inc. (DOMO) |
|---|---|---|
| Diversification | Strong product & maintenance revenue stream ($4.21B in 2024); moderate technology services | Primarily subscription-based ($286M in 2025) with smaller professional services segment |
| Profitability | High net margin (22.74%), ROIC 13.43%, favorable ratios overall | Negative net margin (-25.84%) but high ROE (46.23%) and ROIC (194.73%); mixed financial health |
| Innovation | Consistent investment in product updates and tech services; slightly declining ROIC trend | Rapidly growing ROIC and profitability suggest innovation-driven growth |
| Global presence | Established global footprint in semiconductor design industry | Growing presence but smaller scale and limited diversification |
| Market Share | Leading market share in electronic design automation | Niche player in business intelligence and analytics |
Key takeaways: Cadence Design Systems shows solid profitability with stable diversification but faces a slight decline in ROIC, signaling caution. Domo demonstrates strong growth in profitability and innovation but struggles with current profitability and liquidity ratios, implying higher risk but potential for value creation.
Risk Analysis
Below is a comparative overview of key risks for Cadence Design Systems, Inc. (CDNS) and Domo, Inc. (DOMO) based on the most recent financial and operational data.
| Metric | Cadence Design Systems, Inc. (CDNS) | Domo, Inc. (DOMO) |
|---|---|---|
| Market Risk | Moderate (Beta 1.02, stable tech sector) | High (Beta 1.65, volatile small cap) |
| Debt level | Moderate (Debt/Equity 0.55, debt to assets 28.8%) | High (Negative DE ratio, debt to assets 63.2%) |
| Regulatory Risk | Low (US technology, stable environment) | Low (US technology, stable environment) |
| Operational Risk | Low (Strong product portfolio, diversified clients) | High (Smaller scale, dependency on cloud platform) |
| Environmental Risk | Low (Software sector with limited direct impact) | Low (Software sector with limited direct impact) |
| Geopolitical Risk | Moderate (Global supply chain exposure) | Moderate (International presence, smaller scale) |
The most impactful risks are Domo’s high debt level and operational vulnerabilities, reflected in its distress-level Altman Z-Score and weak Piotroski score. Cadence’s risks are more moderate, with a strong balance sheet and stable operations, though its high valuation multiples pose some market risk. Investors should weigh Domo’s financial distress against its growth potential and Cadence’s stability against its premium price.
Which Stock to Choose?
Cadence Design Systems, Inc. (CDNS) shows favorable income evolution with 13.48% revenue growth in 2024 and strong profitability metrics including a 22.74% net margin. Its financial ratios are largely positive, featuring a current ratio of 2.93 and a debt-to-assets ratio of 28.8%. Despite a high P/E of 77.2, the company maintains a very favorable rating of B and strong scores indicating financial stability and low bankruptcy risk.
Domo, Inc. (DOMO) faces unfavorable income trends with net margin at -25.84% and declining revenue growth of -0.61% in 2025. Financial ratios are mixed: high ROE and ROIC but poor liquidity with current and quick ratios at 0.56 and a debt-to-assets ratio of 63.23%. The company holds a very favorable rating of C but shows distress in Altman Z-Score and weak Piotroski scores, signaling financial vulnerability.
Investors seeking stability and consistent profitability might find CDNS more aligned with a quality or growth investing profile due to its favorable income and financial ratios, while those with a tolerance for higher risk and interest in turnaround potential could see DOMO’s improving ROIC and competitive advantage as a sign of possible growth, despite weaker income and liquidity metrics.
Disclaimer: Investment carries a risk of loss of initial capital. The past performance is not a reliable indicator of future results. Be sure to understand risks before making an investment decision.
Go Further
I encourage you to read the complete analyses of Cadence Design Systems, Inc. and Domo, Inc. to enhance your investment decisions: