In the fast-evolving technology sector, Cadence Design Systems, Inc. (CDNS) and Arm Holdings plc (ARM) stand out as leaders driving innovation in semiconductor design and software solutions. Both companies serve overlapping markets, including automotive, computing, and mobile technologies, yet they approach growth through distinct strategies in chip design and intellectual property. This article will analyze their strengths and risks to help investors identify the most compelling opportunity for their portfolio.
Table of contents
Companies Overview
I will begin the comparison between Cadence Design Systems and Arm Holdings by providing an overview of these two companies and their main differences.
Cadence Design Systems Overview
Cadence Design Systems, Inc. focuses on providing software, hardware, and services for integrated circuit (IC) design and verification worldwide. The company’s mission is to enable advanced chip design through products like functional verification platforms, digital IC design tools, and IP products. Headquartered in San Jose, California, Cadence serves diverse markets including 5G communications, aerospace, automotive, and consumer electronics.
Arm Holdings Overview
Arm Holdings plc develops and licenses CPU products and related technologies used by semiconductor companies and original equipment manufacturers globally. Its product portfolio includes microprocessors, graphics IP, and software tools, serving sectors such as automotive, computing infrastructure, and IoT. Based in Cambridge, UK, Arm operates internationally and is a subsidiary of Kronos II LLC, emphasizing innovation in semiconductor architecture.
Key similarities and differences
Both companies operate in the technology sector, focusing on enabling semiconductor and electronic product development. Cadence offers a broad range of design and verification solutions, emphasizing software and hardware for IC design, while Arm specializes in CPU architecture and licensing IP cores. Cadence targets a wider set of markets with design tools, whereas Arm centers on processor technology and system IP for various industries.
Income Statement Comparison
This table compares the key income statement metrics for Cadence Design Systems, Inc. and Arm Holdings plc for their most recent fiscal years.
| Metric | Cadence Design Systems, Inc. (2024) | Arm Holdings plc (2025) |
|---|---|---|
| Market Cap | 84.5B | 121.2B |
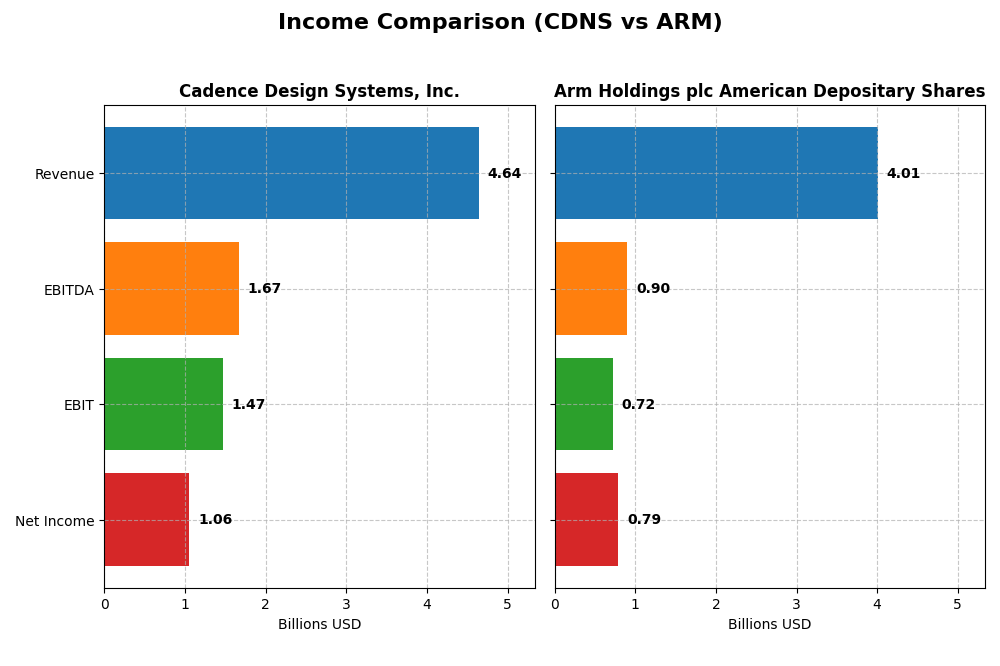
| Revenue | 4.64B | 4.01B |
| EBITDA | 1.67B | 903M |
| EBIT | 1.47B | 720M |
| Net Income | 1.06B | 792M |
| EPS | 3.89 | 0.75 |
| Fiscal Year | 2024 | 2025 |
Income Statement Interpretations
Cadence Design Systems, Inc.
Cadence Design Systems showed steady revenue growth from $2.68B in 2020 to $4.64B in 2024, with net income rising from $591M to $1.06B. Gross margins remained strong around 86%, and EBIT margins improved to 31.7%. The 2024 year saw revenue growth slow to 13.5%, while net margin slightly declined by 10.7%, indicating some margin pressure despite overall positive earnings expansion.
Arm Holdings plc American Depositary Shares
Arm Holdings’ revenue nearly doubled from $2.03B in 2021 to $4.01B in 2025, with net income increasing from $388M to $792M. The company maintained an exceptional gross margin near 95% but showed a lower EBIT margin of 18%. In 2025, Arm experienced robust 23.9% revenue growth and a strong net margin increase of 108.8%, reflecting significant profitability improvements and operational scaling.
Which one has the stronger fundamentals?
Both companies demonstrate favorable income statement trends with revenue and net income growth, but Arm outpaces Cadence with higher revenue growth rates and a superior gross margin. Cadence benefits from stronger EBIT margins and consistent profitability, whereas Arm shows more rapid margin expansion recently. Overall, Arm’s fundamentals appear more robust in growth dynamics, while Cadence offers steadier operating efficiency.
Financial Ratios Comparison
The table below compares key financial ratios for Cadence Design Systems, Inc. (CDNS) and Arm Holdings plc American Depositary Shares (ARM) based on the most recent fiscal year data available.
| Ratios | Cadence Design Systems, Inc. (CDNS) FY 2024 | Arm Holdings plc (ARM) FY 2025 Q1* |
|---|---|---|
| ROE | 22.6% | 11.6% |
| ROIC | 13.4% | 10.3% |
| P/E | 77.2 | 141.6 |
| P/B | 17.4 | 16.4 |
| Current Ratio | 2.93 | 5.20 |
| Quick Ratio | 2.74 | 5.20 |
| D/E (Debt-to-Equity) | 0.55 | 0.05 |
| Debt-to-Assets | 28.8% | 4.0% |
| Interest Coverage | 17.8 | 0 (not available) |
| Asset Turnover | 0.52 | 0.45 |
| Fixed Asset Turnover | 7.68 | 5.61 |
| Payout ratio | 0 | 0 |
| Dividend yield | 0% | 0% |
*Note: ARM ratios are based on the fiscal quarter ending March 31, 2025, the most recent data available.
Interpretation of the Ratios
Cadence Design Systems, Inc.
Cadence Design Systems exhibits generally strong financial ratios, including a favorable net margin of 22.74% and return on equity of 22.58%, indicating efficient profitability. The company maintains solid liquidity with a current ratio of 2.93 and low debt-to-assets at 28.8%. However, high P/E (77.2) and P/B (17.44) ratios may signal overvaluation concerns. Cadence does not pay dividends, consistent with its reinvestment strategy in R&D and growth.
Arm Holdings plc American Depositary Shares
Arm Holdings shows mixed ratio results, with a favorable net margin of 19.77% but neutral to unfavorable returns on equity (11.58%) and invested capital (10.28%). Its weighted average cost of capital is high at 23.74%, and valuation multiples like P/E (141.58) and P/B (16.4) are also elevated. The current ratio is unusually high at 5.2, suggesting excess liquidity. Arm does not distribute dividends, focusing instead on reinvestment and technology development.
Which one has the best ratios?
Cadence Design Systems presents a more favorable overall ratio profile, with a higher proportion of favorable metrics and stronger returns compared to Arm Holdings. Arm’s elevated valuation multiples, high cost of capital, and mixed profitability indicators contribute to a slightly unfavorable assessment. Cadence’s balance of profitability, liquidity, and debt management appears comparatively stronger based on the available data.
Strategic Positioning
This section compares the strategic positioning of Cadence Design Systems, Inc. and Arm Holdings plc, including Market position, Key segments, and exposure to technological disruption:
Cadence Design Systems, Inc.
- Market leader in software and hardware for IC design; faces competitive pressure in application software industry.
- Key segments include software, hardware, services for IC design, verification, and custom IC design; driven by 5G, automotive, and computing markets.
- Moderate exposure to technological disruption through evolving IC design tools and methodologies across multiple technology sectors.
Arm Holdings plc
- Leading semiconductor IP licensor with strong market presence; operates globally in a competitive semiconductor sector.
- Key segments are CPU products, system IPs, and licensing; business driven by automotive, computing infrastructure, consumer tech, and IoT markets.
- Exposure to disruption through innovation in microprocessors and system IPs amid fast-evolving semiconductor technology landscape.
Cadence Design Systems, Inc. vs Arm Holdings plc Positioning
Cadence has a diversified approach with software, hardware, and services across several tech markets, offering broad exposure but facing complex competition. Arm focuses on semiconductor IP licensing, concentrating on processor and system IP innovation, with global reach but narrower product scope.
Which has the best competitive advantage?
Cadence’s MOAT evaluation indicates value creation despite declining ROIC, suggesting some competitive strength. Arm shows an unfavorable MOAT with value destruction and stable profitability, indicating weaker competitive advantage based on ROIC versus WACC metrics.
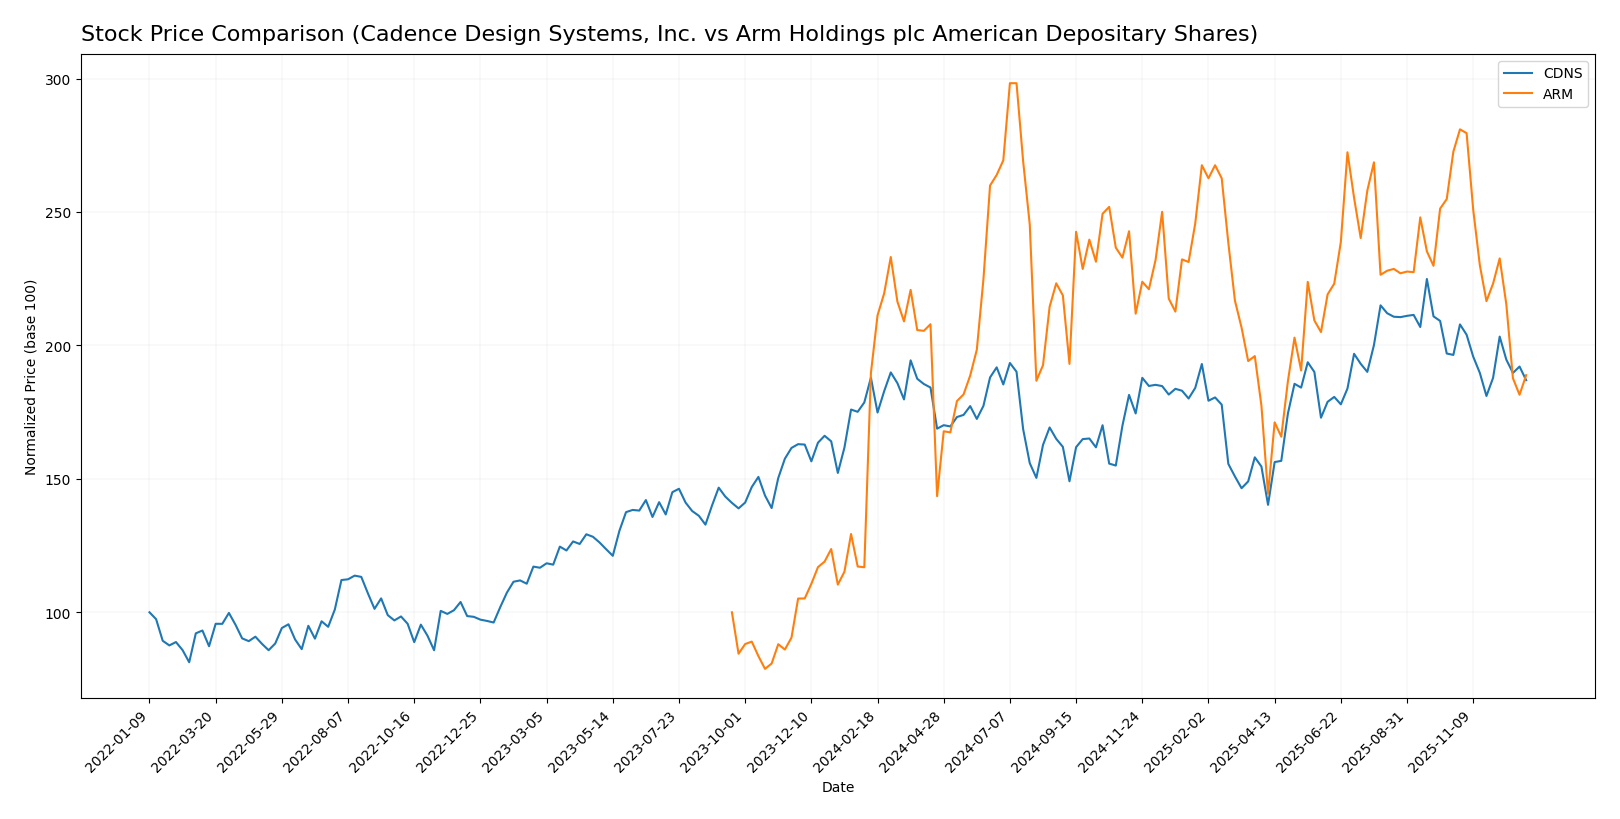
Stock Comparison
The stock price movements of Cadence Design Systems, Inc. and Arm Holdings plc over the past year reflect slight bearish trends with decelerating momentum and notable price fluctuations within their respective ranges.
Trend Analysis
Cadence Design Systems, Inc. experienced a minor bearish trend over the past 12 months with a price decline of 0.49%, decelerating momentum, and a volatility level marked by a 29.0 standard deviation. The stock ranged between 232.88 and 373.35.
Arm Holdings plc showed a similar minor bearish trend with a 0.42% price drop over the same period, decelerating trend acceleration, and lower volatility at a 19.03 standard deviation. Prices fluctuated between 87.19 and 181.19.
Comparing the two, both stocks delivered nearly equivalent slight bearish performances over the past year; however, Cadence exhibited a marginally larger price range and higher volatility than Arm.
Target Prices
The consensus target prices for Cadence Design Systems, Inc. and Arm Holdings plc indicate positive analyst expectations.
| Company | Target High | Target Low | Consensus |
|---|---|---|---|
| Cadence Design Systems, Inc. | 418 | 275 | 381 |
| Arm Holdings plc American Depositary Shares | 210 | 120 | 173.33 |
Analysts expect Cadence’s stock to rise from $310.4 toward a consensus target of $381, while Arm’s current price of $114.73 suggests potential growth to $173.33.
Analyst Opinions Comparison
This section compares analysts’ ratings and grades for Cadence Design Systems, Inc. (CDNS) and Arm Holdings plc American Depositary Shares (ARM):
Rating Comparison
CDNS Rating
- Rating: B, considered very favorable by analysts.
- Discounted Cash Flow Score: Moderate at 3, indicating fair valuation.
- ROE Score: Favorable at 4, showing good profit generation efficiency.
- ROA Score: Very favorable at 5, excellent asset utilization.
- Debt To Equity Score: Moderate at 2, indicating moderate financial risk.
- Overall Score: Moderate at 3, reflecting average overall financial standing.
ARM Rating
- Rating: B-, also considered very favorable by analysts.
- Discounted Cash Flow Score: Moderate at 2, slightly lower than CDNS.
- ROE Score: Moderate at 3, lower than CDNS for equity profit efficiency.
- ROA Score: Favorable at 4, strong but below CDNS.
- Debt To Equity Score: Favorable at 4, suggesting stronger balance sheet.
- Overall Score: Moderate at 3, on par with CDNS overall rating.
Which one is the best rated?
Based strictly on the provided data, CDNS holds higher scores in ROE and ROA, indicating better profit generation and asset use, while ARM has a stronger debt to equity position. Both have a moderate overall score of 3 but differ in specific financial strengths.
Scores Comparison
Here is a comparison of the Altman Z-Score and Piotroski Score for Cadence Design Systems (CDNS) and Arm Holdings (ARM):
CDNS Scores
- Altman Z-Score: 14.1, indicating a safe zone.
- Piotroski Score: 7, categorized as strong.
ARM Scores
- Altman Z-Score: 32.4, indicating a safe zone.
- Piotroski Score: 7, categorized as strong.
Which company has the best scores?
Both CDNS and ARM are in the safe zone regarding their Altman Z-Scores, with ARM having a notably higher score. Both companies share an identical Piotroski Score of 7, reflecting strong financial health.
Grades Comparison
The following section compares the latest available grades from recognized financial institutions for Cadence Design Systems, Inc. and Arm Holdings plc American Depositary Shares:
Cadence Design Systems, Inc. Grades
This table summarizes recent grades and actions from major grading companies for Cadence Design Systems, Inc.:
| Grading Company | Action | New Grade | Date |
|---|---|---|---|
| Needham | Maintain | Buy | 2025-12-22 |
| Oppenheimer | Maintain | Underperform | 2025-10-28 |
| Needham | Maintain | Buy | 2025-10-28 |
| Wells Fargo | Maintain | Overweight | 2025-10-28 |
| Baird | Maintain | Outperform | 2025-10-28 |
| JP Morgan | Maintain | Overweight | 2025-10-28 |
| Rosenblatt | Maintain | Neutral | 2025-10-28 |
| Rosenblatt | Maintain | Neutral | 2025-10-22 |
| Loop Capital | Maintain | Buy | 2025-07-29 |
| Mizuho | Maintain | Outperform | 2025-07-29 |
Overall, Cadence Design Systems shows a generally positive grade trend with multiple “Buy,” “Outperform,” and “Overweight” ratings, alongside a few neutral and one underperform opinion.
Arm Holdings plc American Depositary Shares Grades
This table presents recent grading activity from reputable firms on Arm Holdings plc ADS:
| Grading Company | Action | New Grade | Date |
|---|---|---|---|
| B of A Securities | Maintain | Buy | 2025-12-16 |
| Goldman Sachs | Downgrade | Sell | 2025-12-15 |
| Loop Capital | Maintain | Buy | 2025-11-12 |
| Rosenblatt | Maintain | Buy | 2025-11-06 |
| Barclays | Maintain | Overweight | 2025-11-06 |
| Mizuho | Maintain | Outperform | 2025-11-06 |
| Needham | Maintain | Hold | 2025-11-06 |
| UBS | Maintain | Buy | 2025-11-06 |
| TD Cowen | Maintain | Buy | 2025-11-06 |
| Keybanc | Maintain | Overweight | 2025-11-06 |
Arm Holdings has a mostly favorable rating profile, including multiple “Buy,” “Outperform,” and “Overweight” grades, but also features a notable “Sell” downgrade from Goldman Sachs and a “Hold” rating from Needham.
Which company has the best grades?
Cadence Design Systems and Arm Holdings both receive strong support from analysts, but Cadence shows a slightly more consistent positive bias with fewer downgrades and more “Buy” and “Outperform” ratings. This could imply potentially steadier analyst confidence for Cadence compared to Arm’s mixed signals, which may affect investor sentiment and portfolio risk considerations.
Strengths and Weaknesses
Below is a comparative overview of key strengths and weaknesses for Cadence Design Systems, Inc. (CDNS) and Arm Holdings plc (ARM), based on the most recent data.
| Criterion | Cadence Design Systems, Inc. (CDNS) | Arm Holdings plc (ARM) |
|---|---|---|
| Diversification | Moderate diversification with strong product and maintenance revenue (4.21B USD in 2024) plus technology services | Revenue focused on licensing and royalties (3.99B USD total in 2025), less diversified product base |
| Profitability | High net margin (22.74%), ROIC 13.43%, creating value but with declining profitability | Lower net margin (19.77%), ROIC 10.28%, currently shedding value, stable profitability |
| Innovation | Strong innovation evidenced by consistent revenue growth in technology services and product upgrades | Innovation reflected in licensing growth but challenged by high WACC and high valuation multiples |
| Global presence | Well-established global presence with diversified customer base in electronic design automation | Strong global licensing footprint, key player in semiconductor IP market |
| Market Share | Leading position in electronic design automation with steady revenue growth | Dominant in ARM architecture licensing, significant market influence but profitability under pressure |
In summary, Cadence exhibits solid profitability and a favorable financial profile, though its profitability trend is declining. Arm holds a commanding market position with strong innovation potential but faces challenges in value creation and financial efficiency. Both companies warrant cautious consideration with attention to sustainability of returns and valuation risks.
Risk Analysis
Below is a comparative risk table for Cadence Design Systems, Inc. (CDNS) and Arm Holdings plc (ARM) based on the latest 2024 and 2025 data:
| Metric | Cadence Design Systems, Inc. (CDNS) | Arm Holdings plc (ARM) |
|---|---|---|
| Market Risk | Beta 1.05 (moderate volatility) | Beta 4.25 (high volatility) |
| Debt level | Debt-to-Equity 0.55 (neutral) | Debt-to-Equity 0.05 (low) |
| Regulatory Risk | Moderate; US-based with global reach | Higher; UK-based, exposure to US, China, Taiwan markets |
| Operational Risk | Moderate; software and hardware focus | Moderate; semiconductor IP licensing model |
| Environmental Risk | Low; primarily software industry | Low; semiconductor industry |
| Geopolitical Risk | Moderate; global supply chain exposure | High; exposure to geopolitical tensions in Asia-Pacific |
The most impactful and likely risks are Arm’s high market volatility (beta 4.25) and significant geopolitical exposure given its operations in sensitive regions. Cadence has more moderate risk profiles but faces valuation risks indicated by high P/E and P/B ratios. Both companies are financially stable with strong Altman Z-Scores, but Arm’s regulatory and geopolitical environment requires careful monitoring.
Which Stock to Choose?
Cadence Design Systems, Inc. (CDNS) shows a favorable income evolution with 13.48% revenue growth in 2024 and strong profitability metrics including a 22.74% net margin and 22.58% ROE. Its debt remains moderate with a 28.8% debt-to-assets ratio, supported by a very favorable rating and solid liquidity ratios.
Arm Holdings plc (ARM) reports robust income growth of 23.94% in 2025 and a high gross margin of 94.86%, but profitability ratios like ROE at 11.58% and ROIC below WACC indicate value destruction. Its low debt levels and favorable interest coverage contrast with a slightly unfavorable global financial ratios evaluation and a very favorable overall rating.
Investors seeking growth opportunities might find ARM’s strong income growth and high gross margin appealing, despite its value concerns, while those prioritizing financial stability and profitability could see CDNS’s favorable ratings and value-creating moat as more aligned with risk-averse or quality-focused profiles.
Disclaimer: Investment carries a risk of loss of initial capital. The past performance is not a reliable indicator of future results. Be sure to understand risks before making an investment decision.
Go Further
I encourage you to read the complete analyses of Cadence Design Systems, Inc. and Arm Holdings plc American Depositary Shares to enhance your investment decisions: