Home > Comparison > Technology > WIT vs AI
The strategic rivalry between Wipro Limited and C3.ai defines the current trajectory of the information technology services sector. Wipro operates as a capital-intensive, diversified IT services powerhouse with a global footprint and broad industry exposure. In contrast, C3.ai focuses on high-margin, enterprise AI software solutions, targeting niche digital transformation demands. This analysis pits scale and stability against innovation and growth, aiming to identify which model offers superior risk-adjusted returns for a diversified portfolio.
Table of contents
Companies Overview
Wipro Limited and C3.ai, Inc. both play pivotal roles in the evolving Information Technology Services market.
Wipro Limited: Global IT Services Powerhouse
Wipro Limited stands as a leading global IT and consulting company. Its core revenue comes from diversified IT services, including digital strategy advisory, cloud, and custom application development. In 2026, Wipro emphasizes expanding cloud infrastructure and analytics capabilities, serving diverse sectors like healthcare, banking, and manufacturing with a robust 234K workforce.
C3.ai, Inc.: Enterprise AI Innovator
C3.ai, Inc. operates as a specialized enterprise artificial intelligence software provider. It generates revenue through its AI application platform and industry-specific AI solutions such as inventory optimization and predictive maintenance. In 2026, C3.ai focuses on deepening strategic partnerships with tech giants and expanding AI-driven solutions across sectors like oil and gas, financial services, and telecommunications.
Strategic Collision: Similarities & Divergences
Wipro pursues a broad IT services model, while C3.ai specializes in AI software ecosystems. Both compete primarily in digital transformation, but Wipro’s strength lies in scale and service diversity, whereas C3.ai bets on cutting-edge AI applications. Their distinct investment profiles reflect this: Wipro offers stability and scale, while C3.ai targets high-growth innovation with elevated volatility.
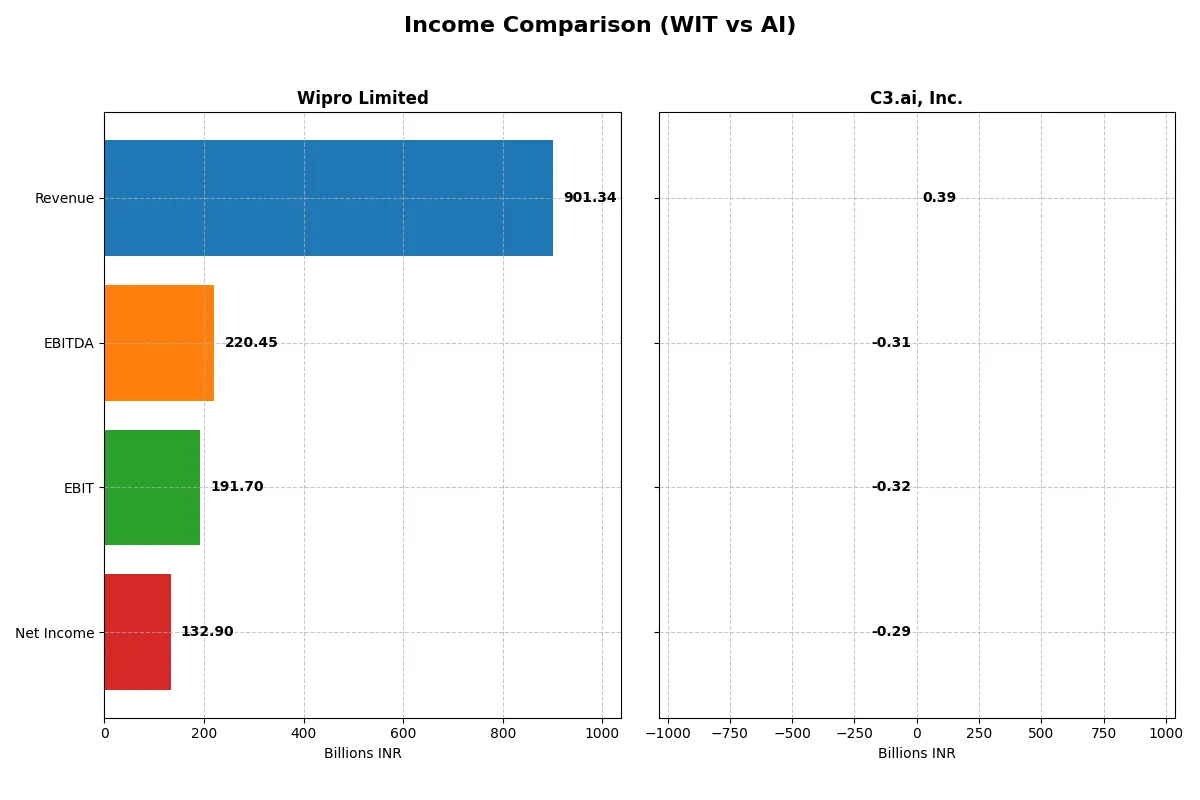
Income Statement Comparison
This data dissects the core profitability and scalability of both corporate engines to reveal who dominates the bottom line:
| Metric | Wipro Limited (WIT) | C3.ai, Inc. (AI) |
|---|---|---|
| Revenue | 901.3B INR | 389M USD |
| Cost of Revenue | 625.1B INR | 153.2M USD |
| Operating Expenses | 122.7B INR | 560.3M USD |
| Gross Profit | 276.3B INR | 235.9M USD |
| EBITDA | 220.5B INR | -311.8M USD |
| EBIT | 191.7B INR | -324.4M USD |
| Interest Expense | 14.9B INR | 0 |
| Net Income | 132.9B INR | -288.7M USD |
| EPS | 12.56 INR | -2.24 USD |
| Fiscal Year | 2025 | 2025 |
Income Statement Analysis: The Bottom-Line Duel
This income statement comparison uncovers which company converts sales into profits most efficiently and sustainably.
Wipro Limited Analysis
Wipro’s revenue shows a slight dip to 901B INR in 2025 from 903.5B INR in 2024, but net income rises sharply to 133B INR. The company sustains a healthy 30.65% gross margin and improves net margin to 14.74%, signaling strong cost control and profit retention. Its 19% EBIT growth underlines solid operational momentum.
C3.ai, Inc. Analysis
C3.ai posted a 25% revenue jump to $389M in 2025, reflecting rapid top-line expansion. However, it remains unprofitable with a net loss of $289M and a deeply negative net margin of -74%. Despite a stellar 60.62% gross margin, heavy operating expenses erode earnings, causing an EBIT margin of -83%.
Margin Power vs. Revenue Scale
Wipro demonstrates steady profitability with robust margins and improving earnings despite marginal revenue decline. C3.ai shows impressive revenue growth but struggles to control costs, resulting in sustained losses. For investors prioritizing consistent earnings and margin resilience, Wipro’s profile offers clearer fundamental strength over C3.ai’s high-growth yet loss-heavy model.
Financial Ratios Comparison
These vital ratios act as a diagnostic tool to expose the underlying fiscal health, valuation premiums, and capital efficiency of the companies compared:
| Ratios | Wipro Limited (WIT) | C3.ai, Inc. (AI) |
|---|---|---|
| ROE | 16.0% | -34.4% |
| ROIC | 10.5% | -36.1% |
| P/E | 20.6 | -9.8 |
| P/B | 3.30 | 3.39 |
| Current Ratio | 2.72 | 6.86 |
| Quick Ratio | 2.71 | 6.86 |
| D/E (Debt-to-Equity) | 0.23 | 0.006 |
| Debt-to-Assets | 14.9% | 0.5% |
| Interest Coverage | 10.3 | 0 |
| Asset Turnover | 0.70 | 0.38 |
| Fixed Asset Turnover | 8.48 | 4.91 |
| Payout ratio | 47.2% | 0% |
| Dividend yield | 2.29% | 0% |
| Fiscal Year | 2025 | 2025 |
Efficiency & Valuation Duel: The Vital Signs
Financial ratios serve as a company’s DNA, uncovering operational strengths and hidden risks that shape investment decisions.
Wipro Limited
Wipro posts a solid 16% ROE and a healthy 14.7% net margin, signaling strong profitability. Its P/E ratio at 20.6 suggests a fairly valued stock, though a 3.3 PB ratio flags some valuation stretch. The 2.29% dividend yield underscores steady shareholder returns, supported by robust capital allocation and operational efficiency.
C3.ai, Inc.
C3.ai struggles with negative profitability metrics: ROE at -34.4% and a steep -74.2% net margin. Despite an attractive negative P/E, elevated P/B and poor asset turnover highlight operational inefficiency. The absence of dividends reflects reinvestment into aggressive R&D, but risks remain elevated given weak cash flows and interest coverage.
Operational Strength vs. Growth Risk
Wipro offers a balanced profile with sustainable profitability and shareholder returns amid reasonable valuation. C3.ai presents high growth potential but weighs heavily on risk with negative returns and cash flow challenges. Risk-averse investors may favor Wipro’s consistency; growth seekers might tolerate C3.ai’s volatility.
Which one offers the Superior Shareholder Reward?
I compare Wipro Limited (WIT) and C3.ai, Inc. (AI) focusing on their shareholder distributions and sustainability. WIT yields 2.29% with a moderate payout ratio near 47%, supported by strong free cash flow of 14.8/share and consistent buybacks, signaling disciplined capital return. AI pays no dividends, instead reinvesting heavily in R&D and growth, reflected in persistent losses and negative margins. Its current ratio above 6 shows liquidity but no profit delivery. WIT’s dividend and buyback balance delivers stable, sustainable returns. AI’s high growth bet carries execution risk without immediate shareholder rewards. For 2026, I favor Wipro for superior total shareholder return and distribution sustainability.
Comparative Score Analysis: The Strategic Profile
The radar chart reveals the fundamental DNA and trade-offs of Wipro Limited and C3.ai, Inc., highlighting their distinct competitive strengths and weaknesses:
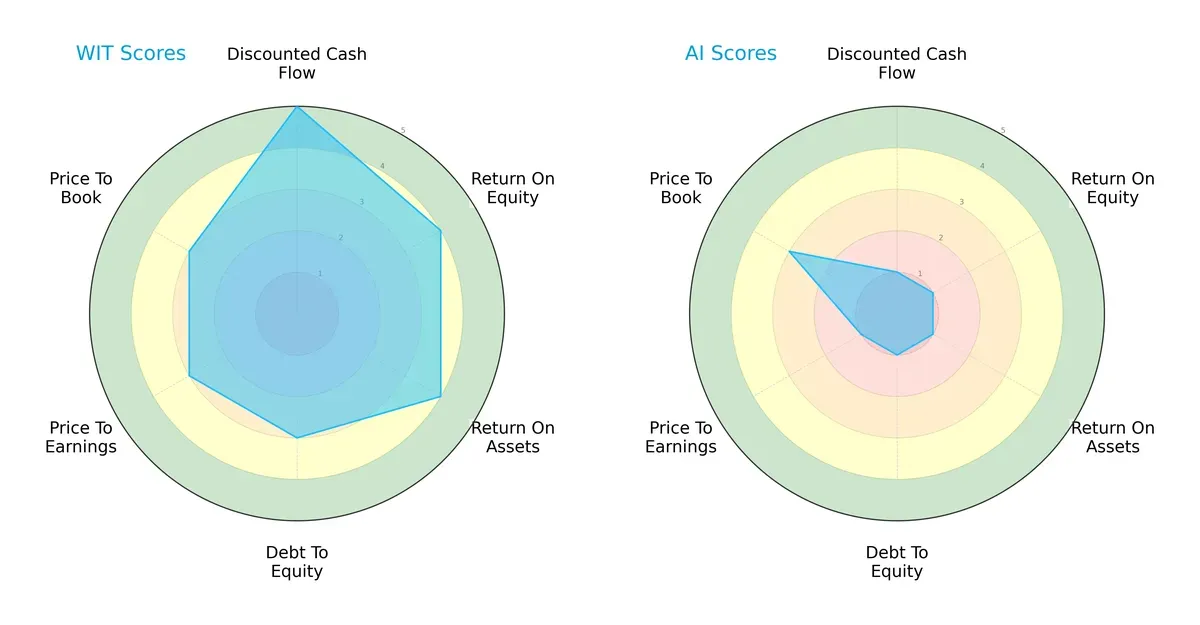
Wipro Limited shows a balanced profile with strong DCF (5), ROE (4), and ROA (4) scores, indicating efficient capital allocation and asset use. Its moderate debt-to-equity (3) and valuation metrics (P/E and P/B at 3) suggest prudent financial management. In contrast, C3.ai scores very low (1) across DCF, ROE, ROA, debt-to-equity, and P/E, relying solely on a moderate P/B score (3). Wipro clearly commands a more robust and diversified financial foundation, while C3.ai appears to depend on a single valuation metric.
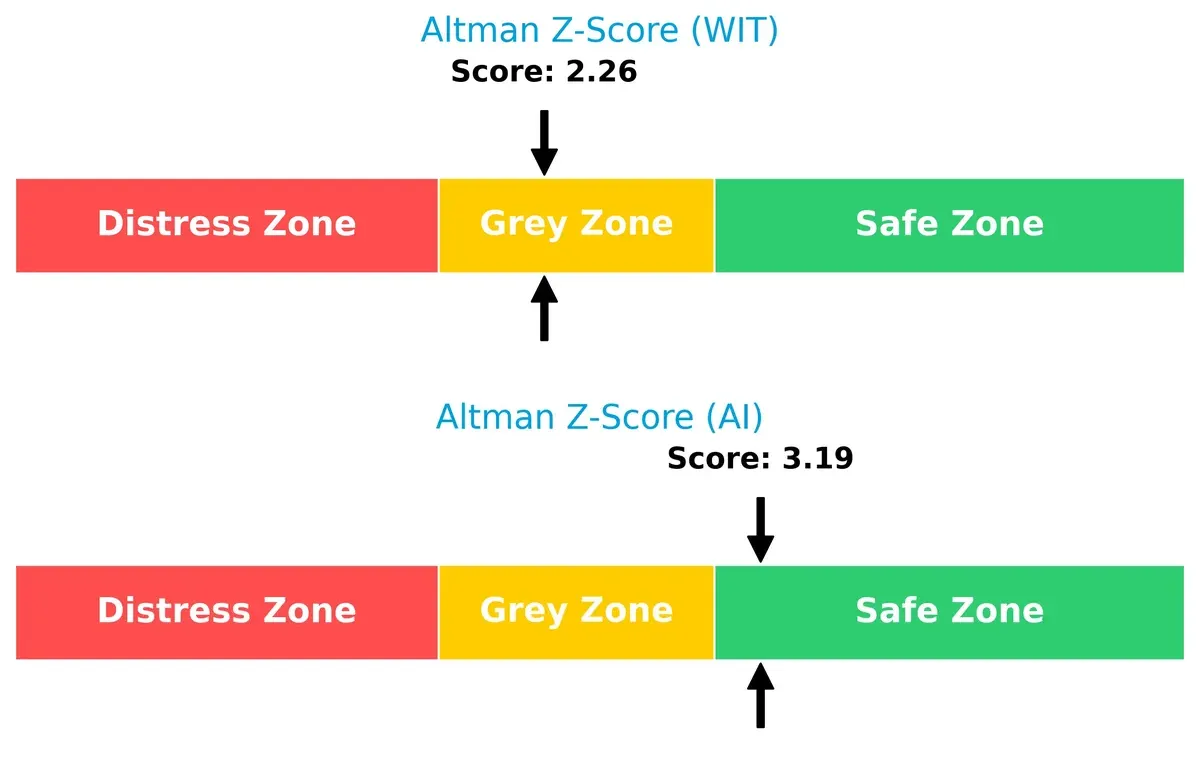
Bankruptcy Risk: Solvency Showdown
Wipro’s Altman Z-Score of 2.26 places it in the grey zone, signaling moderate bankruptcy risk amid this cycle. C3.ai’s stronger score of 3.19 situates it safely above distress thresholds, implying better solvency:
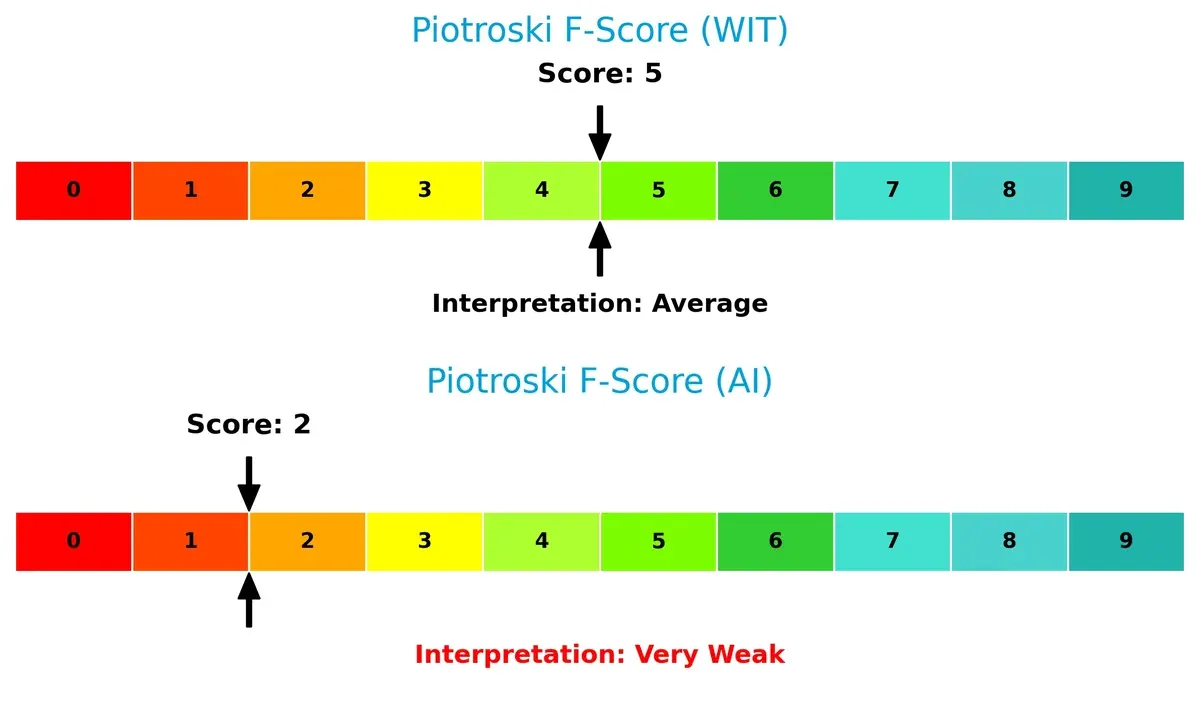
Financial Health: Quality of Operations
Wipro’s Piotroski F-Score of 5 reflects average financial health with no critical red flags. By contrast, C3.ai scores only 2, indicating weak internal financial metrics and operational concerns:
How are the two companies positioned?
This section dissects the operational DNA of WIT and AI by comparing their revenue distribution and internal dynamics, including strengths and weaknesses. The final objective is to confront their economic moats and identify which model offers the most resilient and sustainable competitive advantage today.
Revenue Segmentation: The Strategic Mix
The following visual comparison dissects how both firms diversify their income streams and where their primary sector bets lie:
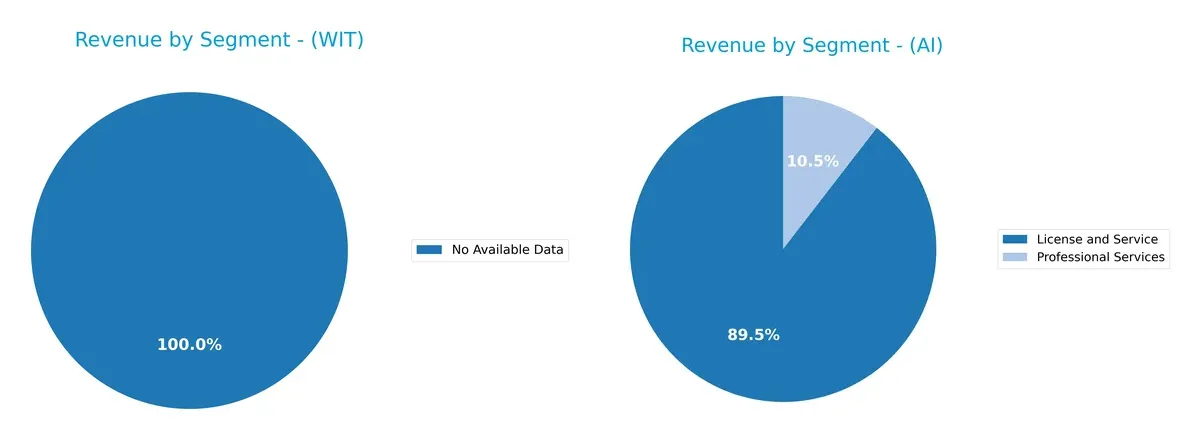
Wipro Limited lacks available segment data, preventing direct comparison. C3.ai anchors its revenue in License and Service, generating $278M in 2024, dwarfing its $32M Professional Services. This concentration signals a strategic bet on software licensing over consulting, exposing C3.ai to dependency risk but leveraging strong ecosystem lock-in. Without Wipro’s segmentation, C3.ai’s focused model stands out for investors prioritizing clear revenue drivers.
Strengths and Weaknesses Comparison
This table compares the Strengths and Weaknesses of Wipro Limited and C3.ai, Inc.:
Wipro Limited Strengths
- Strong profitability with 14.74% net margin and 16.04% ROE
- Favorable capital efficiency shown by 10.49% ROIC above 6.38% WACC
- Robust liquidity with current and quick ratios above 2.7
- Low leverage with debt-to-assets at 14.93% and high-interest coverage of 12.83
- Consistent dividend yield at 2.29%
- Efficient fixed asset turnover at 8.48
C3.ai, Inc. Strengths
- Low debt levels with 0.47% debt-to-assets and favorable quick ratio of 6.86
- Fixed asset turnover of 4.91 indicates asset usage efficiency
- Significant revenue growth in License and Service segment reaching $278M in 2024
- Geographic presence across North America, EMEA, Asia Pacific, and Rest of World
Wipro Limited Weaknesses
- Unfavorable price-to-book ratio at 3.3 suggests market valuation concerns
- Neutral asset turnover at 0.7 indicates moderate operational efficiency
- Moderate PE ratio at 20.6 limits valuation upside
C3.ai, Inc. Weaknesses
- Large negative profitability with -74.21% net margin and -34.44% ROE
- Negative ROIC at -36.1% well below 13.03% WACC signals value destruction
- Zero interest coverage poses risk to debt servicing
- Negative dividend yield and unfavorable current ratio despite strong quick ratio
- Declining asset turnover at 0.38 suggests low revenue generation from assets
Both companies show distinct profiles. Wipro exhibits solid profitability, liquidity, and capital structure strengths supporting steady operations and shareholder returns. C3.ai demonstrates asset efficiency and geographic diversification but suffers from severe losses and financial risks that could pressure its growth and sustainability. Each company’s metrics reflect differing strategic stages and risk profiles.
The Moat Duel: Analyzing Competitive Defensibility
A structural moat is the only reliable shield protecting long-term profits from relentless competition and market erosion. Let’s dissect the competitive moats of two IT service leaders:
Wipro Limited: Efficient Capital Deployment with Broad Industry Reach
Wipro’s moat stems from its cost advantage and diversified service portfolio. Its ROIC exceeds WACC by 4.1%, signaling value creation despite a declining ROIC trend. In 2026, expansion into cloud and analytics may deepen resilience.
C3.ai, Inc.: Innovation-Driven Growth with High Revenue Momentum
C3.ai leverages intangible assets and AI platform innovation, contrasting Wipro’s cost moat. However, its ROIC lags far below WACC, reflecting value destruction amid heavy reinvestment. Continued rapid revenue growth could unlock future scale economies.
Capital Efficiency vs. Innovation Potential: The Moat Showdown
Wipro’s wider moat lies in proven capital efficiency and steady profitability. C3.ai’s innovation moat is promising but currently unprofitable, with a steep ROIC decline. Wipro is better equipped to defend market share amid competitive pressures.
Which stock offers better returns?
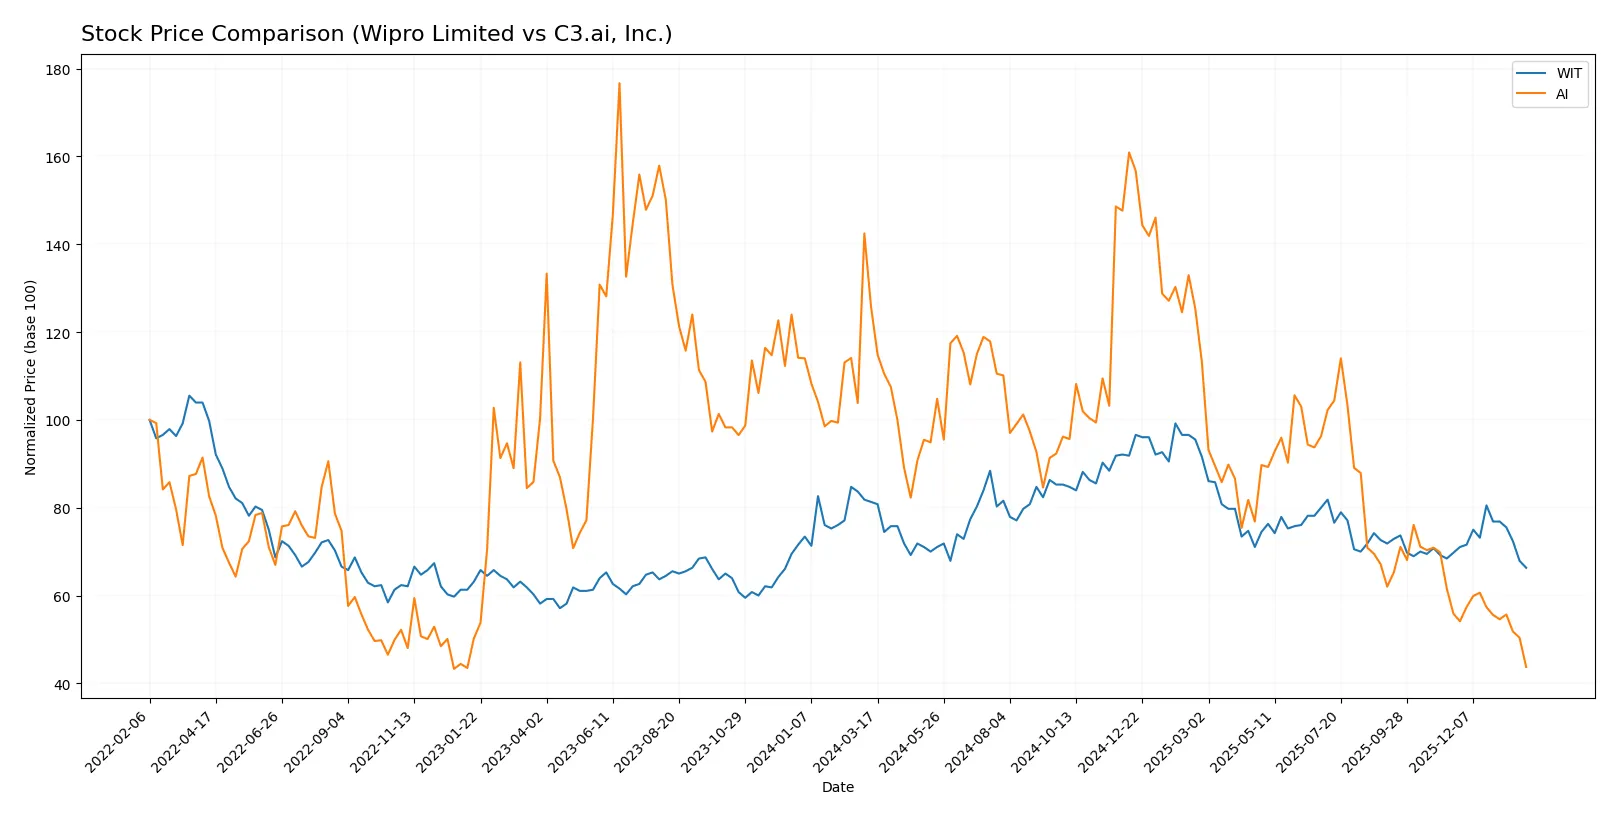
The past year reveals distinct declines for both stocks, with Wipro Limited showing a moderate downtrend and C3.ai, Inc. experiencing a steep fall, reflecting differing degrees of market pressure and trading activity.
Trend Comparison
Wipro Limited’s stock declined 18.45% over the past year, marking a bearish trend with deceleration. It traded between 3.77 and 2.52, showing moderate volatility (std dev 0.31).
C3.ai, Inc. fell 65.27% in the same period, a sharp bearish trend with deceleration. It ranged from 40.52 to 11.01, exhibiting high volatility (std dev 6.44).
Wipro Limited outperformed C3.ai, Inc. with a smaller price drop and less volatility, delivering a relatively stronger market performance.
Target Prices
Analysts present clear target price ranges for Wipro Limited and C3.ai, Inc., reflecting optimistic upside potential.
| Company | Target Low | Target High | Consensus |
|---|---|---|---|
| Wipro Limited | 7.00 | 7.70 | 7.35 |
| C3.ai, Inc. | 10.00 | 16.00 | 12.33 |
Wipro’s consensus target of 7.35 vastly exceeds the current 2.52 price, signaling strong growth expectations. C3.ai’s consensus target at 12.33 also suggests upside from its current 11.01 price, though with higher volatility risk.

Don’t Let Luck Decide Your Entry Point
Optimize your entry points with our advanced ProRealTime indicators. You’ll get efficient buy signals with precise price targets for maximum performance. Start outperforming now!
How do institutions grade them?
The following tables summarize recent institutional grades for Wipro Limited and C3.ai, Inc.:
Wipro Limited Grades
Here are the recent grades assigned to Wipro Limited by recognized grading companies:
| Grading Company | Action | New Grade | Date |
|---|---|---|---|
| UBS | Upgrade | Neutral | 2025-01-02 |
| Wedbush | Maintain | Underperform | 2024-01-16 |
| JP Morgan | Maintain | Underweight | 2023-05-24 |
| Bernstein | Downgrade | Underperform | 2023-03-22 |
| Bernstein | Downgrade | Underperform | 2023-03-21 |
| Goldman Sachs | Upgrade | Buy | 2022-09-13 |
| Goldman Sachs | Upgrade | Buy | 2022-09-12 |
| Morgan Stanley | Downgrade | Underweight | 2022-07-14 |
| Morgan Stanley | Downgrade | Underweight | 2022-07-13 |
| Macquarie | Upgrade | Outperform | 2022-06-02 |
C3.ai, Inc. Grades
Below are the latest institutional grades for C3.ai, Inc. from verified sources:
| Grading Company | Action | New Grade | Date |
|---|---|---|---|
| Wedbush | Maintain | Outperform | 2025-12-04 |
| DA Davidson | Maintain | Underperform | 2025-12-04 |
| Canaccord Genuity | Maintain | Hold | 2025-12-04 |
| Needham | Maintain | Hold | 2025-12-04 |
| UBS | Maintain | Neutral | 2025-09-12 |
| Morgan Stanley | Maintain | Underweight | 2025-09-09 |
| Canaccord Genuity | Maintain | Hold | 2025-09-05 |
| Keybanc | Maintain | Underweight | 2025-09-04 |
| UBS | Maintain | Neutral | 2025-09-04 |
| Needham | Maintain | Hold | 2025-09-04 |
Which company has the best grades?
Wipro Limited shows a mix of upgrades and downgrades, with recent grades clustering around Neutral and Underperform. C3.ai, Inc. holds mostly Hold and Neutral ratings, with a single Outperform and some Underperform assessments. The relatively balanced grades for both firms suggest cautious investor sentiment, with no clear dominance in institutional confidence.
Risks specific to each company
The following categories identify critical pressure points and systemic threats facing both firms in the 2026 market environment:
1. Market & Competition
Wipro Limited
- Established global IT services player with diverse industry exposure; faces intense competition from large incumbents and emerging tech firms.
C3.ai, Inc.
- Niche AI software firm with limited scale; sector highly competitive with rapid innovation and dominant tech giants exerting pressure.
2. Capital Structure & Debt
Wipro Limited
- Low debt-to-equity ratio (0.23) and strong interest coverage (12.83) indicate prudent leverage and manageable financial risk.
C3.ai, Inc.
- Minimal debt (0.01 D/E) but zero interest coverage signals inability to service any debt from earnings, raising solvency concerns.
3. Stock Volatility
Wipro Limited
- Beta of 0.555 reflects lower volatility than the market, providing defensive qualities in turbulent cycles.
C3.ai, Inc.
- High beta of 1.964 shows elevated stock price swings, increasing investment risk amid uncertain earnings.
4. Regulatory & Legal
Wipro Limited
- Exposure to Indian government contracts may face regulatory shifts but benefits from established compliance frameworks.
C3.ai, Inc.
- Operating internationally in AI software, C3.ai confronts evolving data privacy and AI regulation risks across jurisdictions.
5. Supply Chain & Operations
Wipro Limited
- Diverse IT service lines and in-house capabilities mitigate supply chain disruptions but rely on global talent availability.
C3.ai, Inc.
- Software-centric model reduces physical supply chain risk but depends heavily on cloud infrastructure partnerships and data quality.
6. ESG & Climate Transition
Wipro Limited
- Demonstrates commitment to ESG with energy-efficient operations; faces pressure to decarbonize its large workforce and facilities.
C3.ai, Inc.
- AI applications can aid climate solutions, but C3.ai must manage ESG risks related to data ethics and transparency.
7. Geopolitical Exposure
Wipro Limited
- Significant India base buffers some geopolitical risks but also subjects to regional tensions and policy changes.
C3.ai, Inc.
- US headquarters and global operations expose C3.ai to trade tensions, export controls, and geopolitical technology restrictions.
Which company shows a better risk-adjusted profile?
Wipro faces its largest risk in competitive market pressures but benefits from sound capital structure and low stock volatility. C3.ai’s key risk is negative profitability compounded by high stock volatility and weak financial ratios. Wipro’s very favorable financial scores and moderate Altman Z-Score contrast sharply with C3.ai’s unfavorable metrics and weak Piotroski score. The recent sharp 10% price drop in C3.ai highlights market concerns over its sustainability. Overall, Wipro offers a far superior risk-adjusted profile in 2026.
Final Verdict: Which stock to choose?
Wipro Limited’s superpower lies in its resilient value creation and solid capital efficiency, evidenced by a ROIC comfortably above its cost of capital. Its point of vigilance is a slightly declining profitability trend, signaling the need for close monitoring. Wipro suits portfolios aiming for steady, slightly conservative growth with good quality earnings.
C3.ai, Inc. boasts a strategic moat in its cutting-edge AI technology and rapid revenue growth, driven by heavy R&D investment. However, it carries significant financial risk and negative returns, reflecting its early-stage growth challenges. It fits investors who tolerate high volatility and seek speculative exposure to disruptive tech trends.
If you prioritize consistent value creation and financial stability, Wipro outshines with its proven profitability and prudent capital management. However, if you seek aggressive growth and can withstand earnings volatility, C3.ai offers superior top-line expansion and innovation potential, albeit with heightened risk. Each appeals to distinctly different investor profiles.
Disclaimer: Investment carries a risk of loss of initial capital. The past performance is not a reliable indicator of future results. Be sure to understand risks before making an investment decision.
Go Further
I encourage you to read the complete analyses of Wipro Limited and C3.ai, Inc. to enhance your investment decisions: