Leidos Holdings, Inc. and C3.ai, Inc. are two prominent players in the Information Technology Services sector, each driving innovation through unique approaches. Leidos focuses on defense, civil, and health markets with large-scale systems and cybersecurity solutions, while C3.ai specializes in enterprise AI software with a broad international footprint. This comparison explores their market strategies and growth potential to help you identify the most compelling investment opportunity. Let’s dive into which company stands out for your portfolio.
Table of contents
Companies Overview
I will begin the comparison between Leidos Holdings, Inc. and C3.ai, Inc. by providing an overview of these two companies and their main differences.
Leidos Holdings, Inc. Overview
Leidos Holdings, Inc. provides services and solutions primarily in defense, intelligence, civil, and health markets both in the US and internationally. The company operates through three segments: Defense Solutions, Civil, and Health, delivering technology, large-scale systems, data analytics, and cybersecurity solutions. Founded in 1969 and headquartered in Reston, Virginia, Leidos holds a strong position in national security and government IT services.
C3.ai, Inc. Overview
C3.ai, Inc. is an enterprise artificial intelligence software company offering a platform and applications for designing, developing, and deploying AI solutions. It serves various sectors including oil and gas, manufacturing, financial services, and healthcare. Headquartered in Redwood City, California, and founded in 2009, C3.ai emphasizes AI-driven optimization, predictive maintenance, and risk management with strategic partnerships in technology and industry.
Key similarities and differences
Both Leidos and C3.ai operate in the information technology services sector, focusing on advanced technology solutions for large-scale clients. Leidos emphasizes national security, civil infrastructure, and health services with a broad government and commercial customer base. In contrast, C3.ai concentrates on enterprise AI software platforms and industry-specific AI applications, targeting digital transformation across multiple commercial sectors. Leidos is a mature, larger company, while C3.ai is smaller with a high-growth focus.
Income Statement Comparison
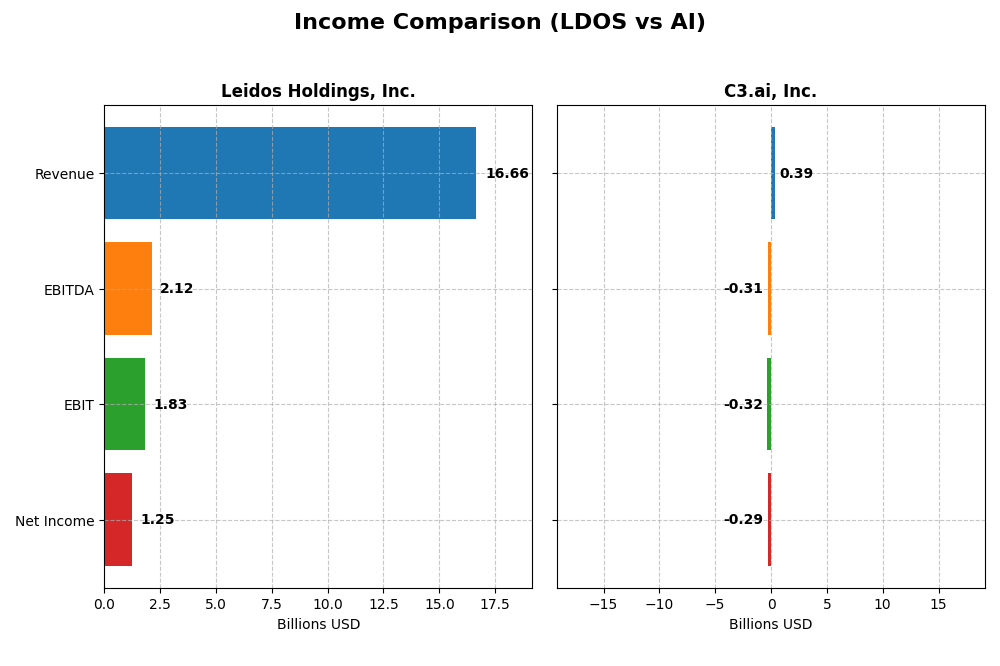
The table below presents a side-by-side comparison of key income statement metrics for Leidos Holdings, Inc. and C3.ai, Inc. for their most recent fiscal years, highlighting their financial performance.
| Metric | Leidos Holdings, Inc. (LDOS) | C3.ai, Inc. (AI) |
|---|---|---|
| Market Cap | 24.4B | 1.9B |
| Revenue | 16.7B | 389M |
| EBITDA | 2.12B | -312M |
| EBIT | 1.83B | -324M |
| Net Income | 1.25B | -289M |
| EPS | 9.36 | -2.24 |
| Fiscal Year | 2024 | 2025 |
Income Statement Interpretations
Leidos Holdings, Inc.
Leidos Holdings, Inc. experienced steady revenue growth from $12.3B in 2020 to $16.7B in 2024, accompanied by a near doubling of net income to $1.25B. Margins remained stable with a gross margin around 16.8% and a favorable net margin of 7.5%. The latest year showed strong earnings growth, with net income up sharply, reflecting improved efficiency and margin expansion.
C3.ai, Inc.
C3.ai, Inc. saw revenue rise from $183M in 2021 to $389M in 2025, reflecting rapid expansion. However, net losses deepened to -$289M in 2025 despite margin improvements, with a gross margin of 60.6% but a negative net margin near -74%. The latest year delivered revenue growth but worsening EBIT and persistent net losses, indicating ongoing operational challenges.
Which one has the stronger fundamentals?
Leidos demonstrates stronger fundamentals, highlighted by consistent revenue and net income growth, positive margins, and robust profitability improvements. In contrast, C3.ai shows impressive top-line growth but sustained losses and negative net margins. Leidos’ stable margins and earnings trajectory suggest a more favorable income statement profile over the period analyzed.
Financial Ratios Comparison
Below is a comparison of key financial ratios for Leidos Holdings, Inc. (LDOS) and C3.ai, Inc. (AI) based on their most recent fiscal year data, providing insight into profitability, liquidity, leverage, and valuation metrics.
| Ratios | Leidos Holdings, Inc. (LDOS) 2024 | C3.ai, Inc. (AI) 2025 |
|---|---|---|
| ROE | 28.42% | -34.44% |
| ROIC | 13.85% | -36.10% |
| P/E | 15.72 | -9.84 |
| P/B | 4.47 | 3.39 |
| Current Ratio | 1.21 | 6.86 |
| Quick Ratio | 1.13 | 6.86 |
| D/E (Debt-to-Equity) | 1.20 | 0.01 |
| Debt-to-Assets | 40.38% | 0.47% |
| Interest Coverage | 9.47 | 0 |
| Asset Turnover | 1.27 | 0.38 |
| Fixed Asset Turnover | 10.74 | 4.91 |
| Payout Ratio | 16.59% | 0 |
| Dividend Yield | 1.05% | 0 |
Interpretation of the Ratios
Leidos Holdings, Inc.
Leidos presents a slightly favorable ratio profile with strong returns on equity (28.42%) and invested capital (13.85%), supported by a favorable weighted average cost of capital at 5.87%. However, its price-to-book ratio (4.47) and debt-to-equity (1.2) are less appealing, signaling potential valuation and leverage concerns. The company pays a dividend yielding 1.05%, with a neutral payout outlook.
C3.ai, Inc.
C3.ai’s financial ratios reveal significant challenges, with negative profitability metrics such as a -74.21% net margin and -34.44% return on equity, indicating losses and inefficiency. Despite a low debt-to-equity ratio and favorable quick ratio, its overall ratio evaluation is unfavorable. The company does not pay dividends, likely due to its reinvestment strategy amid ongoing losses.
Which one has the best ratios?
Leidos Holdings exhibits a more balanced and slightly favorable financial ratio profile, reflecting profitability and moderate risk, whereas C3.ai faces substantial unfavorable ratios tied to losses and operational inefficiencies. Based solely on the ratios, Leidos appears to have stronger financial health compared to C3.ai.
Strategic Positioning
This section compares the strategic positioning of Leidos Holdings, Inc. and C3.ai, Inc., focusing on market position, key segments, and exposure to technological disruption:
Leidos Holdings, Inc.
- Leading defense and intelligence IT services provider, facing competition in federal and commercial sectors.
- Diversified segments: Defense Solutions, Civil, and Health markets drive revenue.
- Operates in established IT and defense sectors with less direct technological disruption risk.
C3.ai, Inc.
- Enterprise AI software company with strategic partnerships, competing in multiple international markets.
- Focused on AI platform and applications, serving industries like oil, gas, financial services, and healthcare.
- Exposed to rapid AI advancements and evolving software technology, requiring continuous innovation.
Leidos Holdings, Inc. vs C3.ai, Inc. Positioning
Leidos exhibits a diversified strategy across defense, civil, and health sectors, benefiting from broad market coverage but facing complex regulatory environments. C3.ai focuses on niche AI applications with growth potential yet higher technological volatility and dependency on partnerships.
Which has the best competitive advantage?
Leidos demonstrates a very favorable moat with growing ROIC and value creation, indicating durable competitive advantage. In contrast, C3.ai shows a very unfavorable moat with declining ROIC and value destruction, reflecting weaker competitive positioning.
Stock Comparison
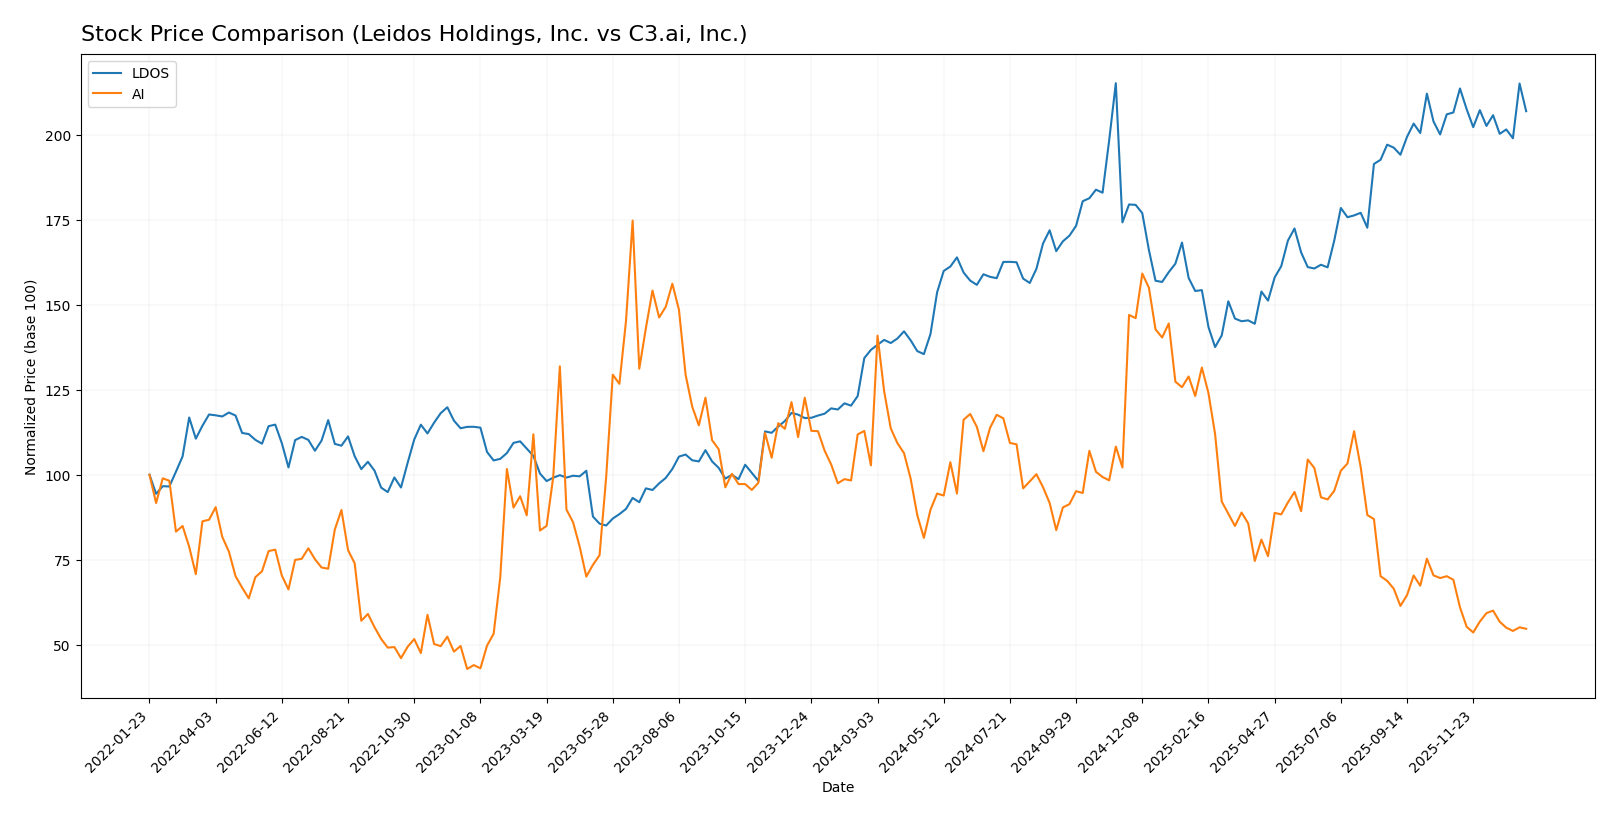
The stock price movements of Leidos Holdings, Inc. (LDOS) and C3.ai, Inc. (AI) over the past year reveal contrasting trends, with LDOS showing strong gains and AI experiencing significant declines amid varying trading volumes and market dynamics.
Trend Analysis
Leidos Holdings, Inc. (LDOS) exhibited a bullish trend over the past 12 months with a 51.37% price increase, accompanied by decelerating momentum and a high volatility level reflected by a 20.61 std deviation.
C3.ai, Inc. (AI) showed a bearish trend with a 46.81% price decrease over the same period, also with decelerating trend momentum and lower volatility at a 6.29 std deviation.
Comparing both, LDOS delivered the highest market performance with a strong positive return, while AI’s stock declined substantially, reflecting divergent investor sentiment and trading activity.
Target Prices
The current analyst consensus presents a moderately bullish outlook for both Leidos Holdings, Inc. and C3.ai, Inc.
| Company | Target High | Target Low | Consensus |
|---|---|---|---|
| Leidos Holdings, Inc. | 230 | 216 | 222.2 |
| C3.ai, Inc. | 16 | 11 | 13.5 |
Leidos Holdings shows a consensus target about 16.5% above its current price of 190.82 USD, suggesting upside potential. C3.ai’s consensus target is slightly below the current price of 13.91 USD, indicating a more cautious view among analysts.
Analyst Opinions Comparison
This section compares analysts’ ratings and grades for Leidos Holdings, Inc. (LDOS) and C3.ai, Inc. (AI):
Rating Comparison
LDOS Rating
- Rating: A-, indicating a very favorable rating.
- Discounted Cash Flow Score: 5, very favorable.
- ROE Score: 5, very favorable efficiency in profit generation.
- ROA Score: 4, favorable asset utilization.
- Debt To Equity Score: 1, very unfavorable balance sheet strength.
- Overall Score: 4, favorable financial standing.
AI Rating
- Rating: D+, indicating a very unfavorable rating.
- Discounted Cash Flow Score: 1, very unfavorable.
- ROE Score: 1, very unfavorable efficiency.
- ROA Score: 1, very unfavorable asset utilization.
- Debt To Equity Score: 1, very unfavorable balance sheet strength.
- Overall Score: 1, very unfavorable financial standing.
Which one is the best rated?
Based strictly on the data, LDOS is clearly better rated with a strong A- rating and high scores in discounted cash flow, ROE, and ROA. AI shows very unfavorable scores across all metrics and a low D+ rating.
Scores Comparison
Here is a comparison of the Altman Z-Score and Piotroski Score for Leidos Holdings, Inc. and C3.ai, Inc.:
Leidos Holdings, Inc. Scores
- Altman Z-Score: 4.15, indicating a safe zone, low bankruptcy risk
- Piotroski Score: 8, very strong financial health
C3.ai, Inc. Scores
- Altman Z-Score: 3.59, indicating a safe zone, low bankruptcy risk
- Piotroski Score: 2, very weak financial health
Which company has the best scores?
Based on the provided data, Leidos Holdings shows stronger financial health with a very strong Piotroski Score of 8 versus C3.ai’s weak score of 2, while both companies remain in the safe zone for Altman Z-Score.
Grades Comparison
Here is a detailed comparison of the grading data available for Leidos Holdings, Inc. and C3.ai, Inc.:
Leidos Holdings, Inc. Grades
The following table summarizes recent grades assigned by reputable financial institutions to Leidos Holdings, Inc.:
| Grading Company | Action | New Grade | Date |
|---|---|---|---|
| Citigroup | Maintain | Buy | 2026-01-13 |
| Stifel | Downgrade | Hold | 2026-01-08 |
| B of A Securities | Maintain | Buy | 2025-11-07 |
| Truist Securities | Maintain | Buy | 2025-11-05 |
| UBS | Maintain | Neutral | 2025-11-05 |
| Cantor Fitzgerald | Maintain | Overweight | 2025-10-31 |
| Argus Research | Maintain | Buy | 2025-09-24 |
| B of A Securities | Maintain | Buy | 2025-09-04 |
| RBC Capital | Upgrade | Outperform | 2025-09-04 |
| UBS | Maintain | Neutral | 2025-08-07 |
Leidos generally maintains a positive outlook with multiple “Buy” and “Outperform” grades, though some caution is reflected in “Hold” and “Neutral” ratings.
C3.ai, Inc. Grades
Below is the recent grading data for C3.ai, Inc. from verified financial analysts:
| Grading Company | Action | New Grade | Date |
|---|---|---|---|
| Canaccord Genuity | Maintain | Hold | 2025-12-04 |
| Wedbush | Maintain | Outperform | 2025-12-04 |
| Needham | Maintain | Hold | 2025-12-04 |
| DA Davidson | Maintain | Underperform | 2025-12-04 |
| UBS | Maintain | Neutral | 2025-09-12 |
| Morgan Stanley | Maintain | Underweight | 2025-09-09 |
| Canaccord Genuity | Maintain | Hold | 2025-09-05 |
| Needham | Maintain | Hold | 2025-09-04 |
| Keybanc | Maintain | Underweight | 2025-09-04 |
| JMP Securities | Maintain | Market Outperform | 2025-09-04 |
C3.ai’s grades show a mixed to cautious stance, with several “Hold” and “Underperform”/”Underweight” ratings, alongside a few positive “Outperform” designations.
Which company has the best grades?
Leidos Holdings, Inc. has received generally more favorable grades, with a consensus of “Buy” and multiple buy-side ratings, compared to C3.ai, Inc.’s more mixed consensus of “Hold” and several sell-side ratings. This difference may influence investors seeking relatively stronger analyst confidence towards Leidos.
Strengths and Weaknesses
Below is a comparison of key strengths and weaknesses for Leidos Holdings, Inc. (LDOS) and C3.ai, Inc. (AI) based on their recent financial and operational data.
| Criterion | Leidos Holdings, Inc. (LDOS) | C3.ai, Inc. (AI) |
|---|---|---|
| Diversification | Highly diversified across National Security, Defense, Civil, and Health segments with multi-billion revenues in each | Limited diversification; mainly License and Service with smaller Professional Services segment |
| Profitability | Consistently profitable with ROIC 13.85%, ROE 28.42%, net margin 7.53% (slightly favorable) | Negative profitability; ROIC -36.1%, ROE -34.44%, net margin -74.21% (unfavorable) |
| Innovation | Steady growth in ROIC indicating effective capital use and innovation in defense and security solutions | Declining ROIC and value destruction suggest struggles in innovation and scaling profitability |
| Global presence | Strong global footprint serving government and commercial clients worldwide | Smaller scale with limited global reach compared to LDOS |
| Market Share | Significant market share in defense and security sectors with $9.55B in National Security Solutions revenue | Smaller market presence with total revenues under $0.3B, focusing on AI software licenses |
Leidos Holdings demonstrates a robust and diversified business model with consistent profitability and a growing competitive advantage. C3.ai, while innovative in AI, faces significant challenges with declining profitability and limited diversification, signaling higher investment risk.
Risk Analysis
Below is a comparative table highlighting key risks for Leidos Holdings, Inc. (LDOS) and C3.ai, Inc. (AI) as of the most recent fiscal years:
| Metric | Leidos Holdings, Inc. (LDOS) | C3.ai, Inc. (AI) |
|---|---|---|
| Market Risk | Moderate (Beta 0.59) | High (Beta 1.96) |
| Debt level | Elevated (D/E 1.2, Neutral) | Minimal (D/E 0.01, Favorable) |
| Regulatory Risk | Moderate (Defense & Civil sectors) | Moderate (Tech & AI regulations) |
| Operational Risk | Moderate (Complex defense projects) | High (Early-stage growth, scaling risks) |
| Environmental Risk | Moderate (Infrastructure services impact) | Low (Software-focused) |
| Geopolitical Risk | High (Global defense contracts) | Moderate (Global client base) |
Leidos faces notable geopolitical and debt-related risks due to its defense contracts and leverage, but benefits from stable cash flows and strong financial health. C3.ai carries higher market and operational risks, with heavy losses and weak profitability posing significant challenges despite low debt. Investors should weigh Leidos’s stable but leveraged profile against C3.ai’s growth potential amid financial instability.
Which Stock to Choose?
Leidos Holdings, Inc. (LDOS) shows a favorable income evolution with a 7.93% revenue growth last year and strong profitability metrics, including a 28.42% ROE and 13.85% ROIC. The company maintains moderate debt levels (net debt to EBITDA 2.05) and enjoys a very favorable A- rating, reflecting solid financial health and value creation.
C3.ai, Inc. (AI) displays a mixed income profile with strong revenue growth of 25.27% last year but significant losses, reflected in a -74.21% net margin and negative ROE (-34.44%) and ROIC (-36.1%). AI carries very low debt and a D+ rating, indicating financial challenges and an unfavorable global ratio evaluation.
Considering the ratings and comprehensive financial analysis, LDOS might appear more suitable for investors seeking stability and consistent value creation, while AI could be interpreted as a higher-risk option potentially appealing to those with a tolerance for volatility and a focus on growth opportunities.
Disclaimer: Investment carries a risk of loss of initial capital. The past performance is not a reliable indicator of future results. Be sure to understand risks before making an investment decision.
Go Further
I encourage you to read the complete analyses of Leidos Holdings, Inc. and C3.ai, Inc. to enhance your investment decisions: