Home > Comparison > Technology > JKHY vs AI
The strategic rivalry between Jack Henry & Associates, Inc. and C3.ai, Inc. shapes the evolution of the technology sector. Jack Henry operates as a capital-intensive provider of financial technology solutions, targeting banks and credit unions. In contrast, C3.ai pursues a high-margin, enterprise AI software model with broad industry applications. This analysis evaluates which company’s business model delivers superior risk-adjusted returns for a diversified portfolio amid ongoing technological disruption.
Table of contents
Companies Overview
Jack Henry & Associates and C3.ai dominate distinct niches within the technology sector, shaping financial services and AI software markets.
Jack Henry & Associates, Inc.: Core Banking Technology Specialist
Jack Henry & Associates stands as a leading provider of technology solutions and payment processing for U.S. financial institutions. It generates revenue through core banking systems, payments processing, and complementary services, targeting community banks and credit unions under brands like Jack Henry Banking and Symitar. In 2026, its strategic focus remains on enhancing integrated digital banking platforms and expanding payment solutions.
C3.ai, Inc.: Enterprise AI Software Pioneer
C3.ai defines itself as an enterprise AI software vendor delivering platforms and specialized applications across industries globally. It earns revenue by licensing its AI application platform and tailored solutions such as inventory optimization and predictive maintenance. For 2026, the company prioritizes deepening strategic partnerships and broadening AI adoption in sectors like oil & gas and financial services.
Strategic Collision: Similarities & Divergences
Both firms operate in technology services but diverge sharply: Jack Henry emphasizes a closed ecosystem focused on financial institutions’ core operations, while C3.ai champions an open, AI-driven platform spanning multiple industries. Their primary battleground is the digitization of enterprise processes, with Jack Henry excelling in banking technology and C3.ai disrupting AI application deployment. Investors face distinct profiles—stable, dividend-paying infrastructure versus high-beta, growth-oriented AI innovation.
Income Statement Comparison
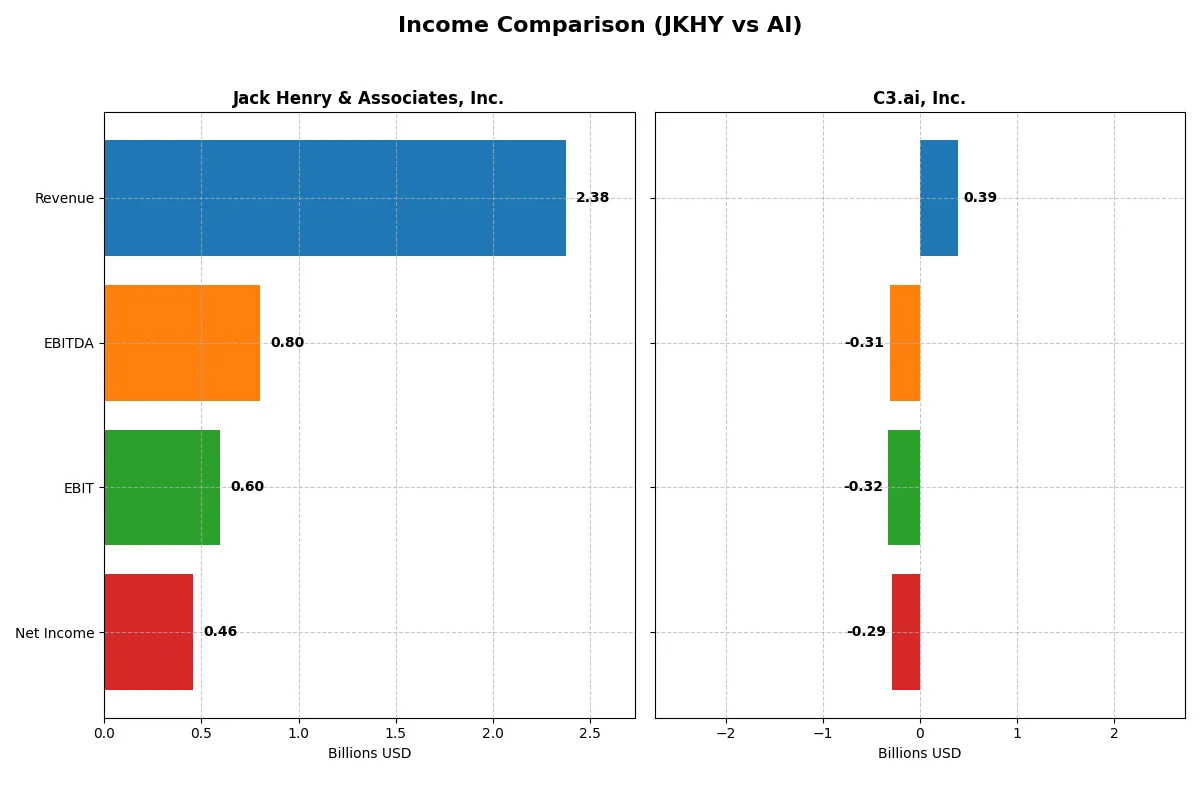
This data dissects the core profitability and scalability of both corporate engines to reveal who dominates the bottom line:
| Metric | Jack Henry & Associates, Inc. (JKHY) | C3.ai, Inc. (AI) |
|---|---|---|
| Revenue | 2.38B | 389M |
| Cost of Revenue | 1.36B | 153M |
| Operating Expenses | 446M | 560M |
| Gross Profit | 1.01B | 236M |
| EBITDA | 801M | -312M |
| EBIT | 596M | -324M |
| Interest Expense | 10M | 0 |
| Net Income | 456M | -289M |
| EPS | 6.24 | -2.24 |
| Fiscal Year | 2025 | 2025 |
Income Statement Analysis: The Bottom-Line Duel
This income statement comparison reveals which company drives stronger profitability and margin efficiency through its core business operations.
Jack Henry & Associates, Inc. Analysis
Jack Henry & Associates shows consistent revenue growth, reaching $2.38B in 2025 with net income climbing to $456M. Its gross margin of 42.7% and net margin near 19.2% demonstrate solid profitability. The company improved EBIT by 16% year-over-year, reflecting operational momentum and disciplined expense management.
C3.ai, Inc. Analysis
C3.ai’s revenue surged 25% to $389M in 2025, with a robust gross margin of 60.6%. However, it remains unprofitable, posting a net loss of $289M and a negative EBIT margin of -83.4%. Despite top-line momentum, heavy R&D and operating expenses weigh on profitability, indicating ongoing investment in growth over near-term earnings.
Margin Strength vs. Growth Ambition
Jack Henry delivers steady profit expansion and healthy margins, clearly outperforming C3.ai’s loss-making profile. While C3.ai’s revenue growth impresses, its persistent net losses and negative EBIT margins highlight fundamental profitability challenges. Investors seeking reliable earnings and margin stability find Jack Henry’s profile more attractive than C3.ai’s aggressive growth stance.
Financial Ratios Comparison
These vital ratios act as a diagnostic tool to expose the underlying fiscal health, valuation premiums, and capital efficiency of the companies compared below:
| Ratios | Jack Henry & Associates, Inc. (JKHY) | C3.ai, Inc. (AI) |
|---|---|---|
| ROE | 21.39% | -34.44% |
| ROIC | 17.63% | -36.10% |
| P/E | 28.88 | -9.84 |
| P/B | 6.18 | 3.39 |
| Current Ratio | 1.27 | 6.86 |
| Quick Ratio | 1.27 | 6.86 |
| D/E (Debt to Equity) | 0 | 0.57% |
| Debt-to-Assets | 0 | 0.47% |
| Interest Coverage | 54.49 | 0 |
| Asset Turnover | 0.78 | 0.38 |
| Fixed Asset Turnover | 10.75 | 4.91 |
| Payout ratio | 36.13% | 0 |
| Dividend yield | 1.25% | 0 |
| Fiscal Year | 2025 | 2025 |
Efficiency & Valuation Duel: The Vital Signs
Ratios act as a company’s DNA, revealing both hidden risks and operational excellence behind the financial statements.
Jack Henry & Associates, Inc.
Jack Henry excels with a 21.4% ROE and a strong 19.2% net margin, signaling robust profitability. However, its P/E ratio near 29 suggests the stock is somewhat expensive. The company balances this with a 1.25% dividend yield, rewarding shareholders while maintaining solid reinvestments in R&D at around 6.9% of revenue.
C3.ai, Inc.
C3.ai struggles with a negative 34.4% ROE and a steep -74.2% net margin, reflecting deep losses. Its negative P/E ratio is misleading but points to valuation uncertainty. The firm carries no dividends, instead channeling heavy investment into R&D — over 58% of revenue — emphasizing growth over current returns despite operational inefficiencies.
Premium Valuation vs. Operational Safety
Jack Henry offers a more balanced risk-reward profile, combining strong profitability with moderate dividend income. C3.ai, while ambitious, presents significant operational losses and higher risk. Investors seeking stability may favor Jack Henry, while those targeting high-growth potential might consider C3.ai’s aggressive reinvestment strategy.
Which one offers the Superior Shareholder Reward?
Jack Henry & Associates, Inc. (JKHY) delivers a balanced shareholder reward with a 1.25% dividend yield and a sustainable 36% payout ratio, backed by strong free cash flow of 8B. Its consistent dividend growth and moderate buyback program support long-term value. In contrast, C3.ai, Inc. (AI) pays no dividend and burns cash with negative free cash flow, focusing entirely on growth and R&D. AI’s aggressive share buybacks are absent, reflecting a reinvestment strategy rather than direct shareholder returns. I find JKHY’s dividend-plus-buyback model more attractive for 2026 investors seeking steady total returns combined with capital preservation.
Comparative Score Analysis: The Strategic Profile
The radar chart reveals the core financial DNA and strategic trade-offs between Jack Henry & Associates and C3.ai, Inc.:
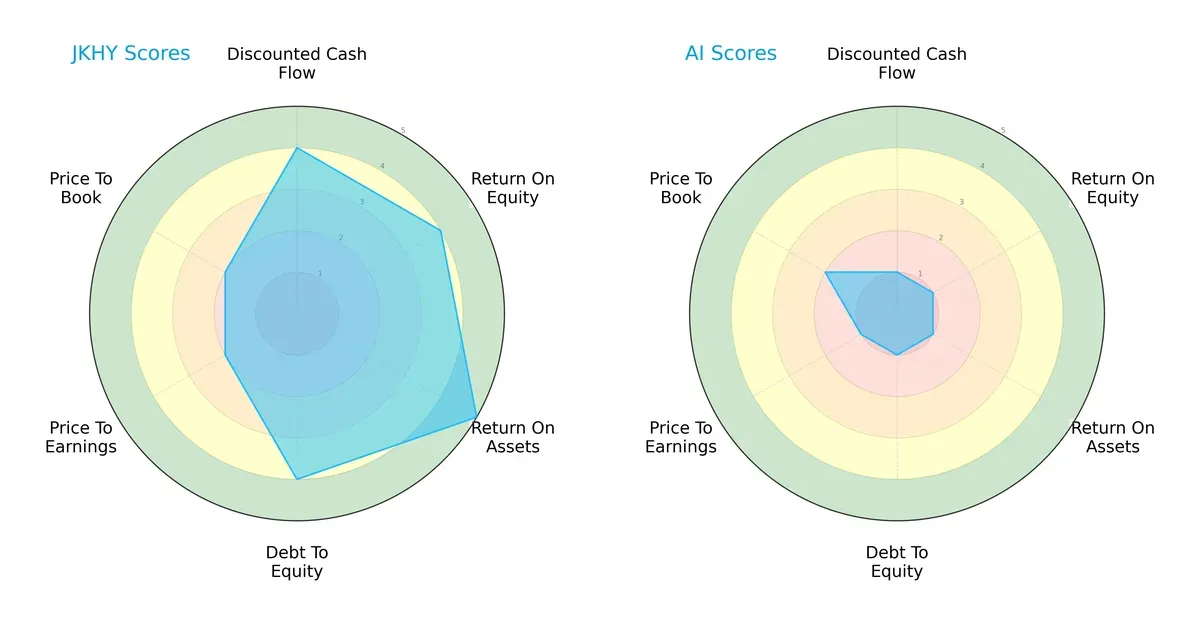
Jack Henry & Associates displays a balanced profile with strong DCF (4), ROE (4), ROA (5), and solid debt management (4). Its valuation metrics (PE/PB scores of 2) show moderate market pricing. Conversely, C3.ai suffers across all metrics, scoring 1 in DCF, ROE, ROA, debt-to-equity, and PE, except a moderate P/B of 2. Jack Henry’s diversified strengths highlight operational efficiency and prudent capital structure. C3.ai relies on a single moderate valuation metric but faces severe weaknesses in profitability and leverage, signaling higher risk.
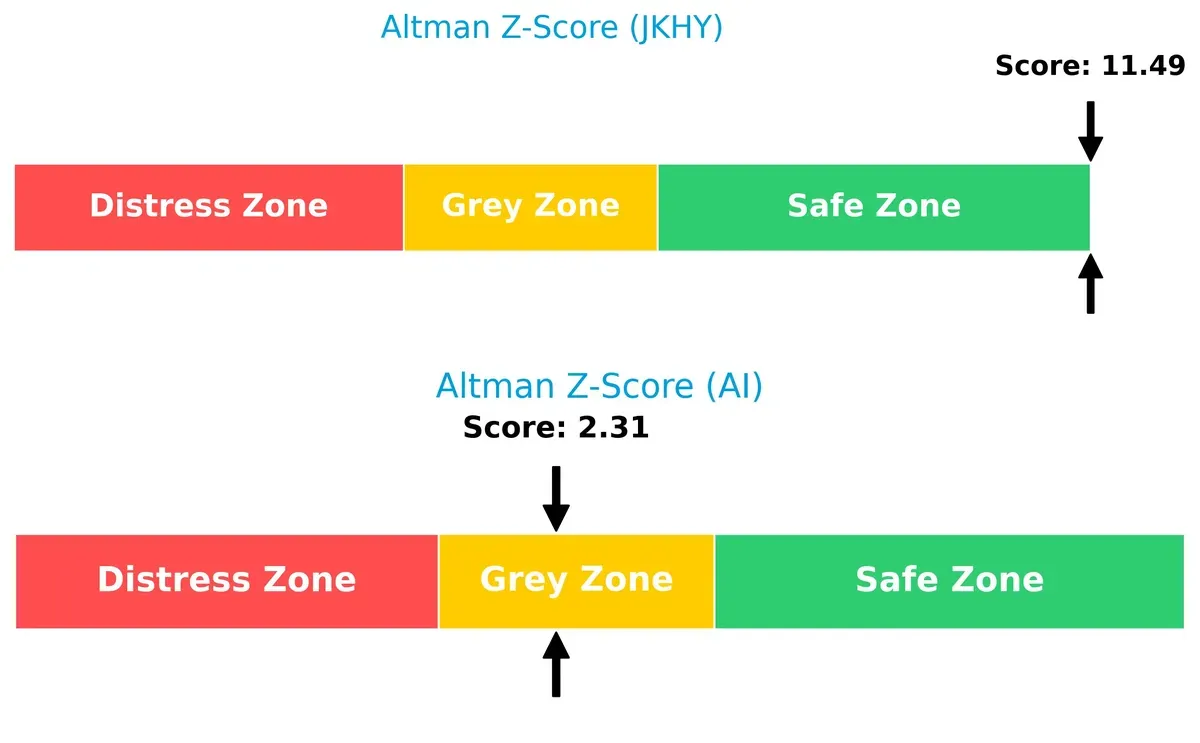
Bankruptcy Risk: Solvency Showdown
Jack Henry’s Altman Z-Score of 11.5 places it decisively in the safe zone, indicating robust long-term solvency. C3.ai’s 2.3 score lands in the grey zone, signaling moderate bankruptcy risk in this cycle:
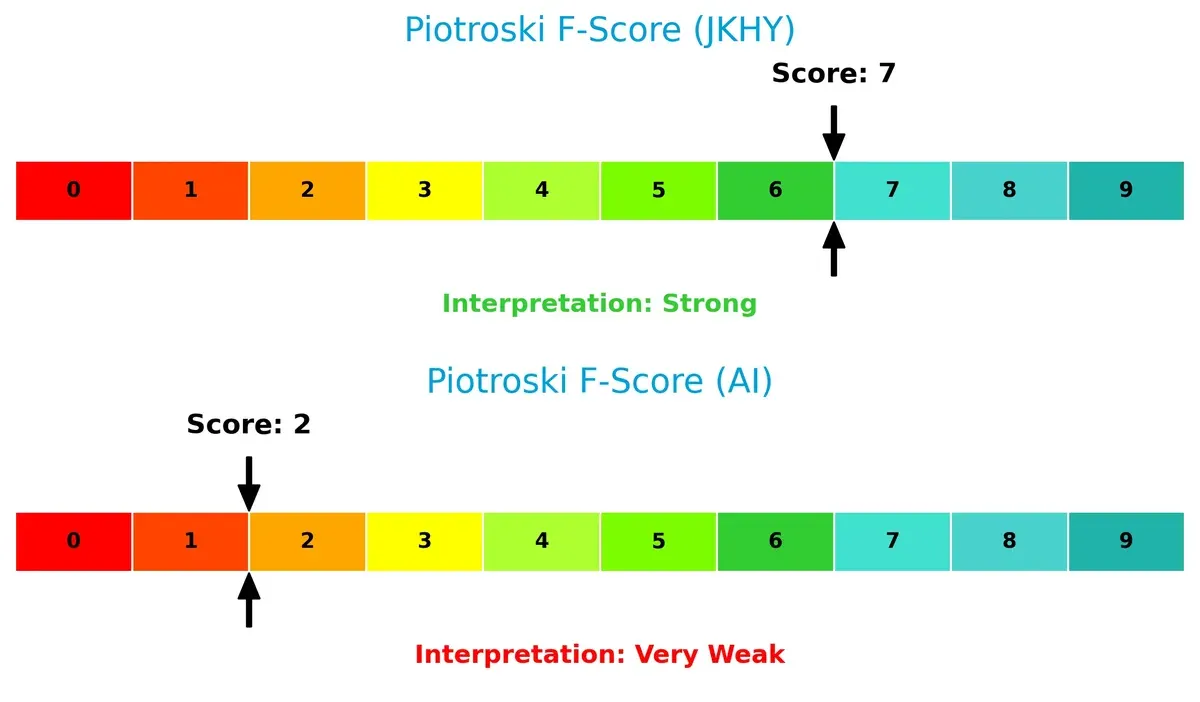
Financial Health: Quality of Operations
Jack Henry’s Piotroski F-Score of 7 suggests strong financial health and operational quality. In contrast, C3.ai’s score of 2 raises red flags about internal financial weakness and potential distress:
How are the two companies positioned?
This section dissects the operational DNA of JKHY and AI by comparing revenue distribution and internal dynamics. The goal is to confront their economic moats to identify which model offers the most resilient competitive advantage today.
Revenue Segmentation: The Strategic Mix
The following visual comparison dissects how Jack Henry & Associates and C3.ai diversify their income streams and where their primary sector bets lie:
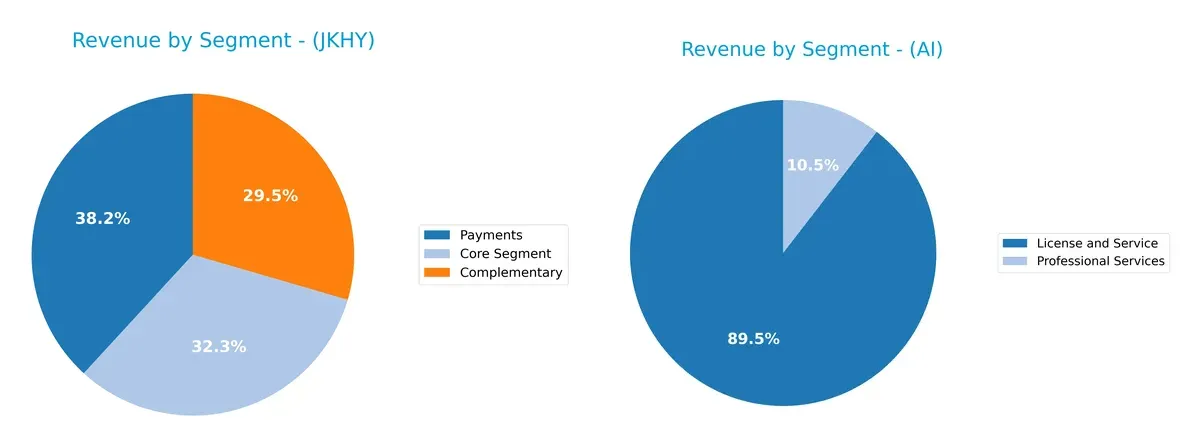
Jack Henry & Associates shows a well-balanced revenue mix in 2025: Payments lead with $873M, followed by Core Segment at $739M and Complementary at $675M. This diversified portfolio reduces concentration risk and anchors its ecosystem lock-in. In contrast, C3.ai relies heavily on its License and Service segment, generating $278M in 2024, dwarfing its $32M Professional Services. This concentration pivots on software licensing, increasing exposure to market shifts in AI adoption.
Strengths and Weaknesses Comparison
This table compares the Strengths and Weaknesses of Jack Henry & Associates, Inc. and C3.ai, Inc.:
JKHY Strengths
- Favorable profitability metrics with 19.19% net margin and 21.39% ROE
- Strong capital efficiency with 17.63% ROIC above 7.18% WACC
- Zero debt and excellent interest coverage
- Diversified revenue streams across Core, Payments, and Complementary segments
AI Strengths
- Favorable quick ratio and low debt levels indicate liquidity and conservative leverage
- Positive P/E ratio despite negative earnings reflects market optimism
- Presence in multiple regions including North America, EMEA, and Asia Pacific
JKHY Weaknesses
- Unfavorable valuation multiples with high P/E of 28.88 and PB of 6.18
- Moderate current ratio at 1.27 may limit short-term flexibility
- Neutral asset turnover suggests room for operational efficiency improvement
AI Weaknesses
- Negative profitability with large net loss margin (-74.21%) and negative ROE and ROIC
- High weighted average cost of capital at 13.23% undermines capital returns
- Poor current ratio and zero interest coverage indicate liquidity and solvency risks
- Lack of dividend yield reduces income appeal
Overall, JKHY exhibits solid profitability and capital structure strengths, supporting its diversified product revenue. AI’s liquidity and geographic exposure are positives but are overshadowed by significant profitability and solvency challenges. These factors shape their respective strategic priorities.
The Moat Duel: Analyzing Competitive Defensibility
A structural moat is the only reliable defense against competition eroding long-term profits. Let’s examine the competitive moats of two tech firms:
Jack Henry & Associates, Inc.: Durable Switching Costs Moat
Jack Henry’s moat stems from high switching costs embedded in its banking software ecosystem. This translates into steady margins and a 10.5% ROIC premium over WACC. In 2026, expanding digital payment and security solutions should deepen this advantage.
C3.ai, Inc.: Emerging Network Effects Moat
C3.ai leverages AI platform network effects, yet its negative ROIC signals value destruction, contrasting with Jack Henry’s profitability. Growth in enterprise AI adoption offers upside, but margin pressures and capital inefficiency remain threats.
Verdict: Switching Costs vs. Network Effects in Sustainability
Jack Henry’s wider and more durable moat outmatches C3.ai’s nascent but unprofitable network effects. Jack Henry is better positioned to defend market share and generate lasting economic profits.
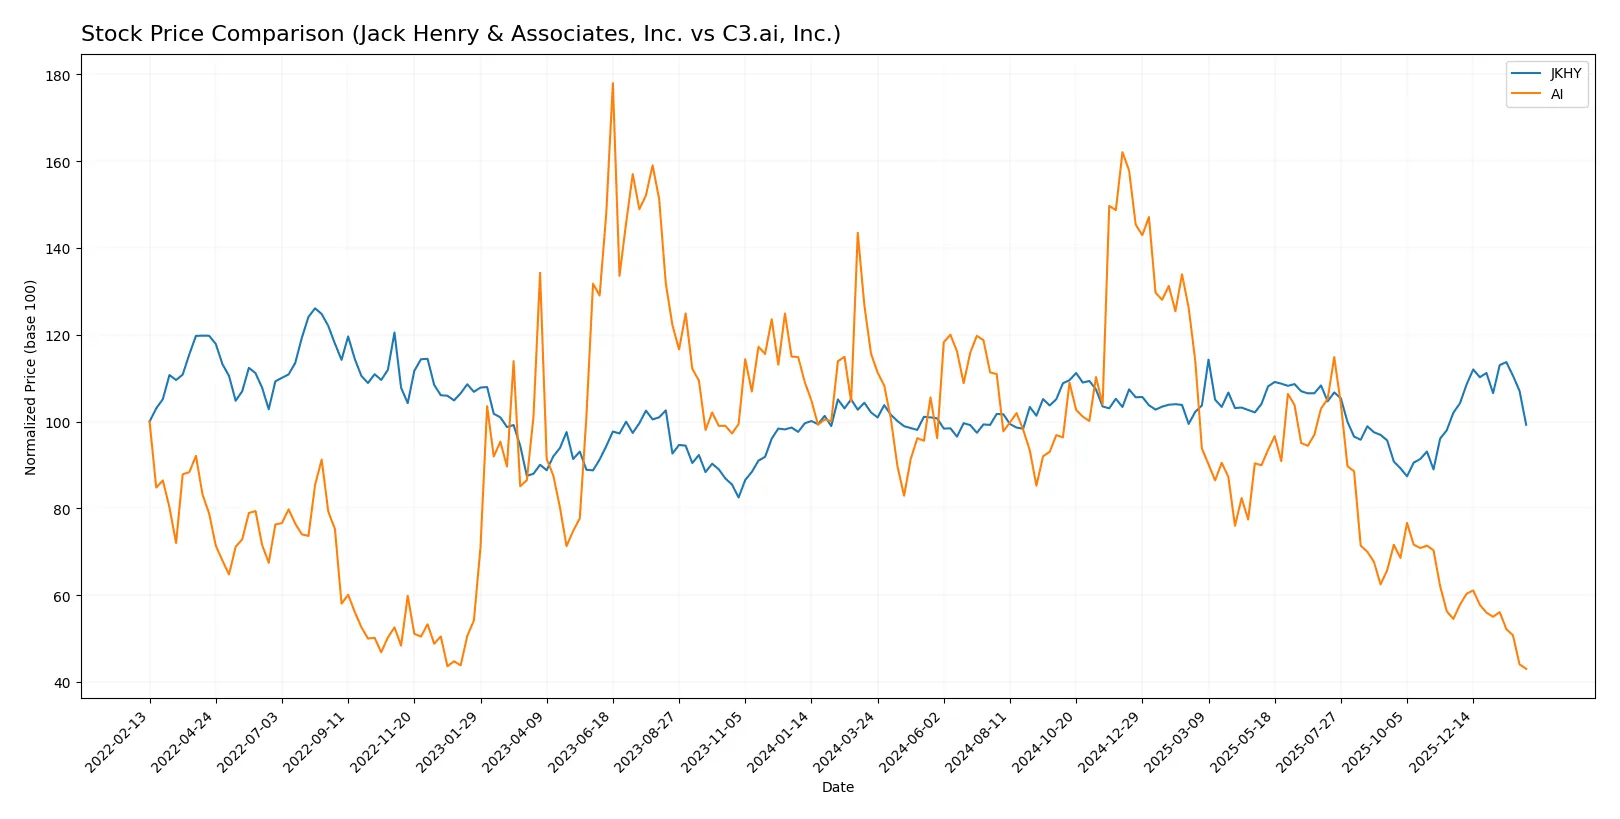
Which stock offers better returns?
The past year reveals sharp contrasts: Jack Henry & Associates shows a modest but accelerating decline, while C3.ai suffers a steep, decelerating drop in share price.
Trend Comparison
Jack Henry & Associates (JKHY) exhibits a 2.8% price decline over 12 months, signaling a bearish trend with accelerating downside momentum and a high price volatility of 9.23%. The stock’s recent trend shows slight recovery potential.
C3.ai (AI) endures a severe 62.8% price drop over the same period, marking a bearish trend with decelerating losses. Volatility stands lower at 6.52%, but recent price action continues sharply downward by 21.1%.
Comparing trends, JKHY outperforms AI, delivering a smaller loss and signs of trend stabilization, while AI faces a far steeper and ongoing market decline.
Target Prices
Analysts present a moderate upside for Jack Henry & Associates and cautious optimism for C3.ai, reflecting mixed sentiment in tech services.
| Company | Target Low | Target High | Consensus |
|---|---|---|---|
| Jack Henry & Associates, Inc. | 181 | 220 | 203.14 |
| C3.ai, Inc. | 10 | 16 | 12.33 |
Jack Henry’s target consensus at $203 exceeds the current $166 price, signaling potential growth. C3.ai’s $12.33 consensus slightly surpasses its $10.75 price, indicating modest upside amid volatility.

Don’t Let Luck Decide Your Entry Point
Optimize your entry points with our advanced ProRealTime indicators. You’ll get efficient buy signals with precise price targets for maximum performance. Start outperforming now!
How do institutions grade them?
Jack Henry & Associates, Inc. Grades
The latest grades from reputable firms for Jack Henry & Associates, Inc. are as follows:
| Grading Company | Action | New Grade | Date |
|---|---|---|---|
| Wells Fargo | Maintain | Equal Weight | 2026-01-30 |
| DA Davidson | Maintain | Buy | 2026-01-29 |
| DA Davidson | Maintain | Buy | 2026-01-28 |
| Wolfe Research | Upgrade | Outperform | 2026-01-08 |
| UBS | Maintain | Neutral | 2026-01-08 |
| RBC Capital | Upgrade | Outperform | 2025-12-16 |
| Baird | Maintain | Neutral | 2025-12-15 |
| Keefe, Bruyette & Woods | Upgrade | Outperform | 2025-12-08 |
| Goldman Sachs | Maintain | Neutral | 2025-11-07 |
| Wells Fargo | Maintain | Equal Weight | 2025-11-06 |
C3.ai, Inc. Grades
The latest grades from reputable firms for C3.ai, Inc. are as follows:
| Grading Company | Action | New Grade | Date |
|---|---|---|---|
| Wedbush | Maintain | Outperform | 2025-12-04 |
| DA Davidson | Maintain | Underperform | 2025-12-04 |
| Canaccord Genuity | Maintain | Hold | 2025-12-04 |
| Needham | Maintain | Hold | 2025-12-04 |
| UBS | Maintain | Neutral | 2025-09-12 |
| Morgan Stanley | Maintain | Underweight | 2025-09-09 |
| Canaccord Genuity | Maintain | Hold | 2025-09-05 |
| Keybanc | Maintain | Underweight | 2025-09-04 |
| UBS | Maintain | Neutral | 2025-09-04 |
| Needham | Maintain | Hold | 2025-09-04 |
Which company has the best grades?
Jack Henry & Associates, Inc. holds stronger grades with multiple Outperform and Buy ratings. C3.ai, Inc. has more cautious ratings including Underperform and Hold. This disparity suggests differing institutional confidence levels that investors should note carefully.
Risks specific to each company
The following categories identify critical pressure points and systemic threats facing both firms in the 2026 market environment:
1. Market & Competition
Jack Henry & Associates, Inc. (JKHY)
- Strong position in financial services tech with legacy clients but faces pressure from fintech innovation.
C3.ai, Inc. (AI)
- Highly exposed to intense AI software competition and rapid technological shifts, struggling to maintain market share.
2. Capital Structure & Debt
Jack Henry & Associates, Inc. (JKHY)
- Virtually no debt, robust interest coverage (57x), low financial risk.
C3.ai, Inc. (AI)
- Minimal debt but zero interest coverage indicates strained ability to service debt if needed.
3. Stock Volatility
Jack Henry & Associates, Inc. (JKHY)
- Low beta (0.71) signals defensive stock with lower market volatility.
C3.ai, Inc. (AI)
- High beta (2.0) reflects extreme price swings and elevated investor risk.
4. Regulatory & Legal
Jack Henry & Associates, Inc. (JKHY)
- Operates in a regulated banking tech space with established compliance frameworks.
C3.ai, Inc. (AI)
- Faces evolving AI regulations and data privacy scrutiny across multiple jurisdictions.
5. Supply Chain & Operations
Jack Henry & Associates, Inc. (JKHY)
- Stable operational base with long-term contracts and integrated IT services.
C3.ai, Inc. (AI)
- Emerging company with operational risks linked to scaling software deployments globally.
6. ESG & Climate Transition
Jack Henry & Associates, Inc. (JKHY)
- Moderate ESG risks typical of IT services; gradual integration of sustainability goals.
C3.ai, Inc. (AI)
- High potential ESG impact due to AI energy consumption and ethical concerns around AI usage.
7. Geopolitical Exposure
Jack Henry & Associates, Inc. (JKHY)
- Primarily US-focused, limiting geopolitical risk exposure.
C3.ai, Inc. (AI)
- Global footprint increases vulnerability to trade tensions and geopolitical uncertainties.
Which company shows a better risk-adjusted profile?
Jack Henry & Associates faces its biggest risk from fintech disruption but boasts excellent financial stability and low volatility. C3.ai’s largest risk lies in its operational scale-up and market competition, compounded by high stock volatility and questionable profitability. JKHY’s safe-zone Altman Z-score (11.5) and strong Piotroski score (7) contrast sharply with AI’s grey-zone Z-score (2.3) and very weak Piotroski (2). This data confirms JKHY’s superior risk-adjusted profile in 2026, driven by its resilient capital structure and defensive market position.
Final Verdict: Which stock to choose?
Jack Henry & Associates, Inc. (JKHY) shines as a cash-generating powerhouse with a durable economic moat. Its consistent value creation and expanding profitability mark it as a stalwart in fintech. A point of vigilance remains in its premium valuation multiples. It suits portfolios aiming for steady, long-term growth.
C3.ai, Inc. (AI) leverages a strategic moat rooted in cutting-edge AI innovation and recurring revenue potential. However, it carries higher risk due to ongoing value erosion and volatile cash flows. Relative to JKHY, AI offers less stability but greater growth runway, fitting a high-risk, speculative growth profile.
If you prioritize capital preservation and reliable returns, Jack Henry outshines with its proven value creation and financial resilience. However, if you seek aggressive exposure to transformative technology and accept significant volatility, C3.ai offers a compelling, albeit riskier, growth scenario. Both choices warrant careful risk management aligned with your investment horizon.
Disclaimer: Investment carries a risk of loss of initial capital. The past performance is not a reliable indicator of future results. Be sure to understand risks before making an investment decision.
Go Further
I encourage you to read the complete analyses of Jack Henry & Associates, Inc. and C3.ai, Inc. to enhance your investment decisions: