Home > Comparison > Technology > IBM vs AI
The strategic rivalry between International Business Machines Corporation and C3.ai, Inc. shapes the evolving landscape of the technology sector. IBM operates as a capital-intensive, diversified technology giant with integrated software, consulting, and infrastructure services. In contrast, C3.ai is a nimble, high-growth AI software provider focused on enterprise applications. This analysis will assess which business model offers a superior risk-adjusted return, guiding portfolio allocation amid sector disruption and innovation.

Table of contents
Companies Overview
International Business Machines Corporation and C3.ai, Inc. stand as pivotal players shaping the technology services landscape.
International Business Machines Corporation: Legacy Innovator in Integrated Tech Solutions
IBM dominates with a vast portfolio spanning software, consulting, infrastructure, and financing. Its core revenue stems from enterprise software, hybrid cloud platforms like Red Hat, and AI-driven solutions. In 2026, IBM strategically doubles down on hybrid cloud and AI, aiming to transform clients’ mission-critical workloads with scalable, secure technology.
C3.ai, Inc.: Agile Pioneer in Enterprise AI Software
C3.ai focuses exclusively on enterprise AI applications, offering platforms that enable customers to design and deploy AI solutions efficiently. Its revenue engine revolves around industry-specific AI apps, such as inventory optimization and predictive maintenance. In 2026, C3.ai targets expanding its footprint via strategic partnerships in oil and gas, financial services, and cloud computing.
Strategic Collision: Similarities & Divergences
IBM and C3.ai both prioritize AI but diverge sharply in scope; IBM embraces a multi-segment, integrated services model, while C3.ai pursues a lean, AI-centric platform approach. Their primary battleground lies in delivering AI capabilities to enterprise clients, with IBM leveraging scale and legacy relationships versus C3.ai’s niche specialization. These differences shape contrasting investment profiles: established resilience versus high-growth potential.
Income Statement Comparison
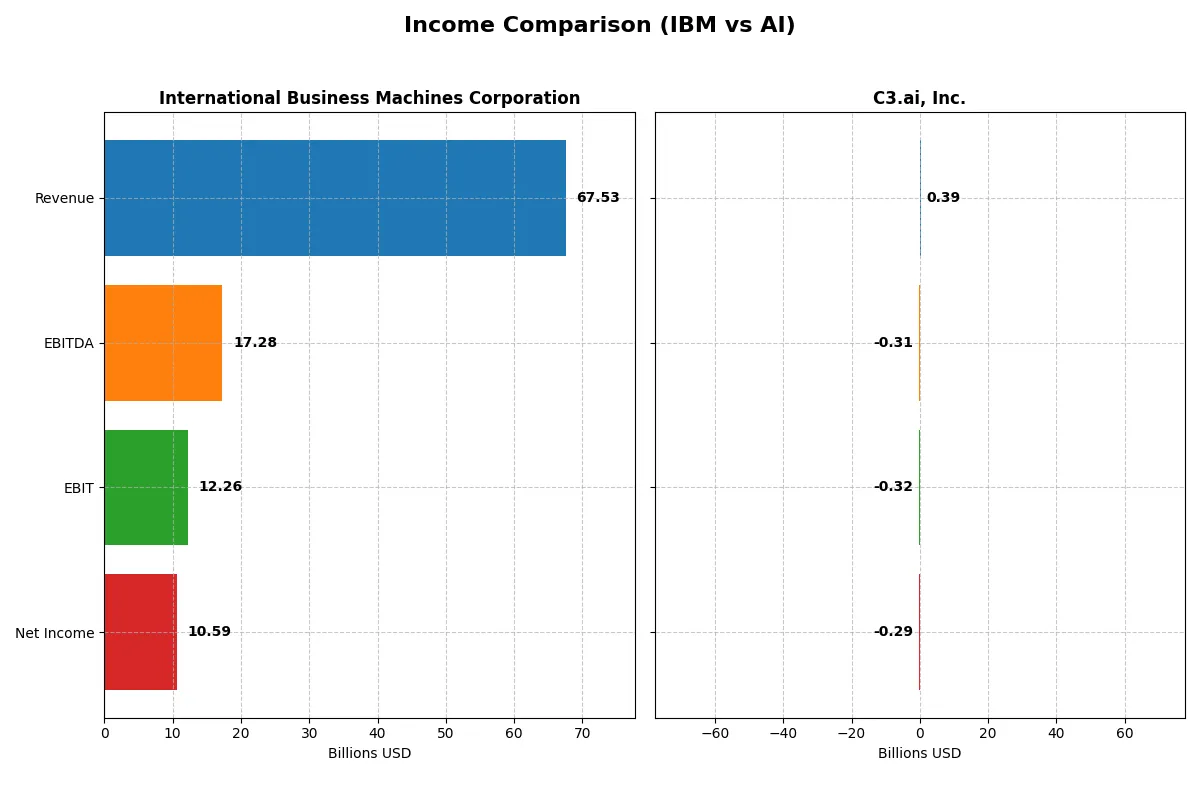
The following data dissects the core profitability and scalability of both corporate engines to reveal who dominates the bottom line:
| Metric | International Business Machines Corporation (IBM) | C3.ai, Inc. (AI) |
|---|---|---|
| Revenue | 67.5B | 389M |
| Cost of Revenue | 27.4B | 153M |
| Operating Expenses | 29.9B | 560M |
| Gross Profit | 40.2B | 236M |
| EBITDA | 17.3B | -312M |
| EBIT | 12.3B | -324M |
| Interest Expense | 1.9B | 0 |
| Net Income | 10.6B | -289M |
| EPS | 11.36 | -2.24 |
| Fiscal Year | 2025 | 2025 |
Income Statement Analysis: The Bottom-Line Duel
This income statement comparison reveals which company runs a more efficient and profitable corporate engine in 2025.
International Business Machines Corporation Analysis
IBM’s revenue climbed steadily from $57.4B in 2021 to $67.5B in 2025, reflecting a 17.8% growth over five years. Net income surged 84.5% to $10.6B in 2025, driven by a strong net margin of 15.7%. IBM’s gross margin holds firm near 59.5%, while EBIT margin expanded sharply to 18.2%, showcasing improved operational efficiency and momentum.
C3.ai, Inc. Analysis
C3.ai’s revenue jumped 25.3% between 2024 and 2025, reaching $389M, with a five-year growth of 112%. However, net losses widened to $289M in 2025, despite a favorable gross margin of 60.6%. The company’s EBIT margin remained deeply negative at -83.4%, reflecting high operating expenses and ongoing investment in growth, weighing down profitability.
Profitability and Growth: Established Strength vs. Growth Struggles
IBM clearly leads with robust profitability metrics and consistent earnings growth, while C3.ai shows impressive top-line expansion but struggles to convert revenue into profit. For investors prioritizing durable earnings and margin health, IBM’s profile offers a proven, efficient business engine. C3.ai’s profile suits those focused on high growth potential despite current losses.
Financial Ratios Comparison
These vital ratios act as a diagnostic tool to expose the underlying fiscal health, valuation premiums, and capital efficiency of the companies compared below:
| Ratios | IBM (IBM) | C3.ai, Inc. (AI) |
|---|---|---|
| ROE | 33.3% (2023) | -34.4% (2025) |
| ROIC | 7.8% (2023) | -36.1% (2025) |
| P/E | 19.9 (2023) | -9.8 (2025) |
| P/B | 6.6 (2023) | 3.4 (2025) |
| Current Ratio | 0.96 (2023) | 6.86 (2025) |
| Quick Ratio | 0.93 (2023) | 6.86 (2025) |
| D/E (Debt-to-Equity) | 2.66 (2023) | 0.006 (2025) |
| Debt-to-Assets | 44.3% (2023) | 0.5% (2025) |
| Interest Coverage | 6.11 (2023) | 0 (2025) |
| Asset Turnover | 0.46 (2023) | 0.38 (2025) |
| Fixed Asset Turnover | 7.09 (2023) | 4.91 (2025) |
| Payout Ratio | 80.5% (2023) | 0% (2025) |
| Dividend Yield | 4.05% (2023) | 0% (2025) |
| Fiscal Year | 2023 | 2025 |
Efficiency & Valuation Duel: The Vital Signs
Ratios act as a company’s DNA, unveiling hidden risks and operational strengths that shape investor decisions in complex markets.
International Business Machines Corporation
IBM shows a mixed profile with a favorable net margin of 15.7% but zero reported ROE and ROIC, signaling weak profitability metrics. The stock trades at a stretched P/E of 26.1, suggesting premium valuation. IBM rewards shareholders with a 2.27% dividend yield, indicating steady income despite reinvestment in R&D.
C3.ai, Inc.
C3.ai struggles with severe profitability issues: net margin at -74.2%, ROE at -34.4%, and negative ROIC. Its valuation appears more attractive with a negative P/E reflecting losses, but a high P/B of 3.39 implies elevated price relative to book. The company pays no dividend, focusing heavily on R&D and growth investments.
Premium Valuation vs. Operational Safety
IBM offers a safer profile with positive margins and steady dividends, albeit at a stretched valuation. C3.ai’s high growth bet comes with deep losses and operational risks. Investors seeking income and relative stability may prefer IBM, while those aiming for growth exposure face higher uncertainty with C3.ai.
Which one offers the Superior Shareholder Reward?
I compare IBM’s steady dividend yield of ~2.3% to C3.ai’s zero payout. IBM’s payout ratio hovers around 59%, backed by strong free cash flow coverage (2.1x), ensuring sustainability. IBM also executes consistent buybacks, enhancing shareholder returns. Conversely, C3.ai reinvests aggressively in R&D, sacrificing near-term cash returns for growth. However, its negative margins and cash flow signal risk. I conclude IBM offers a superior total return profile in 2026, blending income with capital efficiency.
Comparative Score Analysis: The Strategic Profile
The radar chart reveals the fundamental DNA and trade-offs of International Business Machines Corporation and C3.ai, Inc., exposing their core financial strengths and vulnerabilities:
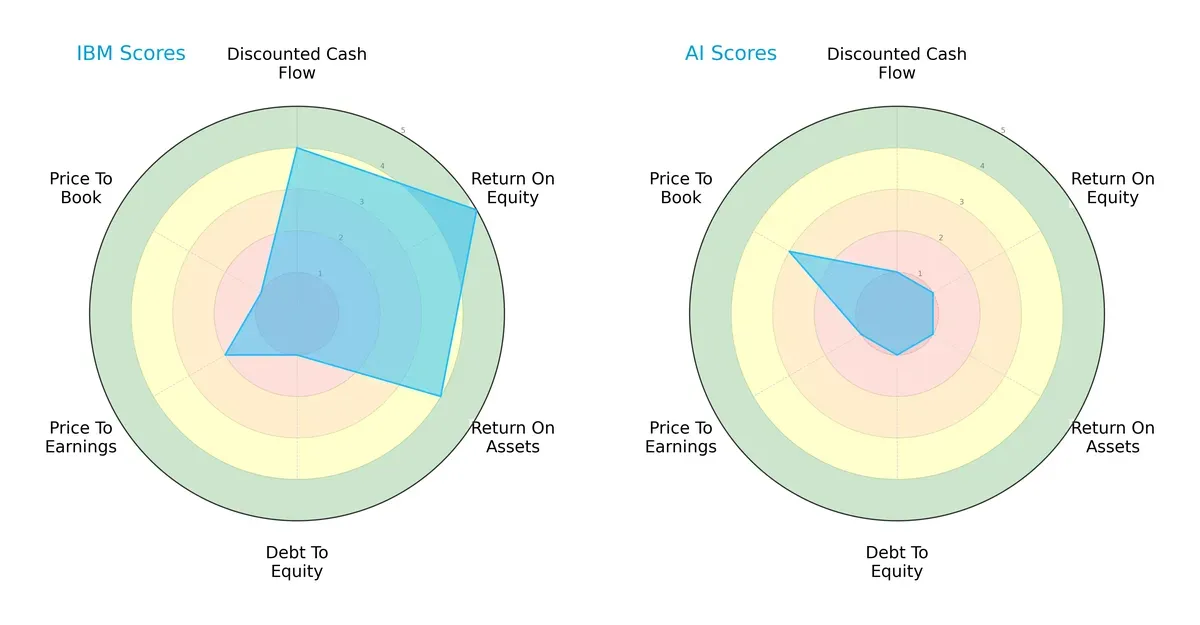
IBM demonstrates a well-rounded profile with strong ROE (5) and ROA (4) scores, signaling efficient profit generation and asset utilization. Its DCF score (4) also suggests reasonable valuation. However, IBM’s very low debt-to-equity (1) and price-to-book (1) scores highlight a leveraged balance sheet and potential overvaluation risks. Conversely, C3.ai registers uniformly low scores except for a moderate price-to-book (3), indicating it relies mostly on valuation metrics amid operational and profitability weaknesses. IBM offers a balanced strategy, while C3.ai depends heavily on market sentiment.
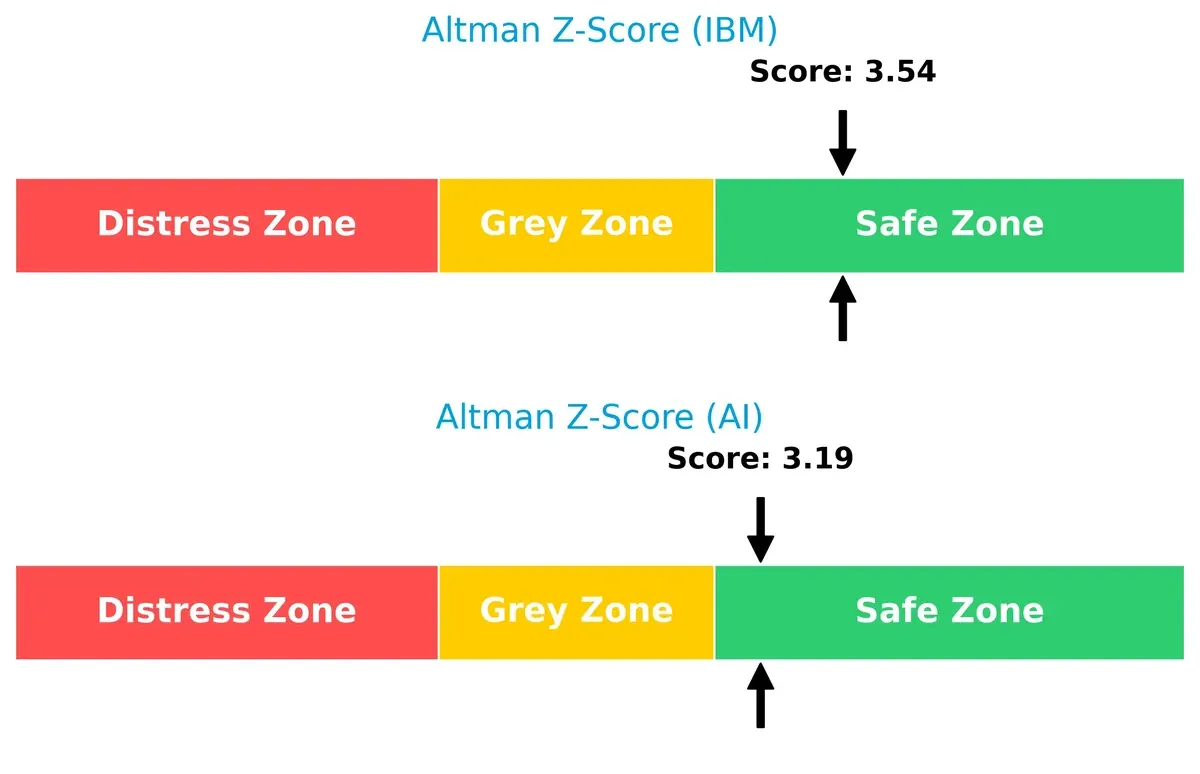
Bankruptcy Risk: Solvency Showdown
IBM’s Altman Z-Score of 3.54 slightly outperforms C3.ai’s 3.19, both safely above the distress threshold, implying solid solvency profiles for long-term survival in this market cycle:
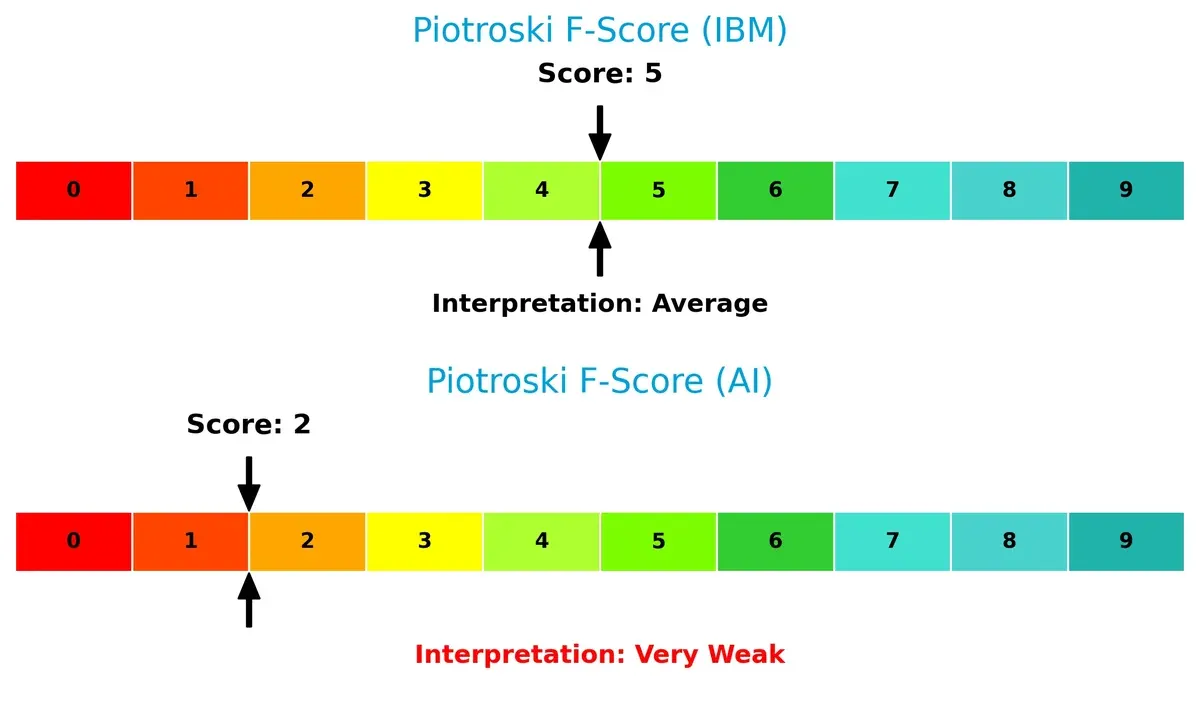
Financial Health: Quality of Operations
IBM’s Piotroski F-Score of 5 reflects average financial health, whereas C3.ai’s score of 2 flags significant red flags in operational quality and internal metrics:
How are the two companies positioned?
This section dissects IBM and AI’s operational DNA by comparing their revenue distribution and internal dynamics. The goal is to confront their economic moats and identify which model delivers the most resilient competitive advantage today.
Revenue Segmentation: The Strategic Mix
This visual comparison dissects how International Business Machines Corporation and C3.ai, Inc. diversify their income streams and where their primary sector bets lie:
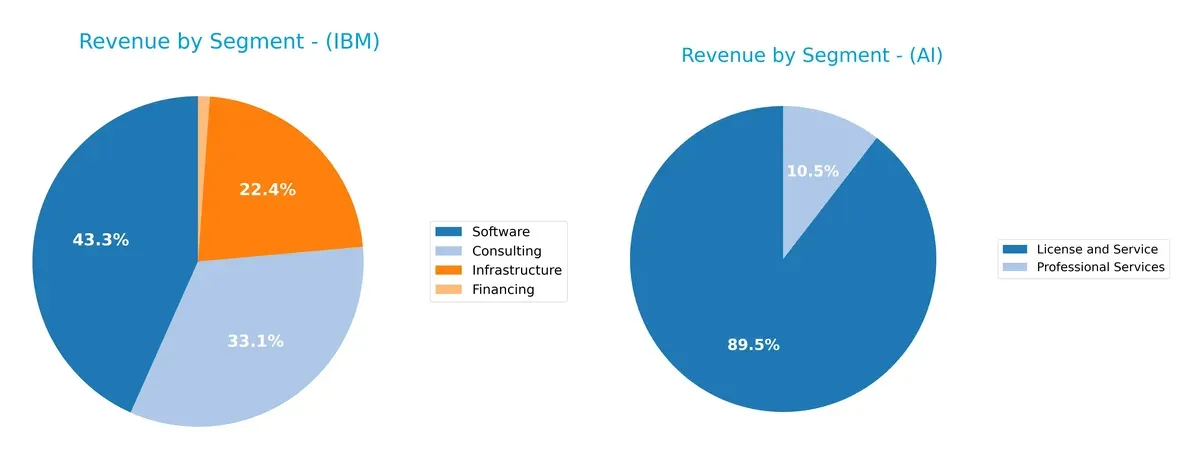
IBM’s revenue spans multiple robust segments like Software ($27B), Consulting ($21B), and Infrastructure ($14B), showing a well-diversified portfolio. C3.ai, Inc. relies heavily on License and Service ($278M) with a smaller Professional Services slice ($32M), reflecting a concentrated revenue model. IBM’s diverse mix reduces risk and supports ecosystem lock-in, while C3.ai faces concentration risk but can pivot faster in niche AI services.
Strengths and Weaknesses Comparison
This table compares the Strengths and Weaknesses of IBM and C3.ai, Inc.:
IBM Strengths
- Diversified revenue streams across Consulting, Software, Infrastructure, and Financing
- Strong global presence in Americas, EMEA, and Asia Pacific
- Favorable net margin at 15.69%
- Solid interest coverage ratio of 6.34
- Favorable debt-to-assets and dividend yield at 2.27%
AI Strengths
- Innovation focus with License and Service revenues growing
- Favorable quick ratio of 6.86 indicates strong liquidity
- Low debt-to-assets ratio at 0.47%
- High fixed asset turnover at 4.91 shows efficient use of assets
- Favorable price-earnings ratio despite negative earnings
IBM Weaknesses
- Unfavorable ROE and ROIC at 0%, signaling weak capital returns
- Poor liquidity ratios (current and quick ratios at 0)
- Unavailable WACC metric limits cost of capital assessment
- Unfavorable asset turnover metrics
- Pe ratio of 26.07 considered high relative to growth
AI Weaknesses
- Negative net margin (-74.21%) and ROE (-34.44%) reflect unprofitability
- Unfavorable WACC at 13.03% increases capital costs
- High price-to-book ratio at 3.39 indicates overvaluation risk
- Interest coverage at 0 signals inability to service debt
- Absence of dividend yield limits income potential
IBM shows diversified revenue and solid global footprint but struggles with profitability metrics and liquidity. AI drives innovation and maintains strong liquidity yet faces significant profitability and valuation challenges. These contrasts highlight differing strategic priorities and risk profiles.
The Moat Duel: Analyzing Competitive Defensibility
A structural moat is the only thing protecting long-term profits from the erosion of competition. Let’s examine how IBM and C3.ai defend their turf:
IBM: Hybrid Cloud & Consulting Lock-In
IBM’s moat arises from its integrated hybrid cloud and consulting services. This manifests in stable 18% EBIT margins and 15.7% net margins. Continued AI and automation product launches in 2026 could deepen this advantage but require innovation to fend off agile competitors.
C3.ai: AI Platform Innovation
C3.ai relies on a specialized AI platform moat different from IBM’s. Its high gross margin of 60.6% contrasts with negative EBIT margins, indicating growth challenges. Despite strong revenue growth, its declining ROIC signals risks. Expansion into new sectors in 2026 may disrupt markets but also tests capital efficiency.
Moat Strength Showdown: Integrated Solutions vs. Platform Agility
IBM’s moat is wider and financially more durable, supported by consistent profitability and market reach. C3.ai’s innovative platform offers potential but suffers declining returns and value destruction. IBM stands better equipped to defend market share amid intensifying competition.
Which stock offers better returns?
The past year shows stark contrasts in price performance and trading activity between IBM and C3.ai, highlighting divergent market sentiment and momentum dynamics.
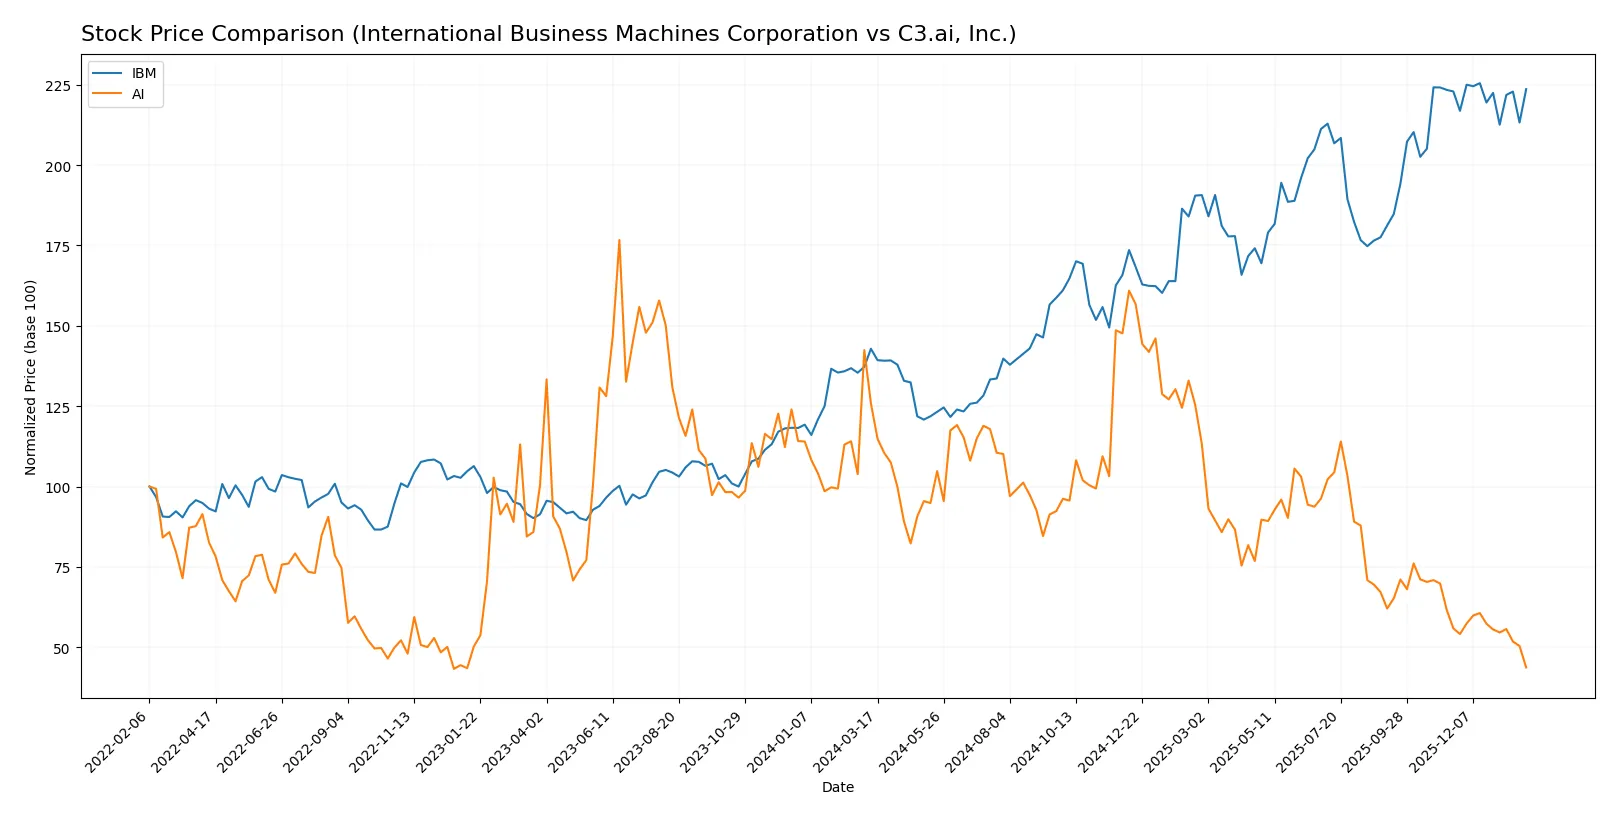
Trend Comparison
IBM’s stock price rose 56.52% over the past 12 months, marking a bullish trend with decelerating momentum. Price fluctuated widely, from 165.71 to 309.24, reflecting high volatility.
C3.ai’s stock declined 65.27% in the same period, confirming a bearish trend with deceleration. Price ranged narrowly between 11.01 and 40.52, indicating limited upside and persistent weakness.
IBM outperformed C3.ai significantly, delivering strong positive returns while C3.ai’s bearish trajectory and volume trends signal ongoing investor caution.
Target Prices
Analysts present a mixed but constructive outlook on IBM and C3.ai, with clear upside potential for both.
| Company | Target Low | Target High | Consensus |
|---|---|---|---|
| International Business Machines Corporation | 304 | 380 | 349.5 |
| C3.ai, Inc. | 10 | 16 | 12.33 |
IBM’s consensus target of 349.5 implies a 14% premium to its current 306.7 price, reflecting confidence in its hybrid cloud strategy. C3.ai’s 12.33 target suggests modest upside from 11.01, tempered by its higher volatility and execution risk.

Don’t Let Luck Decide Your Entry Point
Optimize your entry points with our advanced ProRealTime indicators. You’ll get efficient buy signals with precise price targets for maximum performance. Start outperforming now!
How do institutions grade them?
Here is a summary of recent institutional grades for International Business Machines Corporation and C3.ai, Inc.:
International Business Machines Corporation Grades
The following table lists recent grades from reputable institutions for IBM:
| Grading Company | Action | New Grade | Date |
|---|---|---|---|
| JP Morgan | Maintain | Neutral | 2026-01-29 |
| Evercore ISI Group | Maintain | Outperform | 2026-01-29 |
| RBC Capital | Maintain | Outperform | 2026-01-29 |
| Jefferies | Maintain | Buy | 2026-01-29 |
| UBS | Maintain | Sell | 2026-01-29 |
| Stifel | Maintain | Buy | 2026-01-29 |
| Wedbush | Maintain | Outperform | 2026-01-29 |
| JP Morgan | Maintain | Neutral | 2026-01-21 |
| Evercore ISI Group | Maintain | Outperform | 2026-01-20 |
| B of A Securities | Maintain | Buy | 2026-01-13 |
C3.ai, Inc. Grades
Below are recent institutional grades for C3.ai, Inc.:
| Grading Company | Action | New Grade | Date |
|---|---|---|---|
| Wedbush | Maintain | Outperform | 2025-12-04 |
| DA Davidson | Maintain | Underperform | 2025-12-04 |
| Canaccord Genuity | Maintain | Hold | 2025-12-04 |
| Needham | Maintain | Hold | 2025-12-04 |
| UBS | Maintain | Neutral | 2025-09-12 |
| Morgan Stanley | Maintain | Underweight | 2025-09-09 |
| Canaccord Genuity | Maintain | Hold | 2025-09-05 |
| Keybanc | Maintain | Underweight | 2025-09-04 |
| UBS | Maintain | Neutral | 2025-09-04 |
| Needham | Maintain | Hold | 2025-09-04 |
Which company has the best grades?
IBM has received more consistent positive grades, including multiple “Buy” and “Outperform” ratings. C3.ai’s grades skew toward “Hold,” “Neutral,” and some “Underperform” ratings. This disparity may influence investor confidence and perceived risk.
Risks specific to each company
The following categories identify critical pressure points and systemic threats facing International Business Machines Corporation and C3.ai, Inc. in the 2026 market environment:
1. Market & Competition
International Business Machines Corporation
- Established hybrid cloud and AI software leader with diversified segments facing intense tech competition.
C3.ai, Inc.
- Small enterprise AI player with rapid innovation but aggressive competition and market share challenges.
2. Capital Structure & Debt
International Business Machines Corporation
- Favorable debt-to-equity metrics and strong interest coverage support financial stability.
C3.ai, Inc.
- Minimal debt but poor interest coverage signals cash burn and financial fragility.
3. Stock Volatility
International Business Machines Corporation
- Low beta of 0.7 indicates less price volatility relative to the market.
C3.ai, Inc.
- High beta near 2.0 exposes shareholders to elevated price swings and risk.
4. Regulatory & Legal
International Business Machines Corporation
- Operating globally in regulated sectors, IBM faces complex compliance but has established protocols.
C3.ai, Inc.
- Emerging AI regulations and data privacy laws pose regulatory uncertainties for C3.ai’s growth.
5. Supply Chain & Operations
International Business Machines Corporation
- Extensive global supply chain with potential risks but robust operational infrastructure.
C3.ai, Inc.
- Reliant on cloud partners and supply chain for AI data, vulnerable to disruptions and service dependencies.
6. ESG & Climate Transition
International Business Machines Corporation
- Mature ESG programs and climate initiatives align with investor expectations and regulatory trends.
C3.ai, Inc.
- ESG efforts less mature; faces pressure to improve sustainability in fast-evolving AI sector.
7. Geopolitical Exposure
International Business Machines Corporation
- Significant international footprint exposes IBM to geopolitical risks, but diversified markets mitigate impact.
C3.ai, Inc.
- Global operations concentrated in tech hubs; geopolitical tensions could hinder expansion.
Which company shows a better risk-adjusted profile?
IBM’s most impactful risk is intense competition that demands continuous innovation across diversified segments. C3.ai’s key risk is severe financial instability, reflected in poor margins and weak interest coverage. IBM’s lower volatility and stronger capital structure deliver a better risk-adjusted profile. C3.ai’s stock fell over 10% recently, underscoring market concerns about its financial health.
Final Verdict: Which stock to choose?
International Business Machines Corporation (IBM) wields a proven ability to generate strong free cash flow and sustain healthy profit margins, positioning itself as a cash machine in a mature tech sector. Its point of vigilance remains a heavily leveraged balance sheet, which could pressure financial flexibility. IBM suits investors seeking stable income and moderate growth, fitting well in conservative or dividend-focused portfolios.
C3.ai, Inc. (AI) commands a strategic moat through its niche in AI software and rapid revenue growth, driven by high R&D intensity and innovative offerings. Relative to IBM, AI presents a riskier profile with ongoing losses and negative returns on invested capital. This stock aligns with aggressive growth investors willing to tolerate volatility for potential disruptive upside.
If you prioritize steady cash generation and income with relatively lower risk, IBM is the compelling choice due to its consistent profitability and market resilience. However, if you seek high-growth exposure with a tolerance for financial instability, AI offers superior top-line expansion and innovation potential, albeit with significant value destruction risks.
Disclaimer: Investment carries a risk of loss of initial capital. The past performance is not a reliable indicator of future results. Be sure to understand risks before making an investment decision.
Go Further
I encourage you to read the complete analyses of International Business Machines Corporation and C3.ai, Inc. to enhance your investment decisions: