In the rapidly evolving technology sector, Globant S.A. and C3.ai, Inc. stand out as dynamic players shaping the future of digital transformation and artificial intelligence. Both companies operate within the information technology services industry, yet they carve distinct niches—Globant with its broad digital innovation and consulting services, and C3.ai with its specialized enterprise AI software solutions. This article will help you determine which company offers the most compelling investment opportunity in 2026.
Table of contents
Companies Overview
I will begin the comparison between Globant and C3.ai by providing an overview of these two companies and their main differences.
Globant Overview
Globant S.A. is a technology services company based in Luxembourg, focused on delivering innovative digital and cognitive transformation services worldwide. With a workforce of 31,280 employees, Globant offers a broad range of solutions including e-commerce, cloud transformation, AI-powered data services, and digital experience platforms. It aims to reinvent business processes through advanced technologies across multiple industries.
C3.ai Overview
C3.ai, Inc. is a U.S.-based enterprise AI software provider headquartered in Redwood City, California. Founded in 2009, it specializes in AI application platforms and industry-specific solutions such as supply chain risk, predictive maintenance, and fraud detection. Employing 891 people, C3.ai serves various sectors including oil and gas, financial services, and healthcare, leveraging strategic partnerships with major technology firms.
Key similarities and differences
Both companies operate in the information technology services sector, focusing on digital transformation and AI-driven solutions. Globant’s business model emphasizes broad technology consulting and software development services on a global scale, while C3.ai concentrates on enterprise AI applications with a narrower employee base and specialized industry focus. The contrast in scale and service breadth distinguishes their market positions.
Income Statement Comparison
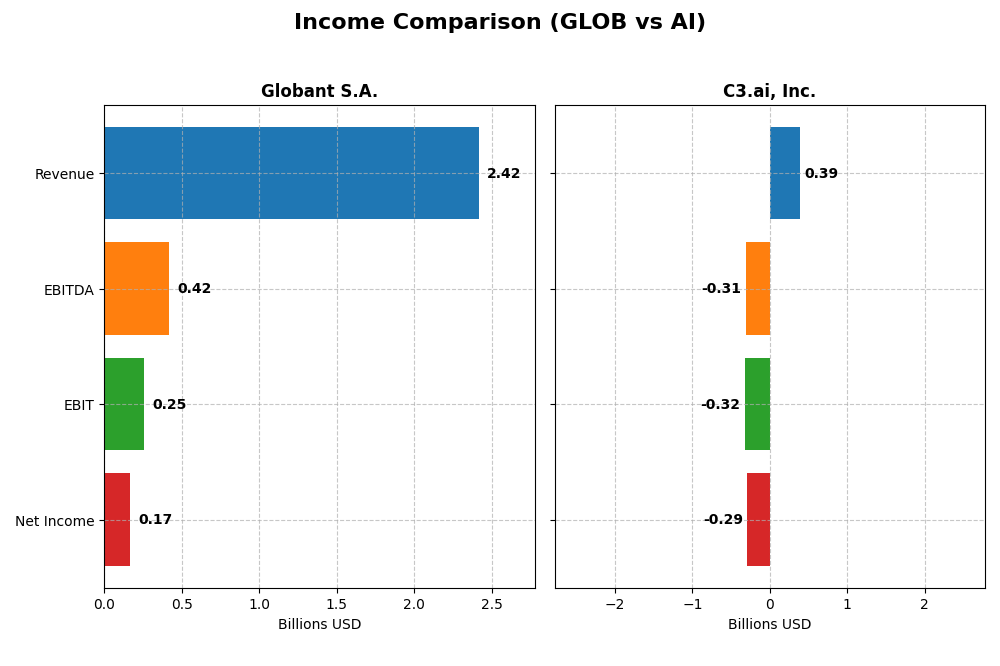
This table presents the latest fiscal year income statement figures for Globant S.A. and C3.ai, Inc., allowing a straightforward financial comparison between these two technology firms.
| Metric | Globant S.A. (GLOB) | C3.ai, Inc. (AI) |
|---|---|---|
| Market Cap | 2.99B | 1.87B |
| Revenue | 2.42B | 389M |
| EBITDA | 417M | -312M |
| EBIT | 254M | -324M |
| Net Income | 166M | -289M |
| EPS | 3.82 | -2.24 |
| Fiscal Year | 2024 | 2025 |
Income Statement Interpretations
Globant S.A.
Globant S.A. has exhibited strong revenue growth from 2020 to 2024, increasing from $814M to $2.42B, with net income rising from $54M to $166M. Margins have generally remained stable, with gross margin at 35.74% and net margin at 6.86% in 2024. The latest year showed favorable growth in revenue (+15.3%) and EBIT (+16.6%), although net margin slightly declined by 9.3%.
C3.ai, Inc.
C3.ai’s revenue grew steadily from $183M in 2021 to $389M in 2025, reflecting a 25.3% increase in the latest year. Despite strong gross margin at 60.6%, the company has been operating at significant losses, with a net margin of -74.2% in 2025. The most recent year saw mixed results: revenue and gross profit improved, but EBIT remained deeply negative and net losses persisted.
Which one has the stronger fundamentals?
Evaluating fundamentals, Globant demonstrates more consistent profitability, stable margins, and significant net income growth, supported by favorable operating metrics and margin stability. C3.ai shows strong top-line growth and gross margins but faces persistent large losses and negative net margins, which weigh on its overall financial strength. Globant’s income statement exhibits more favorable indicators relative to risk.
Financial Ratios Comparison
The table below presents a side-by-side comparison of key financial ratios for Globant S.A. (GLOB) and C3.ai, Inc. (AI) based on their most recent fiscal year data available.
| Ratios | Globant S.A. (GLOB) 2024 | C3.ai, Inc. (AI) 2025 |
|---|---|---|
| ROE | 8.44% | -34.44% |
| ROIC | 6.82% | -36.10% |
| P/E | 57.64 | -9.84 |
| P/B | 4.86 | 3.39 |
| Current Ratio | 1.54 | 6.86 |
| Quick Ratio | 1.54 | 6.86 |
| D/E (Debt-to-Equity) | 0.21 | 0.01 |
| Debt-to-Assets | 13.0% | 0.47% |
| Interest Coverage | 7.87 | 0 |
| Asset Turnover | 0.76 | 0.38 |
| Fixed Asset Turnover | 8.70 | 4.91 |
| Payout ratio | 0 | 0 |
| Dividend yield | 0% | 0% |
Interpretation of the Ratios
Globant S.A.
Globant exhibits a blend of favorable and unfavorable ratios. Its current and quick ratios (1.54) and low debt-to-equity (0.21) and debt-to-assets (12.95%) indicate solid liquidity and conservative leverage. However, elevated P/E (57.64) and P/B (4.86) ratios along with modest ROE (8.44%) raise valuation and profitability concerns. It does not pay dividends, reflecting a reinvestment strategy typical of growth-focused tech firms.
C3.ai, Inc.
C3.ai shows mostly unfavorable ratios, with deeply negative net margin (-74.21%) and returns (ROE -34.44%, ROIC -36.1%), alongside a high WACC (12.97%). Despite a strong quick ratio (6.86) and low leverage (D/E 0.01), poor asset turnover (0.38) and zero interest coverage highlight operational challenges. The company pays no dividends, prioritizing R&D and growth investments amid ongoing losses.
Which one has the best ratios?
Globant’s ratios are slightly favorable, supported by liquidity and manageable debt levels, despite some valuation and profitability weaknesses. In contrast, C3.ai’s ratios are largely unfavorable, with significant losses and operational inefficiencies outweighing its liquidity strength. Thus, Globant presents a comparatively stronger financial profile based on the provided ratio evaluations.
Strategic Positioning
This section compares the strategic positioning of Globant S.A. and C3.ai, Inc. regarding market position, key segments, and exposure to technological disruption:
Globant S.A.
- Operates worldwide in IT services with a broad technology portfolio facing moderate competitive pressure.
- Diverse segments including e-commerce, healthcare, cloud services, media, and digital platforms.
- Provides various tech innovations but no explicit mention of disruptive technology exposure.
C3.ai, Inc.
- Operates internationally in enterprise AI software with high beta indicating strong competitive volatility.
- Focused on AI applications and platforms for industries like oil, finance, manufacturing, and defense.
- Strong focus on AI-driven enterprise software, integrating advanced AI solutions across multiple sectors.
Globant S.A. vs C3.ai, Inc. Positioning
Globant presents a diversified business model across multiple IT services and industries, offering broad market exposure. C3.ai concentrates on enterprise AI software with targeted industry solutions, implying a focused technological approach but narrower diversification.
Which has the best competitive advantage?
Both companies are currently shedding value, but Globant shows a growing ROIC trend, indicating improving profitability, unlike C3.ai, which faces declining ROIC and very unfavorable moat status.
Stock Comparison
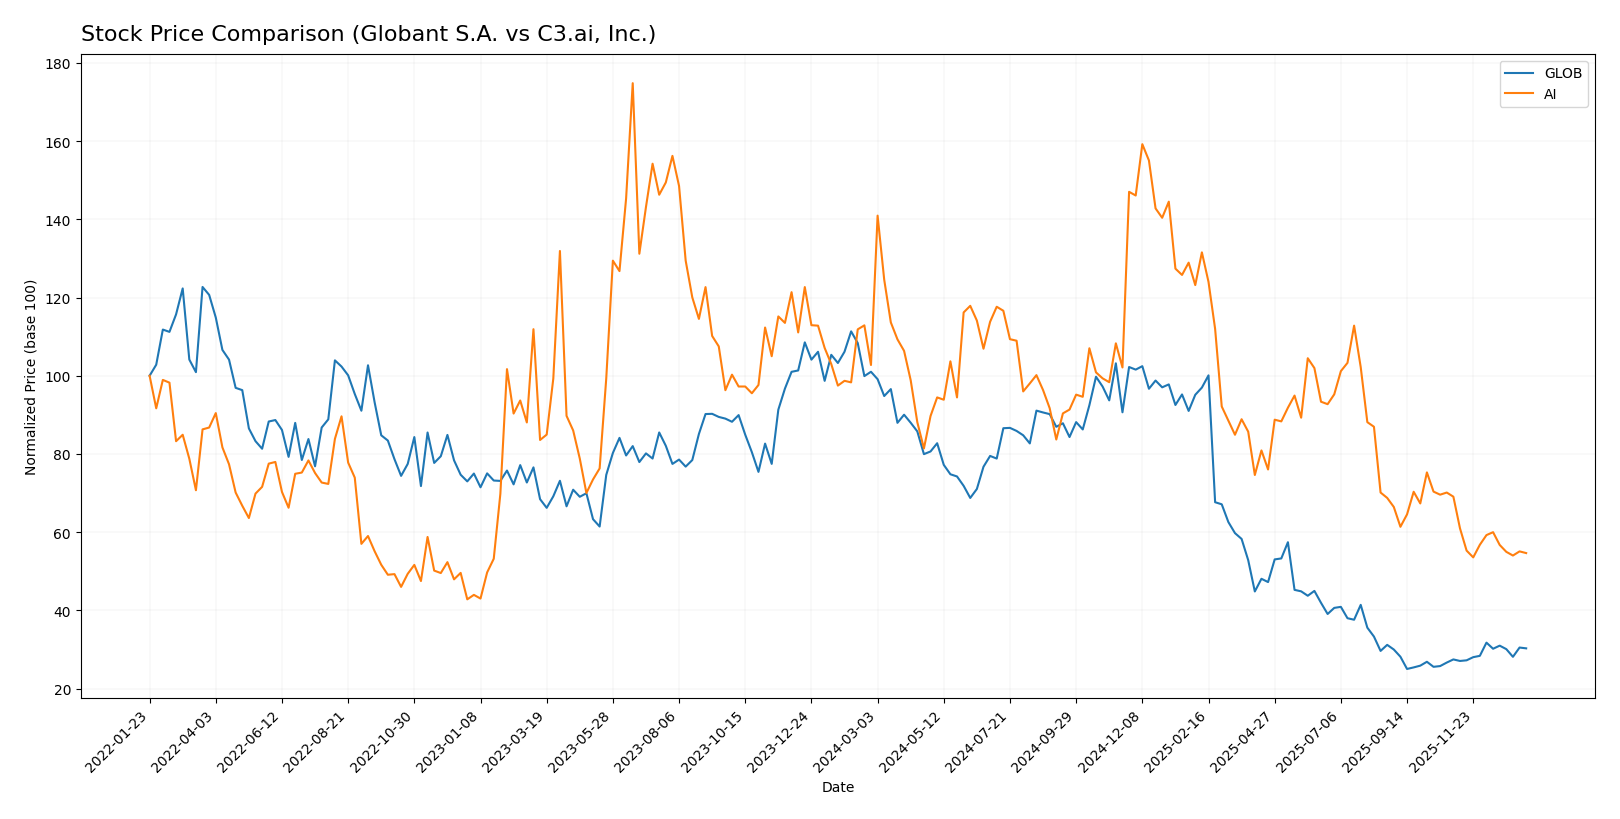
The stock prices of Globant S.A. and C3.ai, Inc. have exhibited notable declines over the past twelve months, with differing recent momentum and trading volume dynamics reflecting contrasting investor sentiment.
Trend Analysis
Globant S.A. showed a bearish trend over the past year with a price decrease of 70.01%, accompanied by high volatility (61.44 std deviation) and accelerating downward momentum. Recently, the trend reversed slightly, gaining 10.31% from November 2025 to January 2026.
C3.ai, Inc. also experienced a bearish trend, falling 46.81% over the last year with moderate volatility (6.29 std deviation) and decelerating decline. Its recent trend remained negative with a 20.88% drop between November 2025 and January 2026.
Comparing both, Globant S.A. showed a larger overall decline but recent positive momentum, while C3.ai had a smaller overall loss but continued weaker recent performance, making Globant’s recent recovery more pronounced.
Target Prices
Analysts provide a clear consensus on the target prices for Globant S.A. and C3.ai, Inc., reflecting their market outlooks.
| Company | Target High | Target Low | Consensus |
|---|---|---|---|
| Globant S.A. | 80 | 68 | 72.5 |
| C3.ai, Inc. | 16 | 11 | 13.5 |
The consensus target prices suggest moderate upside potential for Globant S.A., with its current price just below the consensus, while C3.ai’s target aligns closely with its present price, indicating a balanced risk-reward outlook.
Analyst Opinions Comparison
This section compares analysts’ ratings and grades for Globant S.A. and C3.ai, Inc.:
Rating Comparison
GLOB Rating
- Rating: A- indicating a very favorable assessment.
- Discounted Cash Flow Score: 5, very favorable score.
- ROE Score: 3, moderate level of profitability.
- ROA Score: 3, moderate asset utilization.
- Debt To Equity Score: 3, moderate financial risk.
- Overall Score: 4, favorable overall standing.
AI Rating
- Rating: D+ reflecting a very unfavorable evaluation.
- Discounted Cash Flow Score: 1, very unfavorable score.
- ROE Score: 1, very unfavorable profitability level.
- ROA Score: 1, very unfavorable asset utilization.
- Debt To Equity Score: 1, very unfavorable financial risk.
- Overall Score: 1, very unfavorable overall standing.
Which one is the best rated?
Based strictly on the provided data, Globant S.A. holds significantly higher ratings and scores across all key financial metrics compared to C3.ai, Inc., indicating a stronger overall financial standing.
Scores Comparison
Here is a comparison of the financial scores for Globant S.A. and C3.ai, Inc.:
GLOB Scores
- Altman Z-Score: 3.05, indicating a safe zone and low bankruptcy risk.
- Piotroski Score: 5, reflecting average financial strength.
AI Scores
- Altman Z-Score: 3.59, indicating a safe zone and low bankruptcy risk.
- Piotroski Score: 2, indicating very weak financial strength.
Which company has the best scores?
Both companies have Altman Z-Scores in the safe zone, with AI slightly higher at 3.59 versus GLOB’s 3.05. However, GLOB’s Piotroski Score is stronger at 5 compared to AI’s very weak score of 2, showing better financial health.
Grades Comparison
Here is a comparison of recent grades from reputable grading companies for Globant S.A. and C3.ai, Inc.:
Globant S.A. Grades
The following table summarizes recent grade updates from key financial institutions for Globant S.A.:
| Grading Company | Action | New Grade | Date |
|---|---|---|---|
| Jefferies | Downgrade | Hold | 2025-11-20 |
| UBS | Maintain | Neutral | 2025-11-18 |
| JP Morgan | Maintain | Neutral | 2025-11-14 |
| Needham | Maintain | Buy | 2025-11-14 |
| Canaccord Genuity | Maintain | Hold | 2025-11-14 |
| Goldman Sachs | Maintain | Neutral | 2025-10-09 |
| UBS | Maintain | Neutral | 2025-08-20 |
| Goldman Sachs | Maintain | Neutral | 2025-08-18 |
| Needham | Maintain | Buy | 2025-08-15 |
| JP Morgan | Downgrade | Neutral | 2025-08-15 |
The overall trend for Globant S.A. shows a majority of Hold and Neutral grades, with some Buy ratings maintained, reflecting a cautious but stable outlook by analysts.
C3.ai, Inc. Grades
The following table summarizes recent grade updates from key financial institutions for C3.ai, Inc.:
| Grading Company | Action | New Grade | Date |
|---|---|---|---|
| Canaccord Genuity | Maintain | Hold | 2025-12-04 |
| Wedbush | Maintain | Outperform | 2025-12-04 |
| Needham | Maintain | Hold | 2025-12-04 |
| DA Davidson | Maintain | Underperform | 2025-12-04 |
| UBS | Maintain | Neutral | 2025-09-12 |
| Morgan Stanley | Maintain | Underweight | 2025-09-09 |
| Canaccord Genuity | Maintain | Hold | 2025-09-05 |
| Needham | Maintain | Hold | 2025-09-04 |
| Keybanc | Maintain | Underweight | 2025-09-04 |
| JMP Securities | Maintain | Market Outperform | 2025-09-04 |
C3.ai, Inc.’s grades show a mixed outlook with several Hold and Underweight ratings alongside a few Outperform and Market Outperform grades, indicating divided analyst sentiment.
Which company has the best grades?
Globant S.A. holds a stronger consensus with 17 Buy and 8 Hold ratings versus C3.ai, Inc.’s 6 Buy and 12 Hold ratings. This suggests Globant is viewed more favorably by analysts, potentially indicating better perceived stability or growth prospects for investors.
Strengths and Weaknesses
Here is a comparison of key strengths and weaknesses for Globant S.A. and C3.ai, Inc. based on their most recent financial and operational data:
| Criterion | Globant S.A. | C3.ai, Inc. |
|---|---|---|
| Diversification | Moderate, focused on digital transformation services; no detailed segment revenue available | Moderate, revenue split between License & Service (278M USD) and Professional Services (32M USD) in 2024 |
| Profitability | Neutral net margin (6.86%), ROIC (6.82%) slightly below WACC, slightly unfavorable ROE (8.44%) | Unfavorable profitability with net margin -74.21%, negative ROIC (-36.1%), declining trend |
| Innovation | Steadily growing ROIC trend suggests improving operational efficiency | Declining ROIC trend indicates challenges in innovation pay-off and value creation |
| Global presence | Strong presence in digital services globally | Niche AI market presence but less diversified geographically |
| Market Share | Established player in digital solutions with stable asset turnover (0.76) | Smaller market share indicated by lower asset turnover (0.38) and unfavorable financial ratios |
Key takeaways: Globant shows improving profitability and stable financial health, making it a cautiously favorable choice. C3.ai struggles with profitability and declining returns, posing a higher risk for investors seeking value creation.
Risk Analysis
Below is a comparative risk table for Globant S.A. (GLOB) and C3.ai, Inc. (AI) based on their most recent financial and operational data.
| Metric | Globant S.A. (GLOB) | C3.ai, Inc. (AI) |
|---|---|---|
| Market Risk | Beta 1.20, moderate volatility | Beta 1.96, high volatility |
| Debt level | Low debt-to-equity 0.21, favorable | Very low debt-to-equity 0.01, favorable |
| Regulatory Risk | Moderate, operates globally with tech regulations | Moderate, AI sector scrutiny increasing |
| Operational Risk | Large workforce (31,280), complex service portfolio | Smaller workforce (891), high dependency on tech innovation |
| Environmental Risk | Moderate, technology services with some sustainability focus | Low, primarily software-based operations |
| Geopolitical Risk | Based in Luxembourg, exposed to EU and global markets | US-based with international exposure, subject to US-China tensions |
Globant’s main risks center on market volatility and a relatively high P/E ratio indicating valuation pressure, while it maintains financial stability with low debt and moderate operational complexity. C3.ai faces higher market risk due to its beta near 2 and significant negative profitability metrics, reflecting operational and financial challenges. Its low debt limits financial risk, but operational and geopolitical factors, including AI regulation and tech competition, present considerable impact potential.
Which Stock to Choose?
Globant S.A. (GLOB) shows a favorable income evolution with 15.26% revenue growth in 2024 and a 205.68% net income increase over five years. Its financial ratios are slightly favorable overall, with strong liquidity and low debt, though some profitability metrics are neutral or unfavorable. The company’s rating is very favorable at A-, supported by a safe-zone Altman Z-Score and average Piotroski Score. However, its economic moat is slightly unfavorable, indicating value destruction despite improving profitability.
C3.ai, Inc. (AI) presents mixed income results: 25.27% revenue growth in 2025 contrasts with negative net margins and declining profitability metrics over the period. Its financial ratio evaluation is unfavorable, with debt well controlled but poor profitability and liquidity concerns. The rating is very unfavorable at D+, with a safe Altman Z-Score but a very weak Piotroski Score. The company’s economic moat is very unfavorable, reflecting declining returns and value destruction.
Investors with a risk-tolerant profile seeking growth might see potential in Globant’s improving profitability and stable financial standing, while more risk-averse investors focused on financial stability could view C3.ai’s high liquidity but weaker profitability as a cautionary signal. Overall, Globant’s stronger rating and more favorable income and ratio trends might appear preferable for those emphasizing quality and financial health.
Disclaimer: Investment carries a risk of loss of initial capital. The past performance is not a reliable indicator of future results. Be sure to understand risks before making an investment decision.
Go Further
I encourage you to read the complete analyses of Globant S.A. and C3.ai, Inc. to enhance your investment decisions: