Home > Comparison > Technology > G vs AI
The strategic rivalry between Genpact Limited and C3.ai, Inc. shapes the evolving landscape of the technology sector. Genpact operates as a capital-intensive IT services provider with global business process outsourcing expertise. In contrast, C3.ai focuses on niche, high-margin enterprise AI software solutions. This analysis pits steady service-scale against cutting-edge innovation to identify which trajectory offers superior risk-adjusted returns for a diversified portfolio in 2026.
Table of contents
Companies Overview
Genpact Limited and C3.ai, Inc. stand as pivotal players shaping the future of information technology services.
Genpact Limited: Global Business Process Innovator
Genpact Limited dominates business process outsourcing and IT services worldwide. It generates revenue through comprehensive finance, accounting, supply chain, and transformation services. In 2026, Genpact emphasizes digital solutions and ESG advisory, reinforcing its competitive advantage in integrated service offerings across sectors like banking, healthcare, and manufacturing.
C3.ai, Inc.: Enterprise AI Software Pioneer
C3.ai, Inc. leads in enterprise AI software, enabling customers to design and deploy AI applications. Its revenue streams come from AI platforms and specialized applications for inventory, risk, and maintenance optimization. In 2026, C3.ai focuses on expanding industry-specific AI solutions and deepening strategic partnerships with tech giants like AWS and Microsoft to enhance its AI ecosystem.
Strategic Collision: Similarities & Divergences
Both companies leverage technology to transform enterprise operations but differ in approach. Genpact opts for a service-driven model, blending outsourcing with digital transformation. C3.ai pursues a pure software platform strategy, emphasizing AI infrastructure. Their main battleground lies in optimizing enterprise efficiency through technology. Investors face distinct risk profiles: Genpact offers scale and steady cash flow; C3.ai presents high growth potential with elevated volatility.
Income Statement Comparison
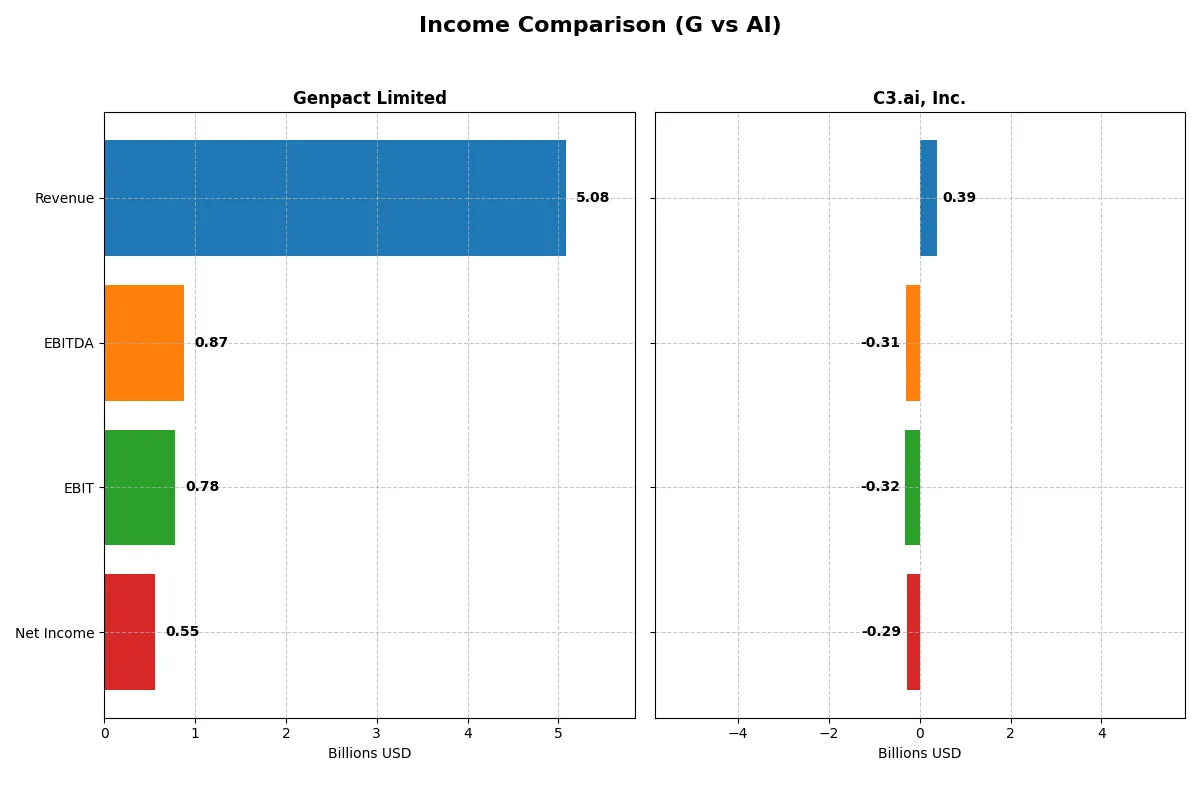
The following data dissects the core profitability and scalability of both corporate engines to reveal who dominates the bottom line:
| Metric | Genpact Limited (G) | C3.ai, Inc. (AI) |
|---|---|---|
| Revenue | 5.08B | 389M |
| Cost of Revenue | 3.25B | 153M |
| Operating Expenses | 1.05B | 560M |
| Gross Profit | 1.83B | 236M |
| EBITDA | 875M | -312M |
| EBIT | 780M | -324M |
| Interest Expense | 50M | 0 |
| Net Income | 552M | -289M |
| EPS | 3.18 | -2.24 |
| Fiscal Year | 2025 | 2025 |
Income Statement Analysis: The Bottom-Line Duel
This income statement comparison will reveal the true operational efficiency and profit-generation of two distinct corporate engines in 2025.
Genpact Limited Analysis
Genpact Limited steadily grows revenue from 4.0B in 2021 to 5.1B in 2025, with net income rising from 369M to 552M. Gross margin holds strong near 36%, and net margin improves favorably to 10.9%. The firm sustains solid operating efficiency, evidenced by consistent EBITDA and EBIT margins, showing disciplined cost control and steady profit momentum.
C3.ai, Inc. Analysis
C3.ai doubles revenue from 183M in 2021 to 389M in 2025, with a robust 25% annual growth. However, it posts a net loss of 289M in 2025 despite a healthy gross margin above 60%. Operating expenses outpace income, driving a negative EBIT margin exceeding -83%. This signals ongoing investment and expansion costs without current profitability.
Margin Power vs. Revenue Scale
Genpact delivers consistent profitability with improving margins and sustainable net income growth. C3.ai impresses with rapid revenue expansion but faces deep operating losses and negative net margins. For investors prioritizing stable returns and margin health, Genpact’s profile offers a clearer fundamental winner over C3.ai’s high-growth yet unprofitable trajectory.
Financial Ratios Comparison
These vital ratios act as a diagnostic tool to expose the underlying fiscal health, valuation premiums, and capital efficiency of the companies compared below:
| Ratios | Genpact Limited (G) | C3.ai, Inc. (AI) |
|---|---|---|
| ROE | 21.7% | -34.4% |
| ROIC | 12.3% | -36.1% |
| P/E | 14.7 | -9.8 |
| P/B | 3.19 | 3.39 |
| Current Ratio | 1.66 | 6.86 |
| Quick Ratio | 1.66 | 6.86 |
| D/E | 0.23 | 0.01 |
| Debt-to-Assets | 9.9% | 0.5% |
| Interest Coverage | 15.3 | 0 |
| Asset Turnover | 0.87 | 0.38 |
| Fixed Asset Turnover | 13.6 | 4.91 |
| Payout ratio | 21.3% | 0 |
| Dividend yield | 1.45% | 0 |
| Fiscal Year | 2025 | 2025 (Apr 30) |
Efficiency & Valuation Duel: The Vital Signs
Ratios act as a company’s DNA, uncovering hidden risks and revealing operational excellence that raw numbers alone cannot show.
Genpact Limited
Genpact posts a robust 21.7% ROE and healthy 10.9% net margin, signaling strong profitability. Its P/E ratio of 14.7 suggests the stock is attractively valued, not stretched. Shareholders benefit from a modest 1.45% dividend yield, complemented by efficient capital allocation reflecting in a 12.3% ROIC above its 7.2% WACC.
C3.ai, Inc.
C3.ai suffers from negative profitability metrics, including a -34.4% ROE and -74.2% net margin, indicating persistent losses. Despite a low P/E ratio of -9.8, this reflects negative earnings rather than cheap valuation. The company pays no dividend, channeling capital aggressively into R&D (58%) and stock-based compensation (59%), aiming for future growth.
Premium Valuation vs. Operational Safety
Genpact offers a superior balance of risk and reward with favorable profitability and valuation metrics. C3.ai’s negative returns and high reinvestment costs elevate risk despite growth potential. Investors seeking operational safety lean toward Genpact, while those favoring growth at higher risk may consider C3.ai’s profile.
Which one offers the Superior Shareholder Reward?
Genpact Limited (G) delivers a modest 1.45% dividend yield with a sustainable payout ratio near 21%, backed by strong free cash flow coverage above 90%. Its consistent buyback programs amplify total returns. Conversely, C3.ai, Inc. (AI) pays no dividends and reports persistent losses, reinvesting heavily in growth and R&D instead. AI’s lack of buybacks and negative margins raise sustainability concerns. I find Genpact’s balanced dividend and buyback approach offers a more attractive and sustainable total return profile for 2026 investors.
Comparative Score Analysis: The Strategic Profile
The radar chart reveals the fundamental DNA and trade-offs of Genpact Limited and C3.ai, Inc., highlighting their core financial strengths and weaknesses:
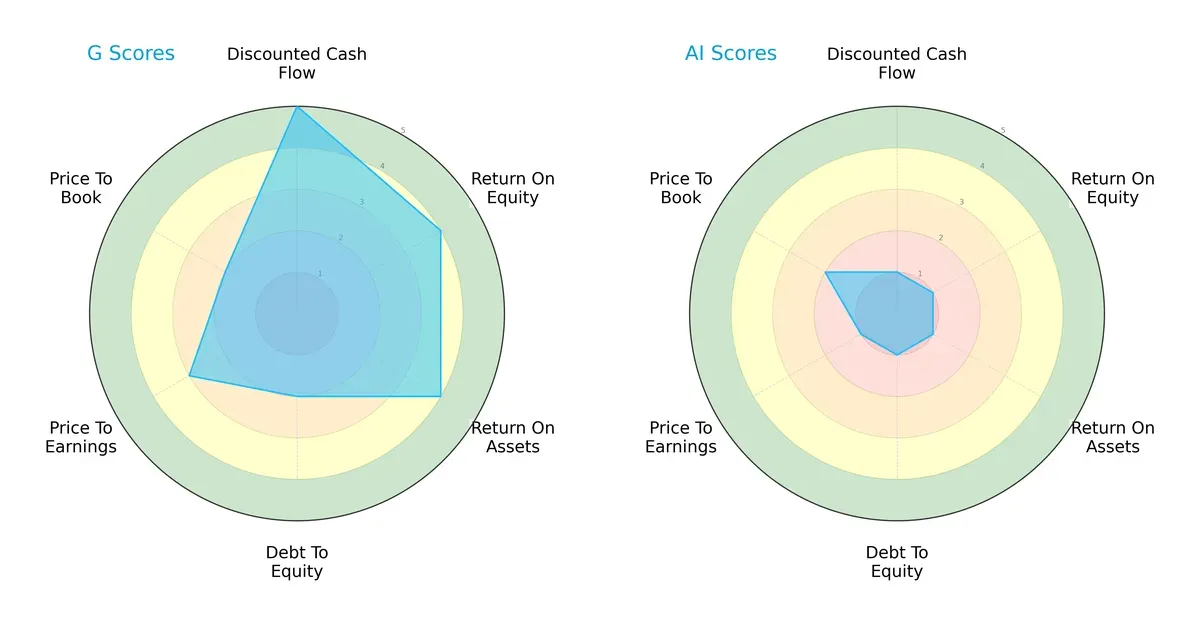
Genpact shows a balanced profile with strong DCF (5), ROE (4), and ROA (4) scores but weaker debt-to-equity (2) and valuation metrics (PE 3, PB 2). C3.ai scores uniformly low, relying on no specific financial edge, reflecting significant challenges. Genpact’s diversified strengths contrast sharply with C3.ai’s broad vulnerabilities.
Bankruptcy Risk: Solvency Showdown
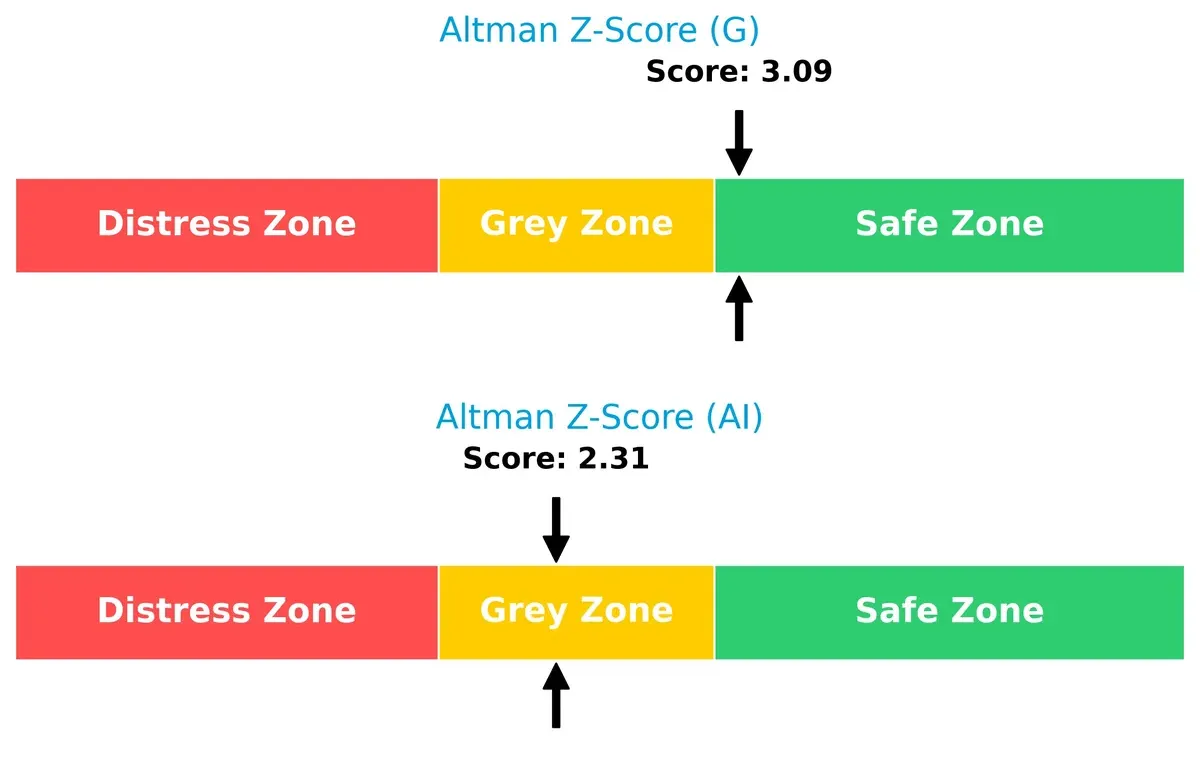
Genpact’s Altman Z-Score of 3.09 places it comfortably in the safe zone. C3.ai’s 2.31 falls into the grey zone, signaling moderate bankruptcy risk in the current economic cycle:
Financial Health: Quality of Operations
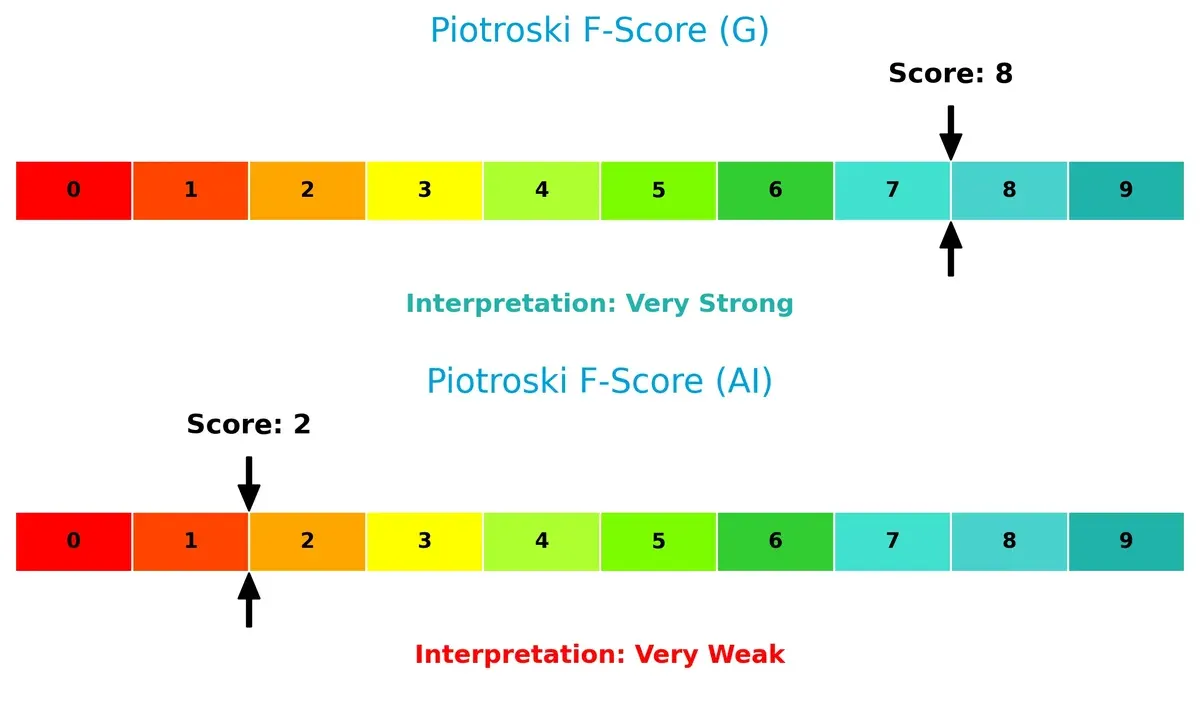
Genpact’s Piotroski F-Score of 8 signals very strong financial health and operational quality. C3.ai’s score of 2 raises red flags, indicating weak internal metrics and potential distress:
How are the two companies positioned?
This section dissects the operational DNA of Genpact and C3.ai by comparing their revenue distribution and internal strengths and weaknesses. The goal is to confront their economic moats to determine which model offers the most resilient, sustainable advantage today.
Revenue Segmentation: The Strategic Mix
This comparison dissects how Genpact Limited and C3.ai, Inc. diversify their income streams and where their primary sector bets lie:
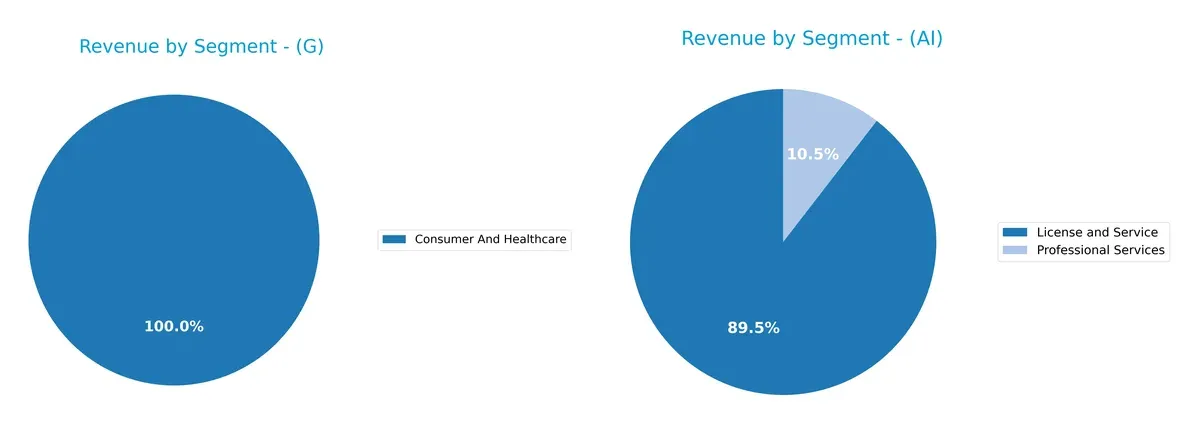
Genpact anchors its revenue in Consumer and Healthcare with $1.7B in 2024, reflecting a concentrated sector focus. Its earlier years show diversification across Business Process Outsourcing and IT Services, but recent data narrows. C3.ai pivots on License and Service revenue at $278M, supplemented by smaller Professional Services. Genpact’s concentration risks contrast with C3.ai’s clearer software ecosystem lock-in, highlighting distinct strategic bets in infrastructure versus AI-enabled services.
Strengths and Weaknesses Comparison
This table compares the Strengths and Weaknesses of Genpact Limited and C3.ai, Inc.:
Genpact Limited Strengths
- Diversified revenue across multiple industry segments
- Strong profitability with net margin 10.88% and ROE 21.67%
- Favorable capital structure with low debt-to-assets at 9.91%
- Robust global presence, especially in India and Americas
- High fixed asset turnover of 13.65
- Consistent positive financial ratios, indicating stable operations
C3.ai, Inc. Strengths
- Low debt levels with debt-to-assets at 0.47%
- Favorable quick ratio of 6.86, indicating strong liquidity
- Presence in North America, EMEA, and Asia Pacific regions
- Growing License and Service revenue segment
- Favorable fixed asset turnover of 4.91
- Positive price-to-earnings status despite negative earnings
Genpact Limited Weaknesses
- Unfavorable price-to-book ratio at 3.19
- Neutral asset turnover at 0.87, indicating moderate efficiency
- Dividend yield only neutral at 1.45%
- Heavy reliance on India for revenue concentration
- Limited innovation metrics provided
C3.ai, Inc. Weaknesses
- Negative profitability metrics with net margin -74.21% and ROE -34.44%
- Unfavorable weighted average cost of capital at 13.17%
- Poor interest coverage at 0, signaling risk in servicing debt
- Unfavorable asset turnover of 0.38, showing low operational efficiency
- No dividend yield
- Unfavorable current ratio despite strong quick ratio
Overall, Genpact demonstrates solid profitability and diversified operations with stable financial health, benefiting from a broad geographic footprint. C3.ai faces significant profitability and efficiency challenges but maintains liquidity and low leverage, reflecting a different risk profile and strategic position in its growth phase.
The Moat Duel: Analyzing Competitive Defensibility
A structural moat is the only barrier protecting long-term profits from relentless competitive erosion. Let’s dissect the moats of two tech service firms:
Genpact Limited: Cost Advantage with Operational Excellence
Genpact’s moat stems from deep process expertise and scale in outsourcing, yielding a robust 5% ROIC above WACC and stable 15% EBIT margins. Expansion into ESG and digital services in 2026 could deepen efficiency-driven dominance.
C3.ai, Inc.: Innovation-Fueled Network Effects
C3.ai relies on advanced AI platform network effects, yet its ROIC trends sharply negative, reflecting heavy R&D and sales costs. Rapid revenue growth hints at future scale, but profitability remains distant in 2026’s competitive AI landscape.
The Verdict: Cost Leadership vs. Innovation Gamble
Genpact’s wide moat and rising ROIC outclass C3.ai’s eroding value and volatile margins. Operational scale shields Genpact’s market share; C3.ai must prove profitable innovation to sustain its competitive edge.
Which stock offers better returns?
Stock prices of Genpact Limited and C3.ai, Inc. have shown contrasting dynamics over the past year, with notable shifts in trend direction and trading volumes influencing their market behavior.
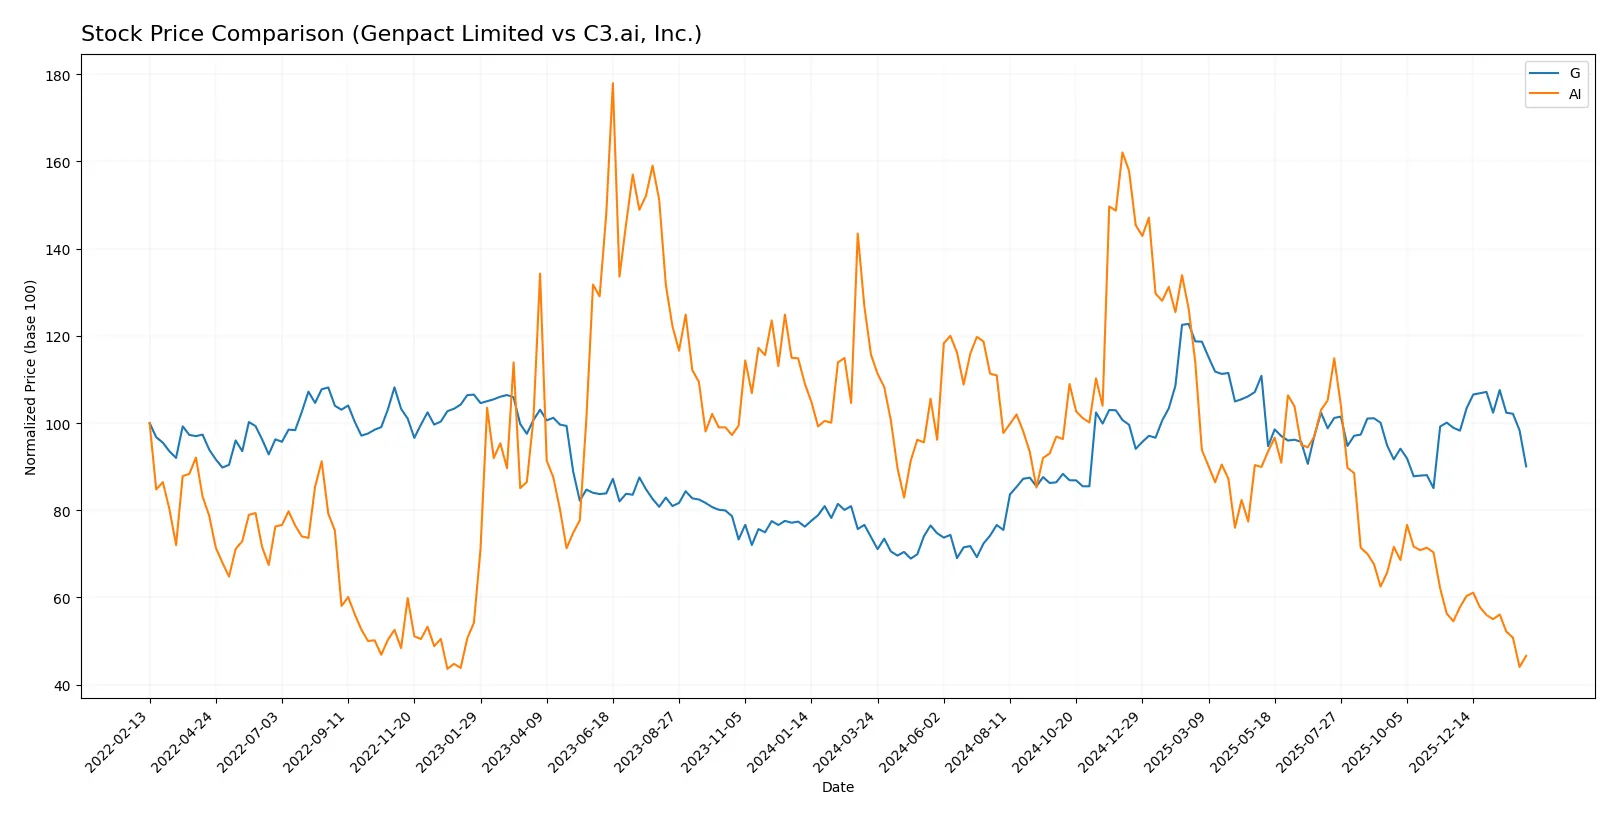
Trend Comparison
Genpact Limited’s stock rose 21.95% over the past 12 months, indicating a bullish trend. The price momentum decelerated, peaking at 55.05 and bottoming at 30.9, with moderate volatility (6.04 std deviation).
C3.ai, Inc.’s stock dropped 59.72% in the same period, confirming a bearish trend. The decline decelerated but remained steep, with prices ranging from 40.52 down to 11.01 and slightly higher volatility (6.5 std deviation).
Genpact Limited outperformed C3.ai, Inc. by a wide margin, delivering the highest market returns despite recent short-term weakness.
Target Prices
Analysts present a moderate upside potential for both Genpact Limited and C3.ai, Inc. based on current consensus targets.
| Company | Target Low | Target High | Consensus |
|---|---|---|---|
| Genpact Limited | 42 | 50 | 46 |
| C3.ai, Inc. | 10 | 16 | 12.33 |
Genpact’s consensus target of 46 suggests a 14% upside from its 40.39 stock price, reflecting steady confidence. C3.ai’s 12.33 target implies modest upside, about 6%, indicating cautious optimism amid volatility.

Don’t Let Luck Decide Your Entry Point
Optimize your entry points with our advanced ProRealTime indicators. You’ll get efficient buy signals with precise price targets for maximum performance. Start outperforming now!
How do institutions grade them?
Genpact Limited Grades
The following table summarizes recent institutional grades for Genpact Limited:
| Grading Company | Action | New Grade | Date |
|---|---|---|---|
| Needham | Maintain | Buy | 2026-02-06 |
| JP Morgan | Maintain | Neutral | 2025-08-20 |
| Needham | Maintain | Buy | 2025-08-08 |
| Mizuho | Maintain | Neutral | 2025-07-01 |
| Needham | Maintain | Buy | 2025-06-30 |
| TD Cowen | Maintain | Buy | 2025-06-27 |
| Needham | Maintain | Buy | 2025-05-08 |
| Baird | Maintain | Neutral | 2025-05-08 |
| Mizuho | Maintain | Neutral | 2025-02-10 |
| Needham | Maintain | Buy | 2025-02-07 |
C3.ai, Inc. Grades
Below are recent institutional grades for C3.ai, Inc.:
| Grading Company | Action | New Grade | Date |
|---|---|---|---|
| Canaccord Genuity | Maintain | Hold | 2025-12-04 |
| DA Davidson | Maintain | Underperform | 2025-12-04 |
| Wedbush | Maintain | Outperform | 2025-12-04 |
| Needham | Maintain | Hold | 2025-12-04 |
| UBS | Maintain | Neutral | 2025-09-12 |
| Morgan Stanley | Maintain | Underweight | 2025-09-09 |
| Canaccord Genuity | Maintain | Hold | 2025-09-05 |
| Needham | Maintain | Hold | 2025-09-04 |
| UBS | Maintain | Neutral | 2025-09-04 |
| JMP Securities | Maintain | Market Outperform | 2025-09-04 |
Which company has the best grades?
Genpact Limited consistently receives Buy and Neutral ratings, signaling stable confidence. C3.ai shows mixed ratings from Hold to Outperform, with some Underperform grades. Investors may interpret Genpact’s steadier Buy consensus as comparatively stronger institutional endorsement.
Risks specific to each company
The following categories identify critical pressure points and systemic threats facing both firms in the 2026 market environment:
1. Market & Competition
Genpact Limited
- Established player in IT services with diversified segments reduces exposure to any single market disruption.
C3.ai, Inc.
- Faces intense competition in enterprise AI, a rapidly evolving field with many well-funded rivals.
2. Capital Structure & Debt
Genpact Limited
- Maintains low debt-to-equity of 0.23 and strong interest coverage at 15.72, signaling financial stability.
C3.ai, Inc.
- Virtually no debt but zero interest coverage raises concerns about operational cash flow sufficiency.
3. Stock Volatility
Genpact Limited
- Beta of 0.735 reflects lower volatility than the market, supporting defensive positioning.
C3.ai, Inc.
- High beta at 1.999 indicates significant share price swings, amplifying risk for investors.
4. Regulatory & Legal
Genpact Limited
- Operates globally with exposure to varying data privacy regulations but benefits from established compliance practices.
C3.ai, Inc.
- Emerging AI regulatory frameworks pose uncertain legal risks in key markets like the US and EU.
5. Supply Chain & Operations
Genpact Limited
- Diverse global operations mitigate supply chain disruptions; asset turnover at 0.87 is stable.
C3.ai, Inc.
- Asset turnover low at 0.38, showing operational inefficiency and potential scale-up challenges.
6. ESG & Climate Transition
Genpact Limited
- Offers ESG services, suggesting alignment with growing sustainability demands from clients and regulators.
C3.ai, Inc.
- Limited public ESG initiatives increase exposure to reputational and regulatory risks.
7. Geopolitical Exposure
Genpact Limited
- Headquarters in Bermuda with operations in Asia, Americas, and Europe exposes it to geopolitical risks but also diversification benefits.
C3.ai, Inc.
- US-based with international reach; geopolitical tensions could affect cross-border AI technology deployment.
Which company shows a better risk-adjusted profile?
Genpact faces lower market volatility and stronger financial stability, reflected in a favorable Altman Z-score (3.09) and a very strong Piotroski score (8). Conversely, C3.ai’s operational inefficiencies, negative profitability, and weak financial health put it in a grey zone with a Piotroski score of 2. Genpact’s diversified business model and solid capital structure provide a superior risk-adjusted profile. The sharp negative margins and high beta of C3.ai highlight its elevated risk in a volatile AI market.
Final Verdict: Which stock to choose?
Genpact Limited’s superpower lies in its consistent value creation and operational efficiency. It sustains a competitive moat with growing ROIC well above WACC, signaling disciplined capital allocation and strong profitability. A point of vigilance is its slightly stretched balance sheet metrics, which merit monitoring. This stock fits well within an Aggressive Growth portfolio seeking steady, quality expansion.
C3.ai, Inc. offers a strategic moat through its cutting-edge AI solutions and strong revenue growth, underpinning its innovative edge in a fast-evolving market. Relative to Genpact, it presents a riskier profile due to negative profitability and value destruction signs, but its high current ratio suggests ample liquidity. It suits a GARP investor willing to balance growth potential with valuation discipline.
If you prioritize sustainable profitability and proven capital efficiency, Genpact outshines with better stability and value creation. However, if you seek exposure to high-growth AI innovation and can tolerate volatility, C3.ai offers superior growth prospects despite financial headwinds. Each presents a distinct analytical scenario tailored to specific investor risk appetites and strategic goals.
Disclaimer: Investment carries a risk of loss of initial capital. The past performance is not a reliable indicator of future results. Be sure to understand risks before making an investment decision.
Go Further
I encourage you to read the complete analyses of Genpact Limited and C3.ai, Inc. to enhance your investment decisions: