Home > Comparison > Technology > IT vs AI
The strategic rivalry between Gartner, Inc. and C3.ai, Inc. shapes the evolving landscape of technology services. Gartner operates as a capital-intensive research and advisory powerhouse, delivering subscription-based insights and consulting globally. In contrast, C3.ai focuses on high-growth enterprise AI software with scalable platforms and specialized applications. This analysis will assess which company’s business model and growth strategy present the superior risk-adjusted potential for a diversified portfolio in the technology sector.

Table of contents
Companies Overview
Gartner and C3.ai stand as key innovators shaping the evolving information technology services landscape.
Gartner, Inc.: Market Leader in IT Research & Advisory
Gartner dominates as a research and advisory powerhouse in IT services. It generates revenue mainly through subscription-based research, conferences, and consulting solutions. In 2026, its focus remains on delivering actionable insights to optimize IT costs and drive digital transformation for enterprise clients worldwide.
C3.ai, Inc.: Enterprise AI Software Pioneer
C3.ai leads in enterprise artificial intelligence software development. Its core revenue stems from a platform enabling companies to build and deploy AI applications across industries. Strategic emphasis in 2026 lies in expanding AI-driven solutions for supply chain, predictive maintenance, and customer management, while leveraging partnerships with tech giants.
Strategic Collision: Similarities & Divergences
Both firms operate in information technology services but diverge sharply in approach: Gartner relies on trusted research and advisory, whereas C3.ai pursues cutting-edge AI software innovation. Their primary battleground is enterprise IT transformation, with Gartner focusing on insight delivery and C3.ai on AI application deployment. Investors face contrasting profiles—stable, research-driven growth versus high-beta, technology-driven disruption.
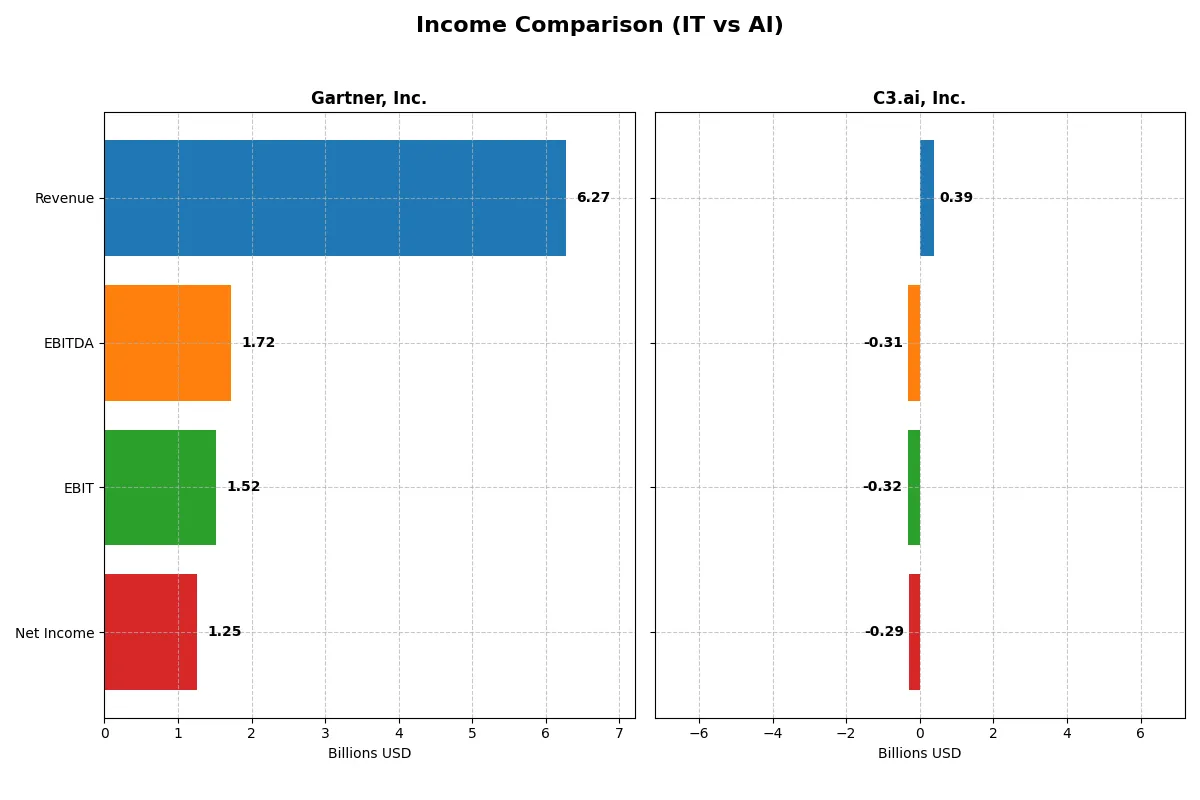
Income Statement Comparison
The following data dissects the core profitability and scalability of both corporate engines to reveal who dominates the bottom line:
| Metric | Gartner, Inc. (IT) | C3.ai, Inc. (AI) |
|---|---|---|
| Revenue | 6.27B | 389M |
| Cost of Revenue | 2.02B | 153M |
| Operating Expenses | 3.09B | 560M |
| Gross Profit | 4.24B | 236M |
| EBITDA | 1.72B | -312M |
| EBIT | 1.52B | -324M |
| Interest Expense | 131M | 0 |
| Net Income | 1.25B | -289M |
| EPS | 16.12 | -2.24 |
| Fiscal Year | 2024 | 2025 |
Income Statement Analysis: The Bottom-Line Duel
This income statement comparison reveals which company operates its business more efficiently and delivers stronger profitability.
Gartner, Inc. Analysis
Gartner’s revenue climbed steadily from 4.1B in 2020 to 6.3B in 2024, with net income surging from 267M to 1.25B. Gross margin remains robust at 67.7%, while net margin improved to a healthy 20%. The 2024 figures show accelerating profitability, driven by solid operational leverage and expanding earnings per share.
C3.ai, Inc. Analysis
C3.ai’s revenue increased rapidly from 183M in 2021 to 389M in 2025, yet it remains unprofitable with a net loss of 289M in 2025. Gross margin holds at a decent 60.6%, but EBIT and net margins are deeply negative at -83% and -74%, respectively. Despite revenue momentum, losses persist, reflecting heavy investment and operating inefficiencies.
Profitability Strength vs. Growth Struggles
Gartner outshines with consistent revenue growth, expanding margins, and strong bottom-line gains, showcasing disciplined capital allocation. C3.ai delivers impressive top-line growth but struggles to translate it into profits, burdened by high expenses. For investors prioritizing financial health and sustainable earnings, Gartner’s profile offers clearer fundamental strength.
Financial Ratios Comparison
These vital ratios act as a diagnostic tool to expose the underlying fiscal health, valuation premiums, and capital efficiency of the companies compared below:
| Ratios | Gartner, Inc. (IT) | C3.ai, Inc. (AI) |
|---|---|---|
| ROE | 92.2% | -34.4% |
| ROIC | 22.4% | -36.1% |
| P/E | 30.1 | -9.8 |
| P/B | 27.7 | 3.4 |
| Current Ratio | 1.06 | 6.86 |
| Quick Ratio | 1.06 | 6.86 |
| D/E | 2.13 | 0.006 |
| Debt-to-Assets | 34.0% | 0.47% |
| Interest Coverage | 8.82 | 0 |
| Asset Turnover | 0.73 | 0.38 |
| Fixed Asset Turnover | 12.53 | 4.91 |
| Payout ratio | 0 | 0 |
| Dividend yield | 0 | 0 |
| Fiscal Year | 2024 | 2025 |
Efficiency & Valuation Duel: The Vital Signs
Financial ratios act as a company’s DNA, uncovering hidden risks and revealing operational excellence critical for investment decisions.
Gartner, Inc.
Gartner displays stellar profitability with a 92.24% ROE and a robust 20% net margin, signaling operational efficiency. Its valuation appears stretched, with a P/E of 30.06 and a P/B of 27.73, above typical sector averages. The firm does not pay dividends, opting instead to reinvest earnings to sustain growth and innovation.
C3.ai, Inc.
C3.ai suffers from weak profitability, posting a negative 34.44% ROE and a steep -74.21% net margin, reflecting ongoing losses. Despite a negative P/E, its P/B ratio of 3.39 is moderate, but operational inefficiencies persist. The company does not distribute dividends, aggressively reinvesting in R&D and growth, evident in high SG&A and R&D expenses.
Profitability Strength vs. Growth Challenges
Gartner offers a compelling balance of high returns and operational strength, though at a premium valuation. C3.ai struggles with profitability and cash flow but invests heavily in growth. Investors seeking stable operational performance may favor Gartner, while those targeting growth with high risk might consider C3.ai.
Which one offers the Superior Shareholder Reward?
Gartner, Inc. (IT) and C3.ai, Inc. (AI) both offer distinct shareholder reward strategies. Gartner pays no dividends, focusing on robust free cash flow (FCF) generation of $17.8/share (2024) and consistent buybacks, supporting price-to-FCF ratios near 27x. C3.ai also pays no dividends but suffers negative net margins and free cash flow losses, reflecting reinvestment in growth and R&D. Its current ratio above 6 shows strong liquidity but weak operating cash flow signals risk. Gartner’s conservative leverage (debt-to-assets ~34%) contrasts with C3.ai’s negligible debt but negative earnings. I judge Gartner offers a more sustainable and attractive total return profile in 2026, balancing strong FCF, prudent capital allocation, and disciplined buyback programs. C3.ai’s aggressive growth comes with elevated risk and lacks immediate shareholder rewards.
Comparative Score Analysis: The Strategic Profile
The radar chart reveals the fundamental DNA and trade-offs of Gartner, Inc. and C3.ai, Inc., highlighting their financial strengths and weaknesses:
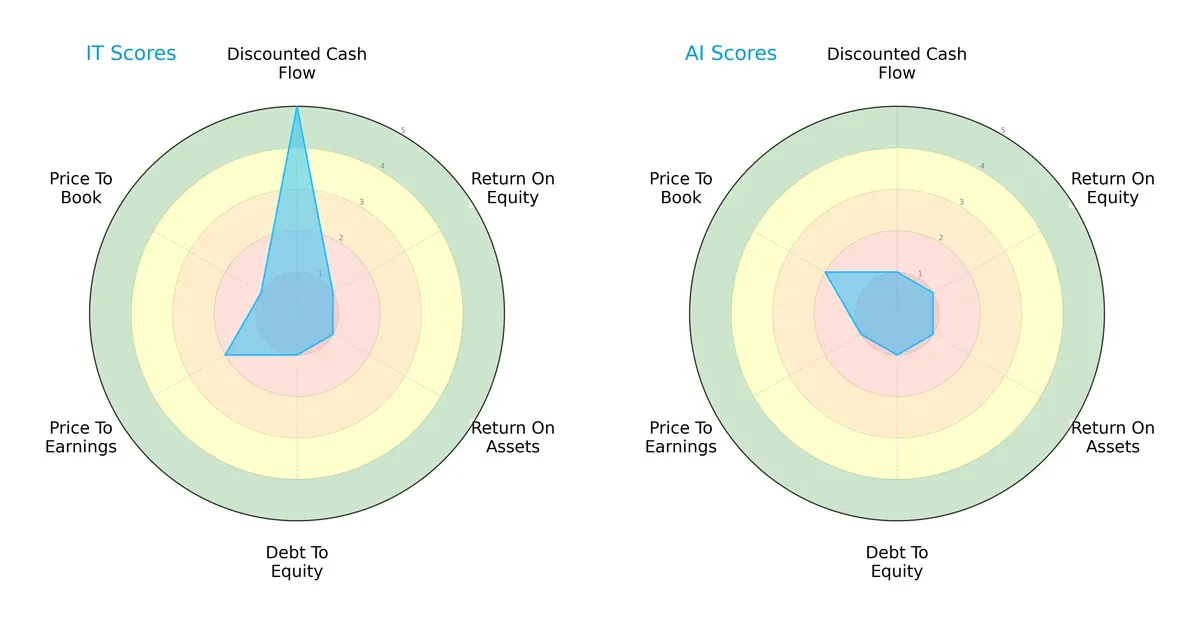
Gartner, Inc. shows strength in discounted cash flow (DCF) with a score of 5, signaling undervaluation potential. However, it struggles with profitability and leverage, scoring 1 in ROE, ROA, and Debt/Equity. C3.ai, Inc. presents a uniformly weak profile, with all scores at 1 except for price-to-book at 2. Gartner has a more balanced advantage in valuation metrics, while C3.ai relies on a slight edge in price-to-book valuation.
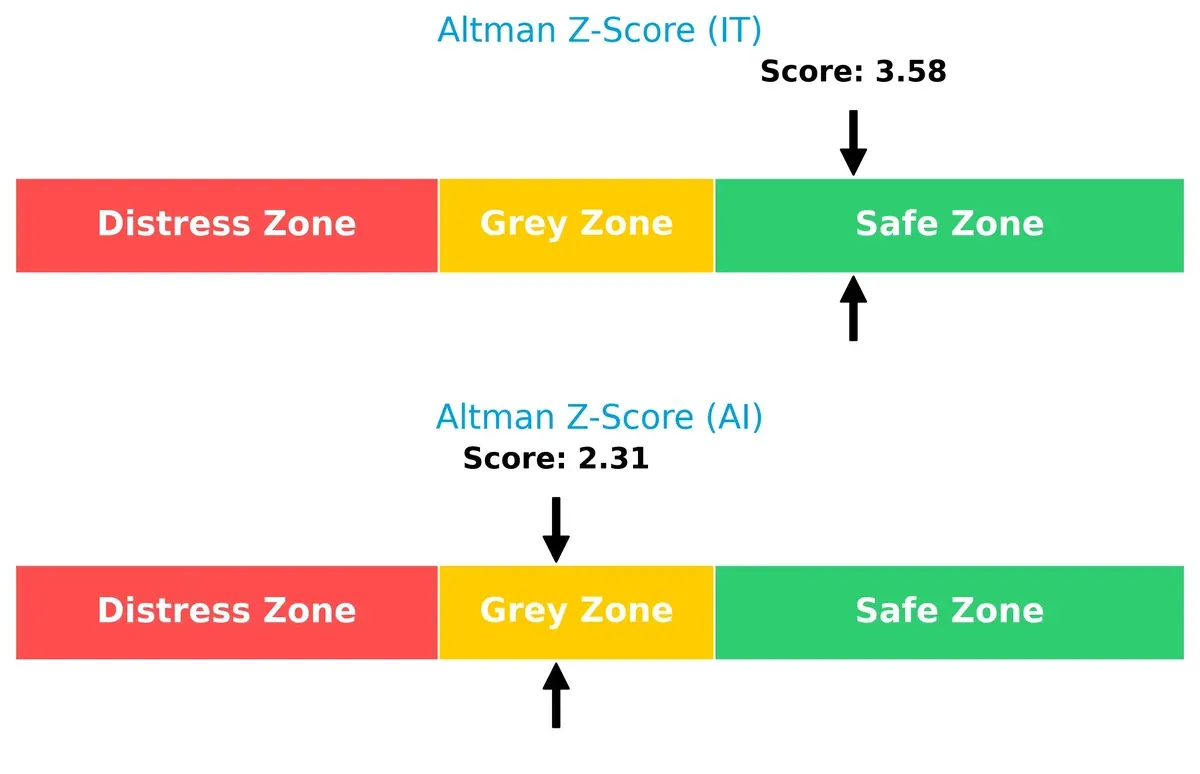
Bankruptcy Risk: Solvency Showdown
Gartner’s Altman Z-Score of 3.58 places it firmly in the safe zone, indicating strong resilience against bankruptcy. C3.ai’s score of 2.31 lands in the grey zone, signaling moderate financial distress risk in this cycle:
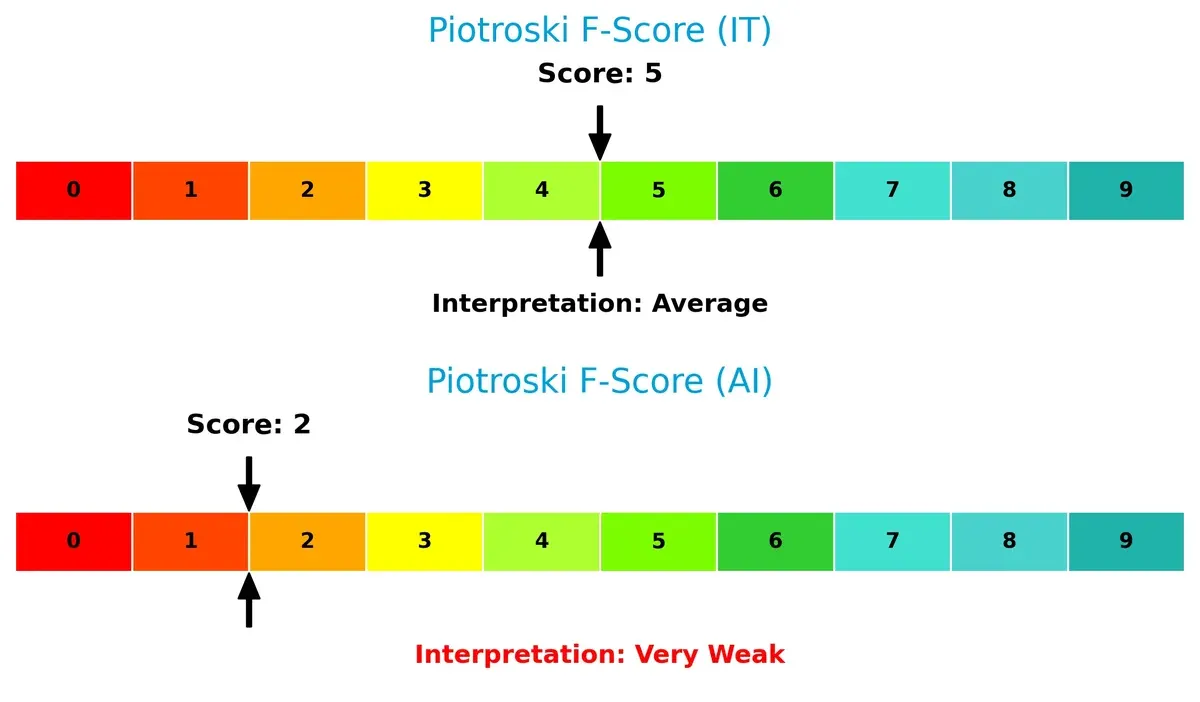
Financial Health: Quality of Operations
Gartner’s Piotroski F-Score of 5 indicates average financial health with no immediate red flags. C3.ai scores a weak 2, suggesting significant internal operational risks and financial weaknesses:
How are the two companies positioned?
This section dissects the operational DNA of Gartner and C3.ai by comparing revenue distribution and internal dynamics of strengths and weaknesses. The goal is to confront their economic moats and identify which business model offers the most resilient, sustainable competitive advantage today.
Revenue Segmentation: The Strategic Mix
This visual comparison dissects how Gartner, Inc. and C3.ai, Inc. diversify their income streams and reveals each firm’s primary sector bets:
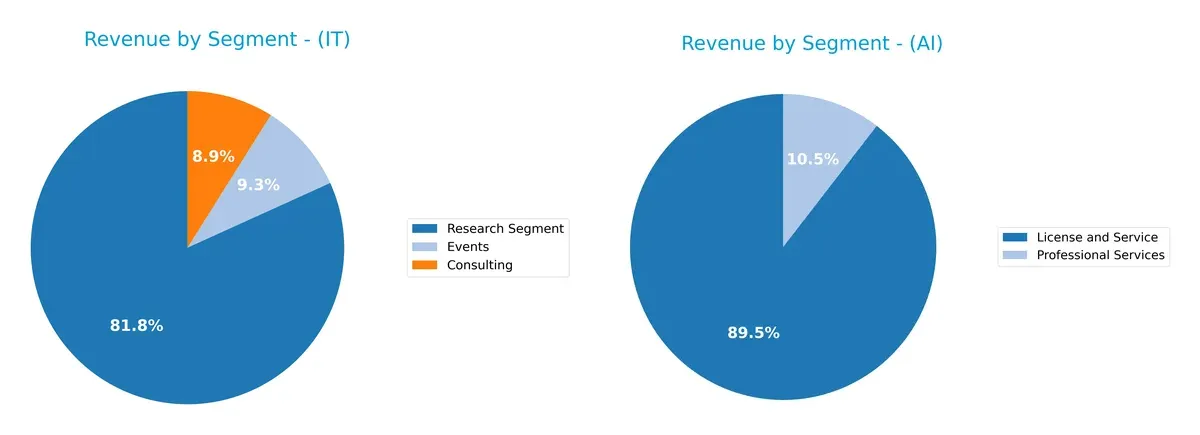
Gartner’s revenue anchors heavily on its Research Segment with $5.13B in 2024, dwarfing Consulting ($559M) and Events ($583M). This concentration suggests deep ecosystem lock-in in research and advisory services. Conversely, C3.ai pivots on License and Service at $278M, supplemented modestly by Professional Services ($32M), indicating a narrower but focused SaaS model. Gartner’s diversification across consulting and events reduces risk, while C3.ai relies more on a single dominant segment, exposing it to market shifts in AI licensing.
Strengths and Weaknesses Comparison
This table compares the Strengths and Weaknesses of Gartner, Inc. and C3.ai, Inc.:
Gartner, Inc. Strengths
- Diversified revenue across Consulting, Events, and Research segments
- Strong profitability with 20% net margin and 92% ROE
- Favorable ROIC vs WACC indicating efficient capital use
- Solid global presence with significant US, EMEA, and other international sales
- High fixed asset turnover showing operational efficiency
C3.ai, Inc. Strengths
- High current and quick ratios indicate strong short-term liquidity
- Very low debt to equity and debt to assets ratios show conservative leverage
- Favorable fixed asset turnover supports efficient asset usage
- Positive PE ratio suggests some market valuation confidence despite losses
Gartner, Inc. Weaknesses
- High price-to-book and price-to-earnings ratios may imply overvaluation risk
- Elevated debt-to-equity ratio suggests higher financial leverage
- Zero dividend yield may deter income-focused investors
C3.ai, Inc. Weaknesses
- Negative profitability metrics with large net margin and ROE losses
- Unfavorable weighted average cost of capital above ROIC signals capital inefficiency
- Weak interest coverage raises concerns about debt servicing
- Low asset turnover hints at underutilized assets
- Low revenue diversification concentrated mainly in License and Service
Gartner’s strengths lie in diversified revenue streams and solid profitability, supporting a sustainable competitive position. C3.ai’s liquidity and low leverage stand out, but its significant profitability deficits and market valuation challenges highlight strategic execution risks.
The Moat Duel: Analyzing Competitive Defensibility
A structural moat shields long-term profits from competitive pressure and market erosion. Without it, profits quickly vanish. Let’s examine the moats of two tech firms:
Gartner, Inc.: Subscription-Based Expertise Moat
Gartner’s moat centers on intangible assets—trusted research, expert networks, and premium subscriptions. This drives a high ROIC above WACC by 14.6%, reflecting durable value creation. Expansion into consulting and conferences deepens this moat in 2026.
C3.ai, Inc.: Innovation-Driven Platform Moat
C3.ai relies on cutting-edge AI software and strategic partnerships. Unlike Gartner’s stable subscription model, C3.ai’s declining ROIC signals weakening profitability. However, rapid revenue growth and AI market expansion offer potential if profitability improves.
Moat Strength Showdown: Durable Expertise vs. Emerging Innovation
Gartner’s wide moat, backed by strong ROIC growth and consistent profitability, outmatches C3.ai’s fragile position. Gartner is better equipped to defend market share amid intensifying competition in 2026.
Which stock offers better returns?
The past year reveals sharp declines for both stocks, with Gartner, Inc. showing deeper losses and wider price swings compared to C3.ai, Inc.’s more moderate downtrend.
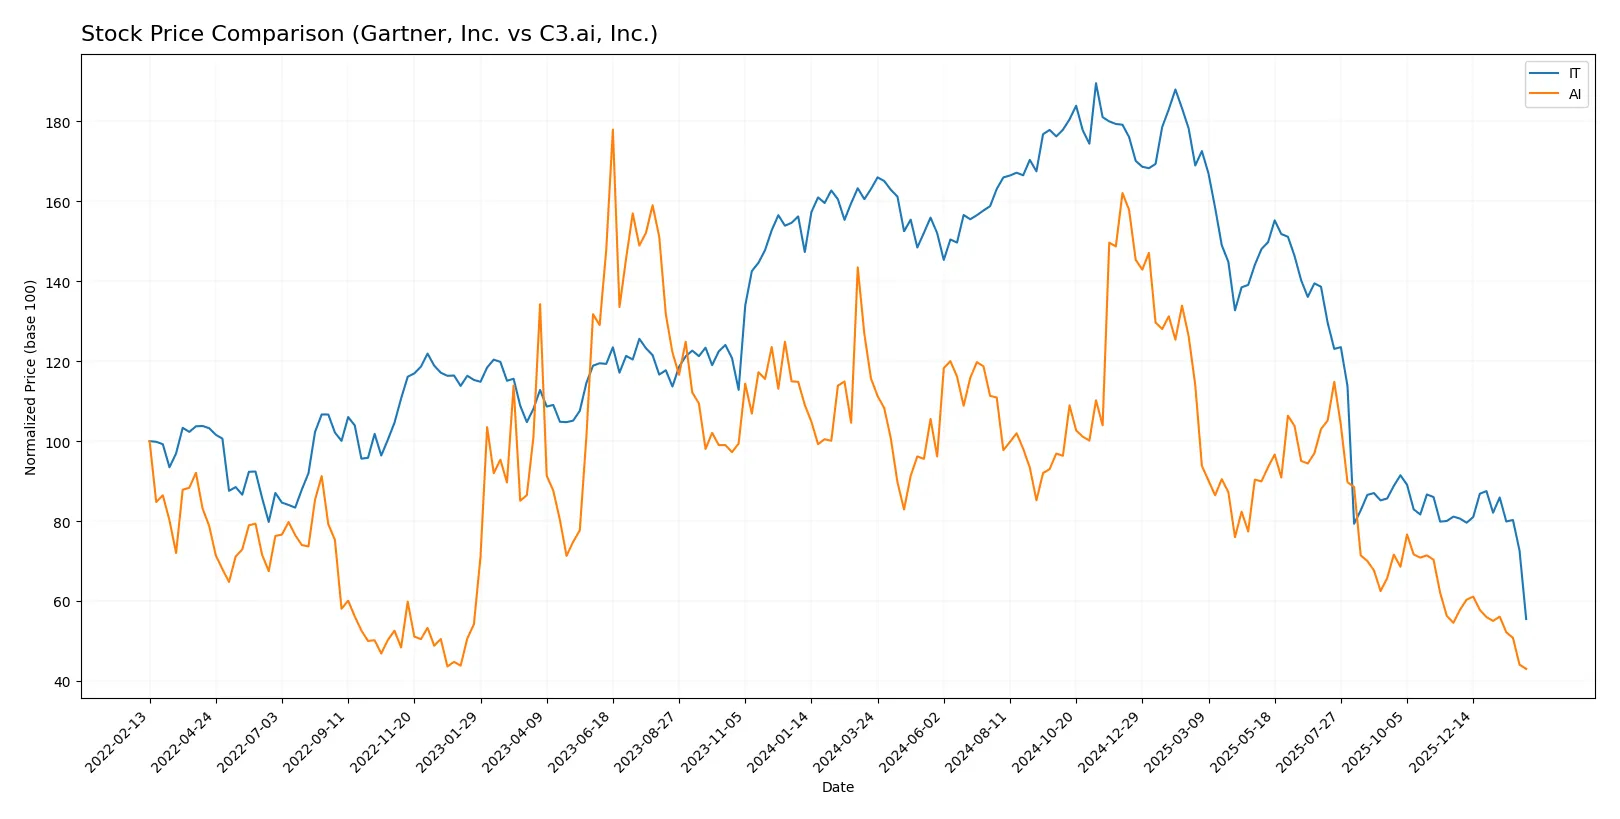
Trend Comparison
Gartner, Inc. (IT) experienced a bearish trend with a 66% price drop over 12 months, marked by decelerating losses and significant volatility, ranging from 547.4 to 160.16.
C3.ai, Inc. (AI) also faced a bearish trend, declining 63% over the same period, with decelerating downside momentum and much lower volatility, fluctuating between 40.52 and 10.75.
Comparing trends, Gartner’s stock showed greater losses and volatility, while C3.ai delivered a slightly less severe decline, thus outperforming Gartner in market performance.
Target Prices
Analysts provide a clear consensus on target prices for Gartner, Inc. and C3.ai, Inc.
| Company | Target Low | Target High | Consensus |
|---|---|---|---|
| Gartner, Inc. | 231 | 300 | 265 |
| C3.ai, Inc. | 10 | 16 | 12.33 |
The consensus target for Gartner at $265 suggests nearly 65% upside from its current $160 stock price. C3.ai’s target near $12.33 implies modest upside versus its $10.75 share price, reflecting cautious optimism.

Don’t Let Luck Decide Your Entry Point
Optimize your entry points with our advanced ProRealTime indicators. You’ll get efficient buy signals with precise price targets for maximum performance. Start outperforming now!
How do institutions grade them?
Below is a comparison of the recent institutional grades for Gartner, Inc. and C3.ai, Inc.:
Gartner, Inc. Grades
The following table shows the latest grades assigned by major grading firms to Gartner, Inc.:
| Grading Company | Action | New Grade | Date |
|---|---|---|---|
| UBS | maintain | Neutral | 2026-01-09 |
| Morgan Stanley | maintain | Equal Weight | 2025-12-17 |
| BMO Capital | maintain | Market Perform | 2025-11-06 |
| Goldman Sachs | maintain | Buy | 2025-11-05 |
| Barclays | maintain | Equal Weight | 2025-11-05 |
| Wells Fargo | maintain | Underweight | 2025-11-05 |
C3.ai, Inc. Grades
The following table shows the latest grades assigned by major grading firms to C3.ai, Inc.:
| Grading Company | Action | New Grade | Date |
|---|---|---|---|
| Wedbush | maintain | Outperform | 2025-12-04 |
| DA Davidson | maintain | Underperform | 2025-12-04 |
| Canaccord Genuity | maintain | Hold | 2025-12-04 |
| Needham | maintain | Hold | 2025-12-04 |
| UBS | maintain | Neutral | 2025-09-12 |
| Morgan Stanley | maintain | Underweight | 2025-09-09 |
Which company has the best grades?
Gartner, Inc. has a balanced mix of Neutral to Buy ratings, while C3.ai’s grades vary widely from Outperform to Underperform. This suggests Gartner has more consistent institutional confidence, potentially reducing volatility for investors.
Risks specific to each company
The following categories identify the critical pressure points and systemic threats facing both firms in the 2026 market environment:
1. Market & Competition
Gartner, Inc.
- Established leader in IT advisory with broad global reach and stable subscription revenue.
C3.ai, Inc.
- Emerging AI software firm facing intense competition and struggling with profitability.
2. Capital Structure & Debt
Gartner, Inc.
- Moderate debt level with a debt/equity ratio of 2.13 and interest coverage of 11.59.
C3.ai, Inc.
- Minimal debt (D/E 0.01) but no interest coverage, reflecting weak earnings and financial stress.
3. Stock Volatility
Gartner, Inc.
- Beta near 1.04 indicates market-level volatility, with past price drops raising concerns.
C3.ai, Inc.
- High beta at 2.0 signals elevated volatility and risk common in emerging tech firms.
4. Regulatory & Legal
Gartner, Inc.
- Operates in multiple jurisdictions with regulatory compliance but no major legal issues reported.
C3.ai, Inc.
- Faces regulatory scrutiny typical of AI sector innovations and data privacy challenges.
5. Supply Chain & Operations
Gartner, Inc.
- Relies on stable information delivery and consulting services, less exposed to physical supply chain risks.
C3.ai, Inc.
- Potential risks in software development cycles and partner dependency, especially in complex AI deployments.
6. ESG & Climate Transition
Gartner, Inc.
- Established ESG policies expected given size; moderate exposure to climate regulation impacts.
C3.ai, Inc.
- Smaller scale but growing ESG pressures related to AI ethics and energy consumption in computing.
7. Geopolitical Exposure
Gartner, Inc.
- Broad international presence exposes it to geopolitical risks but with diversified risk management.
C3.ai, Inc.
- Also global but more sensitive to trade tensions affecting technology exports and partnerships.
Which company shows a better risk-adjusted profile?
Gartner’s most impactful risk lies in moderate leverage and valuation pressure, while C3.ai’s critical risk is sustained unprofitability and financial distress. Gartner shows a stronger risk-adjusted profile, supported by a safe Altman Z-score of 3.58 versus C3.ai’s 2.31 in the grey zone. The recent 21% price decline for Gartner reflects market concerns but contrasts with C3.ai’s persistent negative margins and weak Piotroski score, underscoring its higher risk stance.
Final Verdict: Which stock to choose?
Gartner, Inc. reveals a superpower in its consistent value creation, demonstrated by a robust ROIC far exceeding its WACC. This durability signals a strong competitive moat and operational efficiency. A point of vigilance remains its relatively high debt-to-equity ratio. It suits portfolios targeting steady, long-term growth with moderate risk tolerance.
C3.ai, Inc. commands a strategic moat rooted in rapid revenue growth and aggressive R&D investment, positioning it as a potential disruptor in AI. Its low leverage and strong liquidity offer safety compared to Gartner, yet ongoing value destruction and declining profitability mark clear risks. It aligns with high-risk, high-reward growth-at-a-reasonable-price (GARP) portfolios.
If you prioritize durable profitability and capital efficiency, Gartner outshines as the compelling choice due to its proven value creation and stable financial footing. However, if you seek aggressive growth with a tolerance for volatility, C3.ai offers superior upside potential through innovation and market expansion despite current financial headwinds.
Disclaimer: Investment carries a risk of loss of initial capital. The past performance is not a reliable indicator of future results. Be sure to understand risks before making an investment decision.
Go Further
I encourage you to read the complete analyses of Gartner, Inc. and C3.ai, Inc. to enhance your investment decisions: