In the rapidly evolving technology services sector, Fiserv, Inc. and C3.ai, Inc. represent two distinct yet overlapping approaches to innovation and market impact. Fiserv specializes in comprehensive payment and financial services technology, while C3.ai focuses on cutting-edge enterprise AI software solutions. Comparing these leaders reveals not only their technological strengths but also their strategic positioning. Join me as we explore which company stands out as the most compelling investment opportunity today.
Table of contents
Companies Overview
I will begin the comparison between Fiserv and C3.ai by providing an overview of these two companies and their main differences.
Fiserv Overview
Fiserv, Inc. operates globally in payment and financial services technology. The company serves a broad client base including businesses, banks, credit unions, and merchants through its Acceptance, Fintech, and Payments segments. Its offerings include point-of-sale solutions, digital banking, loan account management, card processing, and fraud protection. Headquartered in Milwaukee, Wisconsin, Fiserv employs approximately 38,000 people and has a market capitalization of about 36.7B USD.
C3.ai Overview
C3.ai, Inc. is an enterprise AI software provider operating internationally with solutions spanning AI application development, data analysis, and industry-specific platforms. Its products serve sectors such as oil and gas, manufacturing, financial services, and healthcare. The company, headquartered in Redwood City, California, has around 891 employees and a market cap near 1.9B USD. C3.ai partners with major firms including AWS, Intel, and Microsoft.
Key similarities and differences
Both Fiserv and C3.ai operate in the technology sector, focusing on software and services that support business operations. Fiserv concentrates on financial services technology with a broad client base and multiple product segments, while C3.ai specializes in enterprise AI solutions across diverse industries. Fiserv’s workforce and market cap are significantly larger, reflecting its established presence, whereas C3.ai is a smaller, more specialized company focused on AI innovation.
Income Statement Comparison
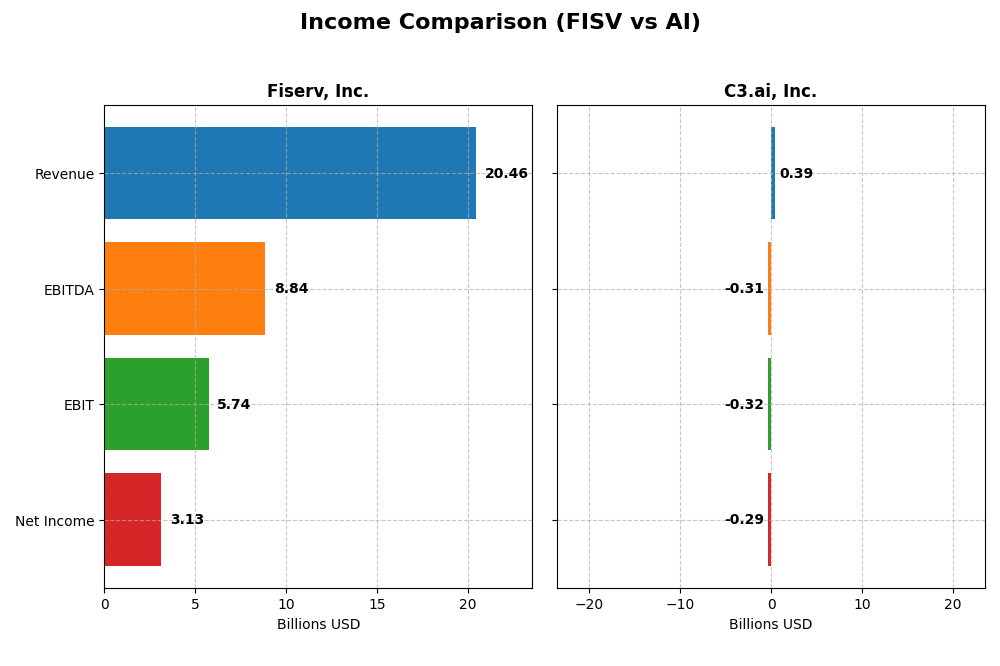
The table below compares key income statement metrics for Fiserv, Inc. and C3.ai, Inc. for the most recent fiscal year available.
| Metric | Fiserv, Inc. (FISV) | C3.ai, Inc. (AI) |
|---|---|---|
| Market Cap | 36.7B | 1.87B |
| Revenue | 20.46B | 389M |
| EBITDA | 8.84B | -312M |
| EBIT | 5.74B | -324M |
| Net Income | 3.13B | -289M |
| EPS | 5.41 | -2.24 |
| Fiscal Year | 2024 | 2025 |
Income Statement Interpretations
Fiserv, Inc.
Fiserv’s revenue steadily increased from $14.9B in 2020 to $20.5B in 2024, with net income rising sharply from $958M to $3.13B. Gross and EBIT margins remained robust and improved, with gross margin at 60.83% and EBIT margin at 28.08% in 2024. Despite a slight dip in net margin growth last year, EPS grew by 8%, indicating solid profitability expansion.
C3.ai, Inc.
C3.ai’s revenue grew significantly from $183M in 2021 to $389M in 2025, supported by a 25% growth in the last year. However, net income remained negative, at -$289M in 2025, despite a modest net margin improvement. Gross margin stayed favorable at 60.62%, but EBIT margin was deeply negative at -83.39%, reflecting ongoing operational challenges.
Which one has the stronger fundamentals?
Fiserv demonstrates stronger fundamentals with consistent revenue and net income growth, favorable margins, and positive EPS trajectory. In contrast, C3.ai shows promising revenue growth but struggles with sustained losses and negative margins. The balance of favorable to unfavorable income statement metrics favors Fiserv’s stability and profitability over C3.ai’s growth-at-losses profile.
Financial Ratios Comparison
The table below presents the most recent financial ratios for Fiserv, Inc. and C3.ai, Inc., highlighting key profitability, liquidity, leverage, and efficiency metrics as of their latest fiscal years.
| Ratios | Fiserv, Inc. (2024) | C3.ai, Inc. (2025) |
|---|---|---|
| ROE | 11.57% | -34.44% |
| ROIC | 8.70% | -36.10% |
| P/E | 37.97 | -9.84 |
| P/B | 4.39 | 3.39 |
| Current Ratio | 1.06 | 6.86 |
| Quick Ratio | 1.06 | 6.86 |
| D/E (Debt-to-Equity) | 0.92 | 0.01 |
| Debt-to-Assets | 32.34% | 0.47% |
| Interest Coverage | 4.75 | 0 |
| Asset Turnover | 0.27 | 0.38 |
| Fixed Asset Turnover | 8.62 | 4.91 |
| Payout ratio | 0 | 0 |
| Dividend yield | 0 | 0 |
Interpretation of the Ratios
Fiserv, Inc.
Fiserv shows a mixed ratio profile with favorable net margin (15.31%) and WACC (6.11%), but unfavorable valuation metrics like PE (37.97) and PB (4.39). Liquidity ratios are mostly neutral to favorable, while asset turnover is weak. The company does not pay dividends, indicating a possible reinvestment strategy or prioritization of growth over shareholder payouts.
C3.ai, Inc.
C3.ai’s ratios reveal significant weaknesses, including deeply negative profitability margins (net margin -74.21%, ROE -34.44%) and unfavorable WACC (12.97%). However, it has favorable leverage ratios and a strong quick ratio (6.86). The firm does not pay dividends, likely reflecting its high-growth phase and focus on R&D and acquisitions rather than shareholder returns.
Which one has the best ratios?
Fiserv exhibits a more balanced and neutral ratio profile with solid profitability and manageable leverage, despite some valuation concerns. C3.ai faces predominantly unfavorable profitability and efficiency ratios, reflecting operational challenges. Overall, Fiserv’s ratios appear comparatively stronger and more stable than those of C3.ai.
Strategic Positioning
This section compares the strategic positioning of Fiserv, Inc. and C3.ai, Inc., focusing on Market position, Key segments, and exposure to disruption:
Fiserv, Inc.
- Large market cap of 36.7B USD in financial technology with broad competitive pressure in payment and fintech sectors
- Operates Acceptance, Fintech, and Payments segments serving banks, merchants, and financial institutions
- Exposure to disruption from digital payments and fintech innovation; integrates cloud and AI technologies extensively
C3.ai, Inc.
- Smaller market cap of 1.87B USD focused on enterprise AI software with competition in AI applications and platform services
- Provides AI application platform and industry-specific AI solutions across various sectors including energy and manufacturing
- Faces disruption risks from fast-evolving AI technology and competition from large cloud and AI service providers
Fiserv, Inc. vs C3.ai, Inc. Positioning
Fiserv pursues a diversified approach across payments, fintech, and merchant services, leveraging scale and broad client base. C3.ai concentrates on enterprise AI software and industry-specific AI applications, relying on strategic tech partnerships. Fiserv’s scale supports stability, while C3.ai’s focus targets rapid AI market growth but with higher risk.
Which has the best competitive advantage?
Fiserv shows a very favorable moat with growing ROIC and value creation, indicating durable competitive advantage. C3.ai has a very unfavorable moat with declining ROIC, signaling value destruction and weaker competitive positioning over recent years.
Stock Comparison
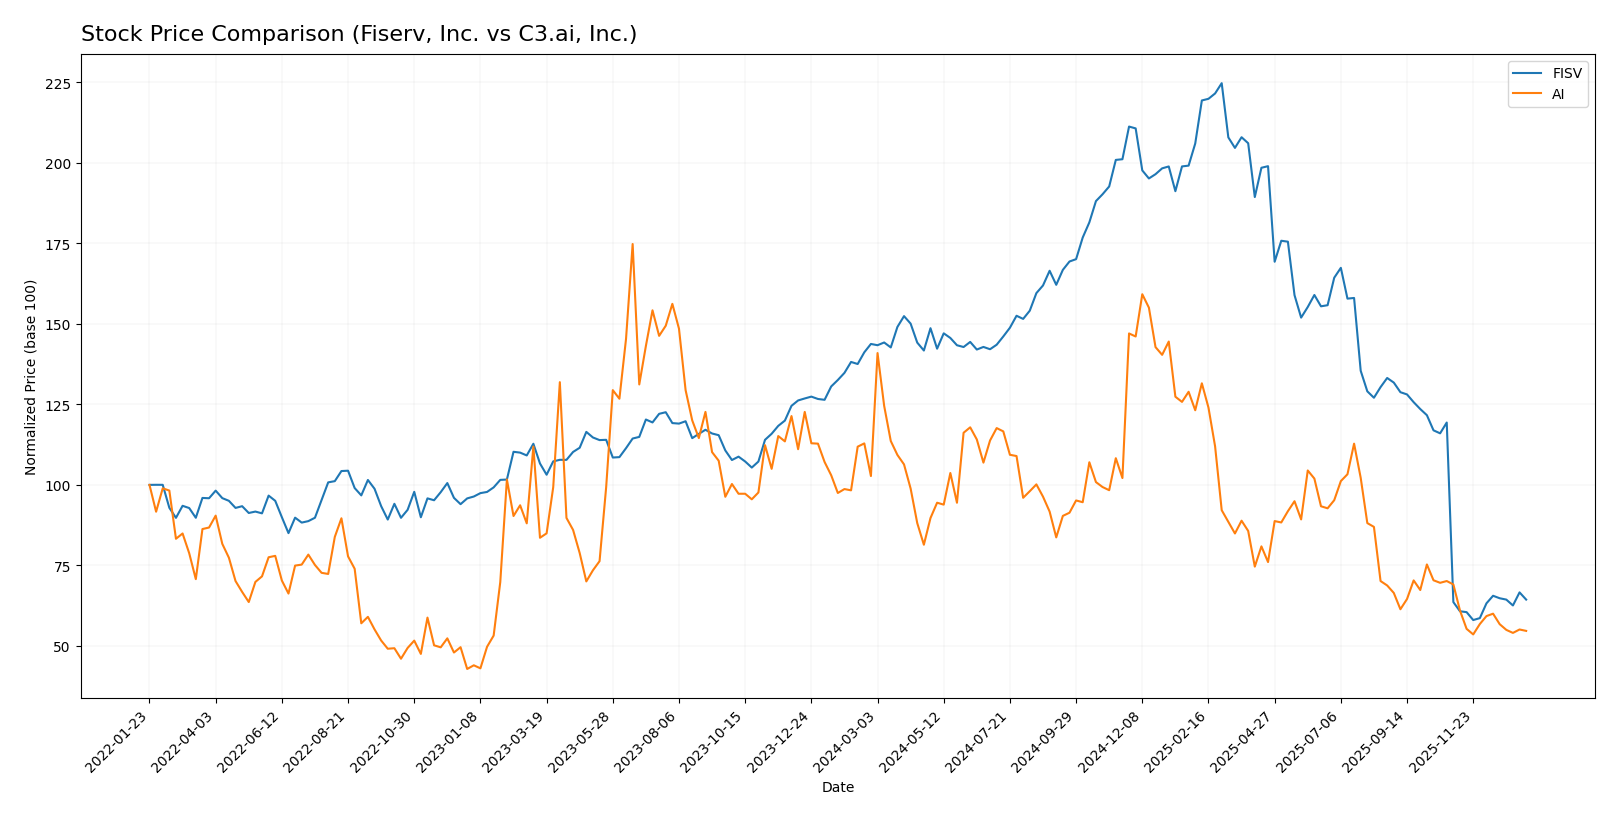
The stock prices of Fiserv, Inc. and C3.ai, Inc. have both experienced significant declines over the past 12 months, with Fiserv showing accelerated bearish momentum and C3.ai a decelerating bearish trend.
Trend Analysis
Fiserv, Inc. (FISV) exhibited a bearish trend over the past year with a 55.23% price decline and accelerating downward momentum, hitting a low of 60.84 and a high of 235.69, alongside high volatility (std deviation 44.96).
C3.ai, Inc. (AI) also trended bearish with a 46.81% price drop over the year, but its decline decelerated. The stock’s range was between 13.63 and 40.52, with lower volatility (std deviation 6.29) compared to Fiserv.
Comparing both, Fiserv’s stock showed a larger percentage drop and greater volatility, resulting in a weaker market performance than C3.ai over the last 12 months.
Target Prices
The target price consensus for Fiserv, Inc. and C3.ai, Inc. reflects moderate upside potential according to analyst estimates.
| Company | Target High | Target Low | Consensus |
|---|---|---|---|
| Fiserv, Inc. | 180 | 62 | 111.39 |
| C3.ai, Inc. | 16 | 11 | 13.5 |
Fiserv’s target consensus at 111.39 suggests a significant upside from its current price of 67.5 USD, while C3.ai’s consensus of 13.5 USD is slightly below its current price of 13.91 USD, indicating mixed analyst expectations.
Analyst Opinions Comparison
This section compares analysts’ ratings and grades for Fiserv, Inc. and C3.ai, Inc.:
Rating Comparison
Fiserv, Inc. Rating
- Rating: B+, considered very favorable overall.
- Discounted Cash Flow Score: 5, very favorable.
- ROE Score: 4, favorable return on equity.
- ROA Score: 3, moderate return on assets.
- Debt To Equity Score: 1, very unfavorable (high risk).
- Overall Score: 3, moderate overall financial standing.
C3.ai, Inc. Rating
- Rating: D+, considered very unfavorable overall.
- Discounted Cash Flow Score: 1, very unfavorable.
- ROE Score: 1, very unfavorable return on equity.
- ROA Score: 1, very unfavorable return on assets.
- Debt To Equity Score: 1, very unfavorable (high risk).
- Overall Score: 1, very unfavorable overall financial standing.
Which one is the best rated?
Based strictly on the provided data, Fiserv, Inc. is better rated than C3.ai, Inc. Fiserv scores higher on all key financial metrics except debt-to-equity, where both share a low score indicating financial risk.
Scores Comparison
The comparison of Fiserv, Inc. and C3.ai, Inc. scores is as follows:
FISV Scores
- Altman Z-Score: 1.41, in distress zone indicating high bankruptcy risk.
- Piotroski Score: 7, classified as strong financial health.
AI Scores
- Altman Z-Score: 3.59, in safe zone indicating low bankruptcy risk.
- Piotroski Score: 2, classified as very weak financial health.
Which company has the best scores?
C3.ai has a significantly stronger Altman Z-Score, placing it in the safe zone, while Fiserv is in distress. Conversely, Fiserv’s Piotroski Score indicates stronger financial health compared to C3.ai’s very weak score.
Grades Comparison
Here is a detailed comparison of the recent grades assigned to Fiserv, Inc. and C3.ai, Inc.:
Fiserv, Inc. Grades
The following table summarizes recent analyst actions and grades for Fiserv, Inc.:
| Grading Company | Action | New Grade | Date |
|---|---|---|---|
| Tigress Financial | Maintain | Buy | 2025-12-31 |
| Mizuho | Maintain | Outperform | 2025-12-22 |
| Goldman Sachs | Downgrade | Neutral | 2025-10-30 |
| Bernstein | Downgrade | Market Perform | 2025-10-30 |
| Argus Research | Downgrade | Hold | 2025-10-30 |
| Morgan Stanley | Downgrade | Equal Weight | 2025-10-30 |
| Truist Securities | Downgrade | Hold | 2025-10-30 |
| JP Morgan | Maintain | Overweight | 2025-10-30 |
| Citigroup | Maintain | Neutral | 2025-10-30 |
| RBC Capital | Maintain | Outperform | 2025-10-30 |
Overall, Fiserv grades show a mix of downgrades from Buy/Outperform to Neutral/Hold in late 2025, but with a consensus still leaning towards Buy.
C3.ai, Inc. Grades
The following table summarizes recent analyst actions and grades for C3.ai, Inc.:
| Grading Company | Action | New Grade | Date |
|---|---|---|---|
| Canaccord Genuity | Maintain | Hold | 2025-12-04 |
| Wedbush | Maintain | Outperform | 2025-12-04 |
| Needham | Maintain | Hold | 2025-12-04 |
| DA Davidson | Maintain | Underperform | 2025-12-04 |
| UBS | Maintain | Neutral | 2025-09-12 |
| Morgan Stanley | Maintain | Underweight | 2025-09-09 |
| Canaccord Genuity | Maintain | Hold | 2025-09-05 |
| Needham | Maintain | Hold | 2025-09-04 |
| Keybanc | Maintain | Underweight | 2025-09-04 |
| JMP Securities | Maintain | Market Outperform | 2025-09-04 |
C3.ai’s grades predominantly remain Hold or Underperform, with some Market Outperform and Outperform ratings, reflecting a cautious stance overall.
Which company has the best grades?
Fiserv, Inc. has received generally more favorable grades, including multiple Buy and Outperform ratings, despite some recent downgrades. C3.ai, Inc. mainly holds a neutral to negative rating profile with several Hold and Underperform grades. This difference may affect investor sentiment regarding growth potential and risk exposure.
Strengths and Weaknesses
Below is a comparative overview of key strengths and weaknesses for Fiserv, Inc. (FISV) and C3.ai, Inc. (AI), based on recent financial and operational data.
| Criterion | Fiserv, Inc. (FISV) | C3.ai, Inc. (AI) |
|---|---|---|
| Diversification | Strong diversification with multiple segments including Processing & Services and Products, generating revenues above $20B in 2024. | Limited diversification focused mainly on License and Professional Services, revenue around $316M in 2024. |
| Profitability | Positive net margin at 15.31%, neutral ROIC of 8.7%, and favorable WACC of 6.11%. | Negative net margin (-74.21%), negative ROIC (-36.1%), unfavorable WACC of 12.97%. |
| Innovation | Moderate innovation with steady growth in Processing segments, but limited new product revenue growth. | High innovation in AI software services but profitability and capital efficiency remain poor. |
| Global presence | Established global payments and financial services presence with large market segments. | Emerging presence, mostly focused on niche AI markets, limited global scale. |
| Market Share | Large market share in financial services technology with durable competitive advantage (ROIC > WACC by 2.59%). | Small market share with declining profitability and value destruction (ROIC far below WACC). |
Key takeaways: Fiserv demonstrates a durable competitive advantage with strong diversification and profitability, suitable for risk-conscious investors. In contrast, C3.ai shows high innovation potential but faces significant profitability and capital efficiency challenges, implying higher investment risk.
Risk Analysis
Below is a risk comparison table for Fiserv, Inc. (FISV) and C3.ai, Inc. (AI) based on the most recent data available.
| Metric | Fiserv, Inc. (FISV) | C3.ai, Inc. (AI) |
|---|---|---|
| Market Risk | Moderate (Beta 0.80) | High (Beta 1.96) |
| Debt level | Moderate (Debt/Assets 32.3%) | Very Low (Debt/Assets 0.47%) |
| Regulatory Risk | Moderate (Financial services) | Moderate (Tech and AI sector) |
| Operational Risk | Moderate (Legacy integration) | High (Rapid growth, scaling) |
| Environmental Risk | Low (Tech sector) | Low (Tech sector) |
| Geopolitical Risk | Moderate (Global operations) | Moderate (International focus) |
Fiserv’s moderate market risk and debt levels reflect stable but cautious financial management, with some vulnerability due to legacy system integration. C3.ai faces higher market and operational risks, driven by rapid expansion and negative profitability metrics. The most impactful risk for C3.ai is operational, given its weak financial scores and growth challenges, while Fiserv’s risk is more balanced but includes moderate regulatory exposure.
Which Stock to Choose?
Fiserv, Inc. (FISV) shows a favorable income statement with strong revenue and net income growth over 2020-2024, supported by balanced profitability and a neutral financial ratios profile. Its debt level is moderate, and the company holds a very favorable B+ rating with a durable competitive advantage indicated by a ROIC well above WACC.
C3.ai, Inc. (AI) exhibits favorable revenue growth but struggles with negative profitability and declining ROIC, signaling value destruction. The financial ratios are mostly unfavorable despite low debt, reflected in a very unfavorable overall rating of D+. Its income statement is mixed, with substantial net margin losses offsetting some growth metrics.
For investors prioritizing stability and quality, Fiserv’s strong income growth, solid profitability, and very favorable rating might appear more suitable. Conversely, those with a risk-tolerant growth focus could see potential in C3.ai’s revenue expansion despite its financial challenges and unfavorable rating. The choice may therefore depend largely on the investor’s risk appetite and strategy.
Disclaimer: Investment carries a risk of loss of initial capital. The past performance is not a reliable indicator of future results. Be sure to understand risks before making an investment decision.
Go Further
I encourage you to read the complete analyses of Fiserv, Inc. and C3.ai, Inc. to enhance your investment decisions: