Fidelity National Information Services, Inc. (FIS) and C3.ai, Inc. (AI) both operate in the dynamic Information Technology Services sector, yet they approach innovation from different angles—FIS focuses on comprehensive financial technology solutions, while C3.ai specializes in cutting-edge artificial intelligence applications. This comparison explores their market strategies and growth potential, helping you identify which company presents the most compelling investment opportunity today. Let’s dive in and uncover the best fit for your portfolio.
Table of contents
Companies Overview
I will begin the comparison between Fidelity National Information Services, Inc. and C3.ai, Inc. by providing an overview of these two companies and their main differences.
Fidelity National Information Services, Inc. Overview
Fidelity National Information Services, Inc. (FIS) delivers technology solutions globally for merchants, banks, and capital markets. Founded in 1968 and based in Jacksonville, Florida, FIS operates through Merchant Solutions, Banking Solutions, and Capital Market Solutions segments. Its offerings include payment processing, digital banking, risk management, and asset management services, positioning it as a comprehensive provider in the information technology services sector.
C3.ai, Inc. Overview
C3.ai, Inc. (AI) is an enterprise AI software company headquartered in Redwood City, California. Founded in 2009, it provides an AI application platform and industry-specific AI solutions for sectors such as oil and gas, manufacturing, and financial services. C3.ai’s software enables customers to develop, deploy, and manage AI applications, emphasizing data analysis, supply chain risk, predictive maintenance, and customer relationship management.
Key similarities and differences
Both FIS and C3.ai operate in the information technology services sector, focusing on technology-driven solutions for enterprise clients. However, FIS offers a broad range of financial technology services including payments and banking infrastructure, while C3.ai specializes in artificial intelligence software platforms and applications. FIS is a well-established company with a larger workforce and market cap, whereas C3.ai is a younger firm focused on AI innovation with strategic partnerships in multiple industries.
Income Statement Comparison
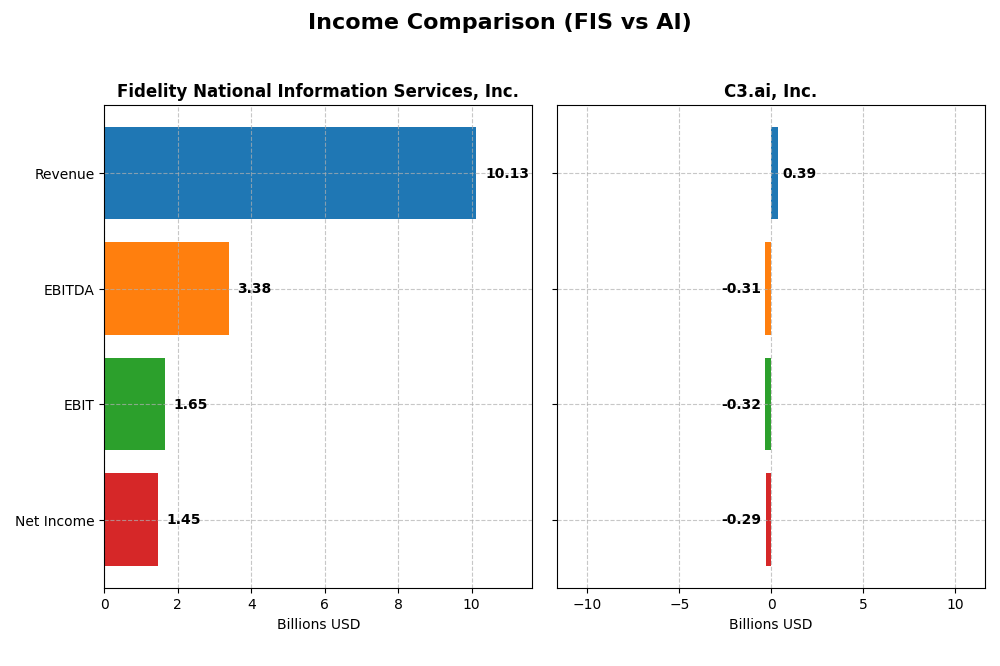
This table presents a side-by-side comparison of key income statement metrics for Fidelity National Information Services, Inc. (FIS) and C3.ai, Inc. (AI) for their most recent fiscal years, providing a snapshot of their financial performance.
| Metric | Fidelity National Information Services, Inc. (FIS) | C3.ai, Inc. (AI) |
|---|---|---|
| Market Cap | 33.1B | 1.87B |
| Revenue | 10.13B | 389M |
| EBITDA | 3.39B | -312M |
| EBIT | 1.65B | -324M |
| Net Income | 1.45B | -289M |
| EPS | 1.42 | -2.24 |
| Fiscal Year | 2024 | 2025 |
Income Statement Interpretations
Fidelity National Information Services, Inc.
FIS’s revenue showed a slight decline over 2020-2024 but rebounded with a 3.01% growth in 2024. Net income dramatically improved from heavy losses in prior years to a positive $1.45B in 2024. Margins generally strengthened, with gross margin at 37.56% and net margin improving sharply, reflecting better profitability and operational efficiency in the latest year.
C3.ai, Inc.
C3.ai experienced consistent revenue growth, increasing 25.27% in 2025 with an overall 112.35% rise since 2021. However, net income remained negative at -$289M in 2025, despite slight improvement. The company maintains a high gross margin of 60.62%, but EBIT and net margins are negative, indicating ongoing operating losses even amid top-line growth.
Which one has the stronger fundamentals?
FIS exhibits stronger fundamentals with positive net income, improving margins, and favorable income growth despite revenue volatility. Conversely, C3.ai’s robust revenue growth contrasts with persistent net losses and negative operating margins, reflecting ongoing challenges in profitability. FIS’s financials suggest better operational stability compared to C3.ai’s high-growth but loss-making profile.
Financial Ratios Comparison
The table below presents key financial ratios for Fidelity National Information Services, Inc. (FIS) and C3.ai, Inc. (AI) based on their most recent fiscal year data, enabling straightforward comparison of their financial performance and health.
| Ratios | Fidelity National Information Services, Inc. (FIS) (2024) | C3.ai, Inc. (AI) (2025) |
|---|---|---|
| ROE | 9.24% | -34.44% |
| ROIC | 3.99% | -36.10% |
| P/E | 30.80 | -9.84 |
| P/B | 2.85 | 3.39 |
| Current Ratio | 0.85 | 6.86 |
| Quick Ratio | 0.85 | 6.86 |
| D/E (Debt-to-Equity) | 0.74 | 0.006 |
| Debt-to-Assets | 34.16% | 0.47% |
| Interest Coverage | 4.87 | 0 (no coverage) |
| Asset Turnover | 0.30 | 0.38 |
| Fixed Asset Turnover | 11.56 | 4.91 |
| Payout ratio | 55.17% | 0% |
| Dividend yield | 1.79% | 0% |
Interpretation of the Ratios
Fidelity National Information Services, Inc.
FIS shows a mixed ratio profile with a favorable net margin of 14.32% but unfavorable returns on equity (9.24%) and invested capital (3.99%). Its fixed asset turnover is strong at 11.56, yet the current ratio is below 1 at 0.85, indicating potential liquidity concerns. The dividend yield is moderate at 1.79%, supported by a stable payout ratio and covered by free cash flow, though risks remain if distributions grow unsustainably.
C3.ai, Inc.
C3.ai’s ratios generally reflect financial stress, with negative net margin (-74.21%), return on equity (-34.44%), and return on invested capital (-36.1%). Despite a high current and quick ratio of 6.86, indicating solid liquidity, the company does not pay dividends, consistent with its negative earnings and reinvestment in R&D (58% of revenue). Its low debt-to-assets ratio (0.47%) signals conservative leverage, but overall ratio status is unfavorable.
Which one has the best ratios?
FIS presents a slightly unfavorable ratio picture with some strengths in profitability and asset turnover, coupled with dividend payments. In contrast, C3.ai’s ratios indicate more pronounced weaknesses, including heavy losses and no dividend payout, despite strong liquidity and low leverage. Based on these evaluations, FIS has a comparatively better ratio profile than C3.ai, though both face challenges.
Strategic Positioning
This section compares the strategic positioning of Fidelity National Information Services, Inc. (FIS) and C3.ai, Inc. (AI), focusing on market position, key segments, and exposure to technological disruption:
FIS
- Large market cap of 33B with diversified segments faces competitive pressure in IT services.
- Operates through Merchant, Banking, and Capital Market Solutions, diversified revenue drivers.
- Exposure to disruption through AI and digital banking, partnering with AI firms like C3.ai.
AI
- Smaller 1.9B market cap, focused on enterprise AI software, competing in niche AI markets.
- Revenue mainly from License and Service, plus Professional Services in AI platform and apps.
- High exposure to technological disruption as a pure AI software provider in multiple industries.
FIS vs AI Positioning
FIS has a diversified business model with multiple financial technology segments, offering stability but facing broad competition. AI concentrates on enterprise AI applications, enabling specialization but with higher exposure to market volatility and tech shifts.
Which has the best competitive advantage?
Based on MOAT evaluation, FIS shows slightly unfavorable positioning with growing profitability, while AI faces very unfavorable conditions with declining returns, indicating FIS has a comparatively stronger competitive advantage.
Stock Comparison
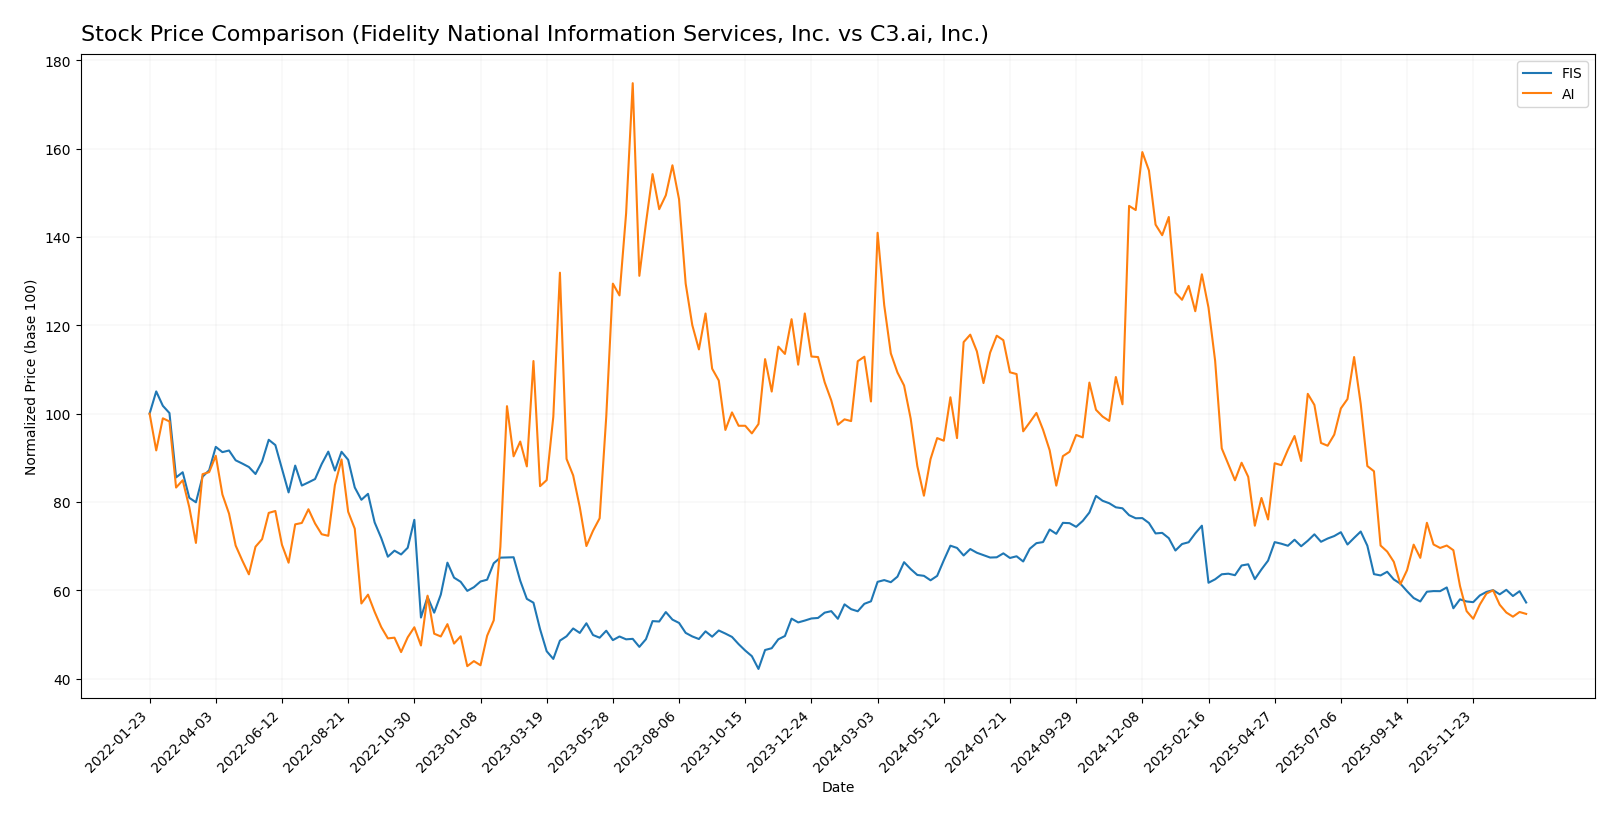
The past year has seen Fidelity National Information Services, Inc. (FIS) maintain a slightly bearish trend with accelerating price movements, while C3.ai, Inc. (AI) experienced a pronounced bearish decline with decelerating momentum.
Trend Analysis
FIS stock showed a modest overall decline of -0.47% over the past 12 months, classifying it as bearish with acceleration in trend and a high price volatility of 7.01. Recent months reversed slightly with a 2.34% increase indicating short-term bullish momentum.
AI stock suffered a significant decrease of -46.81% over the past year, confirming a strong bearish trend accompanied by deceleration and elevated volatility measured at 6.29. The recent period continued the downtrend with a further -20.88% drop.
Comparing trends, FIS delivered a far superior market performance relative to AI, whose steep losses overshadowed FIS’s near-neutral yearly variation.
Target Prices
The current analyst consensus for target prices indicates moderate upside potential for both companies.
| Company | Target High | Target Low | Consensus |
|---|---|---|---|
| Fidelity National Information Services, Inc. | 82 | 69 | 75.5 |
| C3.ai, Inc. | 16 | 11 | 13.5 |
Analysts expect Fidelity National Information Services’ stock to rise from $63.98 to an average target of $75.5, suggesting a solid growth outlook. C3.ai’s consensus target at $13.5 is slightly below its current price of $13.91, signaling more cautious expectations.
Analyst Opinions Comparison
This section compares analysts’ ratings and grades for Fidelity National Information Services, Inc. (FIS) and C3.ai, Inc. (AI):
Rating Comparison
FIS Rating
- Rating: C+, categorized as Very Favorable by analysts.
- Discounted Cash Flow Score: 4, indicating a Favorable valuation based on future cash flows.
- ROE Score: 2, considered Moderate efficiency in generating profit from equity.
- ROA Score: 2, showing Moderate effectiveness in utilizing assets to generate earnings.
- Debt To Equity Score: 1, rated Very Unfavorable, indicating higher financial risk.
- Overall Score: 2, classified as Moderate financial standing.
AI Rating
- Rating: D+, categorized as Very Favorable by analysts.
- Discounted Cash Flow Score: 1, indicating a Very Unfavorable valuation based on future cash flows.
- ROE Score: 1, indicating Very Unfavorable efficiency in generating profit from equity.
- ROA Score: 1, showing Very Unfavorable effectiveness in utilizing assets to generate earnings.
- Debt To Equity Score: 1, rated Very Unfavorable, indicating higher financial risk.
- Overall Score: 1, classified as Very Unfavorable financial standing.
Which one is the best rated?
Based on the provided data, FIS holds higher ratings and scores across most financial metrics compared to AI. FIS’s discounted cash flow and overall scores are notably better, indicating a relatively stronger financial position.
Scores Comparison
The scores comparison of Fidelity National Information Services, Inc. (FIS) and C3.ai, Inc. (AI) is as follows:
FIS Scores
- Altman Z-Score: 0.46, in distress zone indicating high bankruptcy risk.
- Piotroski Score: 8, very strong financial health and value investment potential.
AI Scores
- Altman Z-Score: 3.59, in safe zone indicating low bankruptcy risk.
- Piotroski Score: 2, very weak financial strength and investment potential.
Which company has the best scores?
Based strictly on the data, AI has a much stronger Altman Z-Score indicating financial stability, while FIS has a far superior Piotroski Score reflecting stronger financial health. Each company leads in one score category.
Grades Comparison
Here is a detailed comparison of the latest grades assigned to Fidelity National Information Services, Inc. and C3.ai, Inc.:
Fidelity National Information Services, Inc. Grades
The table below summarizes recent grades from reliable grading companies for Fidelity National Information Services, Inc.:
| Grading Company | Action | New Grade | Date |
|---|---|---|---|
| Truist Securities | Maintain | Hold | 2025-11-19 |
| RBC Capital | Maintain | Outperform | 2025-11-06 |
| JP Morgan | Maintain | Overweight | 2025-11-06 |
| UBS | Maintain | Buy | 2025-11-06 |
| Truist Securities | Maintain | Hold | 2025-10-24 |
| Keefe, Bruyette & Woods | Maintain | Outperform | 2025-10-01 |
| UBS | Upgrade | Buy | 2025-09-30 |
| UBS | Maintain | Neutral | 2025-08-06 |
| Keefe, Bruyette & Woods | Maintain | Outperform | 2025-08-06 |
| Truist Securities | Maintain | Hold | 2025-07-17 |
Overall, the grades for Fidelity National Information Services, Inc. show a strong and consistent buy-to-outperform trend with occasional hold ratings, indicating steady positive analyst sentiment.
C3.ai, Inc. Grades
The table below shows recent grades from reliable grading companies for C3.ai, Inc.:
| Grading Company | Action | New Grade | Date |
|---|---|---|---|
| Canaccord Genuity | Maintain | Hold | 2025-12-04 |
| Wedbush | Maintain | Outperform | 2025-12-04 |
| Needham | Maintain | Hold | 2025-12-04 |
| DA Davidson | Maintain | Underperform | 2025-12-04 |
| UBS | Maintain | Neutral | 2025-09-12 |
| Morgan Stanley | Maintain | Underweight | 2025-09-09 |
| Canaccord Genuity | Maintain | Hold | 2025-09-05 |
| Needham | Maintain | Hold | 2025-09-04 |
| Keybanc | Maintain | Underweight | 2025-09-04 |
| JMP Securities | Maintain | Market Outperform | 2025-09-04 |
The grades for C3.ai, Inc. reflect a mixed analyst sentiment, ranging from hold and neutral to underperform and underweight, with few outperform ratings, suggesting more cautious views.
Which company has the best grades?
Fidelity National Information Services, Inc. has received generally stronger grades compared to C3.ai, Inc., with a consensus “Buy” and many outperform ratings. This suggests more positive analyst confidence, whereas C3.ai’s consensus “Hold” and varied ratings indicate higher uncertainty, potentially affecting investor risk perception.
Strengths and Weaknesses
Below is a comparison of key strengths and weaknesses of Fidelity National Information Services, Inc. (FIS) and C3.ai, Inc. (AI) based on recent financial performance, innovation, and market presence.
| Criterion | Fidelity National Information Services, Inc. (FIS) | C3.ai, Inc. (AI) |
|---|---|---|
| Diversification | Strong diversification with Banking, Capital Market, and Merchant Solutions generating multi-billion revenues | Focused primarily on License and Service with smaller Professional Services segment; less diversified |
| Profitability | Moderate profitability: Net margin 14.3%, but ROIC (3.99%) below WACC (6.54%), indicating slight value destruction | Negative profitability: Net margin -74.2%, ROIC -36.1%, company shedding value with declining profitability |
| Innovation | Moderate innovation with steady ROIC growth but overall slightly unfavorable moat rating | Innovation challenged, steep declining ROIC trend, very unfavorable moat status |
| Global presence | Extensive global financial solutions footprint with consistent revenue growth in key segments | Smaller scale with limited global reach compared to FIS |
| Market Share | Leading position in financial technology solutions with significant asset turnover | Emerging player in AI software market but with limited current market share and high risk profile |
Key takeaways: FIS demonstrates stronger diversification and a growing profitability trend despite current slight value destruction, making it a more stable choice. AI shows significant challenges with profitability and market traction, posing higher risks for investors. Caution and risk management are advised when considering AI.
Risk Analysis
Below is a comparative risk overview for Fidelity National Information Services, Inc. (FIS) and C3.ai, Inc. (AI) based on their latest financial and operational data for 2024-2025.
| Metric | Fidelity National Information Services, Inc. (FIS) | C3.ai, Inc. (AI) |
|---|---|---|
| Market Risk | Moderate (Beta 0.94, stable market cap 33B USD) | High (Beta 1.96, volatile price) |
| Debt level | Moderate (Debt-to-Equity 0.74, Interest Coverage 4.7) | Low (Debt-to-Equity 0.01, Interest Coverage 0) |
| Regulatory Risk | Moderate (Financial sector compliance requirements) | Moderate (AI sector evolving regulations) |
| Operational Risk | Moderate (Large scale integration risks, 50K employees) | High (Smaller scale, high innovation risk) |
| Environmental Risk | Low (Technology services, limited direct impact) | Low (Software focus, minimal footprint) |
| Geopolitical Risk | Moderate (Global operations, exposure to US policies) | Moderate (International presence, tech export controls) |
FIS faces moderate market and operational risks with a solid but leveraged financial position, showing some vulnerability in liquidity ratios and profitability metrics. AI exhibits higher market and operational risks due to its smaller size, high beta, and negative profitability, despite low debt. The most impactful risks are AI’s financial instability and FIS’s market sensitivity amidst regulatory pressures. Investors should weigh AI’s growth potential against its financial distress signals and FIS’s steadier but less dynamic profile.
Which Stock to Choose?
Fidelity National Information Services, Inc. (FIS) shows a favorable income statement with a 14.32% net margin and strong growth in net margin and EPS over 2020-2024. Financial ratios are slightly unfavorable overall, with moderate profitability and neutral debt levels. The company has a growing ROIC but still sheds value compared to its WACC, and holds a very favorable C+ rating.
C3.ai, Inc. (AI) displays favorable revenue and gross profit growth, but suffers from negative profitability metrics including a -74.21% net margin and declining ROIC well below WACC. Financial ratios are mostly unfavorable, despite low debt levels and a safe-zone Altman Z-Score. Its rating is very favorable D+ but with weak profitability scores.
Considering ratings and the overall financial profile, FIS might appear more suitable for investors prioritizing stable income and improving profitability, while AI could be seen as appealing for risk-tolerant investors focused on growth potential despite current losses and value destruction.
Disclaimer: Investment carries a risk of loss of initial capital. The past performance is not a reliable indicator of future results. Be sure to understand risks before making an investment decision.
Go Further
I encourage you to read the complete analyses of Fidelity National Information Services, Inc. and C3.ai, Inc. to enhance your investment decisions: