EPAM Systems, Inc. and C3.ai, Inc. are two prominent players in the Information Technology Services sector, each driving innovation in digital transformation and artificial intelligence. While EPAM focuses on comprehensive software engineering and platform solutions, C3.ai specializes in enterprise AI applications across diverse industries. Their overlapping markets and distinct strategies make this comparison essential. Let’s explore which company offers the most compelling investment opportunity in 2026.
Table of contents
Companies Overview
I will begin the comparison between EPAM Systems, Inc. and C3.ai, Inc. by providing an overview of these two companies and their main differences.
EPAM Overview
EPAM Systems, Inc. is a global provider of digital platform engineering and software development services. Founded in 1993 and headquartered in Newtown, Pennsylvania, EPAM serves diverse industries such as financial services, healthcare, and software, offering engineering, infrastructure management, and digital design solutions. With 61.2K employees, EPAM positions itself as a comprehensive technology services company focused on innovation and system integration.
C3.ai Overview
C3.ai, Inc. operates as an enterprise AI software provider, delivering a suite of AI applications and platforms to optimize business operations across various sectors including oil and gas, manufacturing, and financial services. Founded in 2009 and based in Redwood City, California, C3.ai focuses on AI-driven solutions for predictive maintenance, fraud detection, and supply chain risk management. The company employs 891 people and partners with major tech firms like AWS and Microsoft.
Key similarities and differences
Both EPAM and C3.ai operate in the technology sector, providing software and IT services, yet their focus differs significantly. EPAM emphasizes broad digital engineering and software development services, while C3.ai specializes in AI-powered enterprise applications. EPAM’s workforce and market capitalization are substantially larger, reflecting its diversified service model, whereas C3.ai’s niche in AI software targets specific enterprise optimization needs with strategic partnerships enhancing its reach.
Income Statement Comparison
Below is the income statement comparison for EPAM Systems, Inc. and C3.ai, Inc. for their most recent fiscal years, providing a snapshot of key financial metrics.
| Metric | EPAM Systems, Inc. | C3.ai, Inc. |
|---|---|---|
| Market Cap | 12.2B | 1.87B |
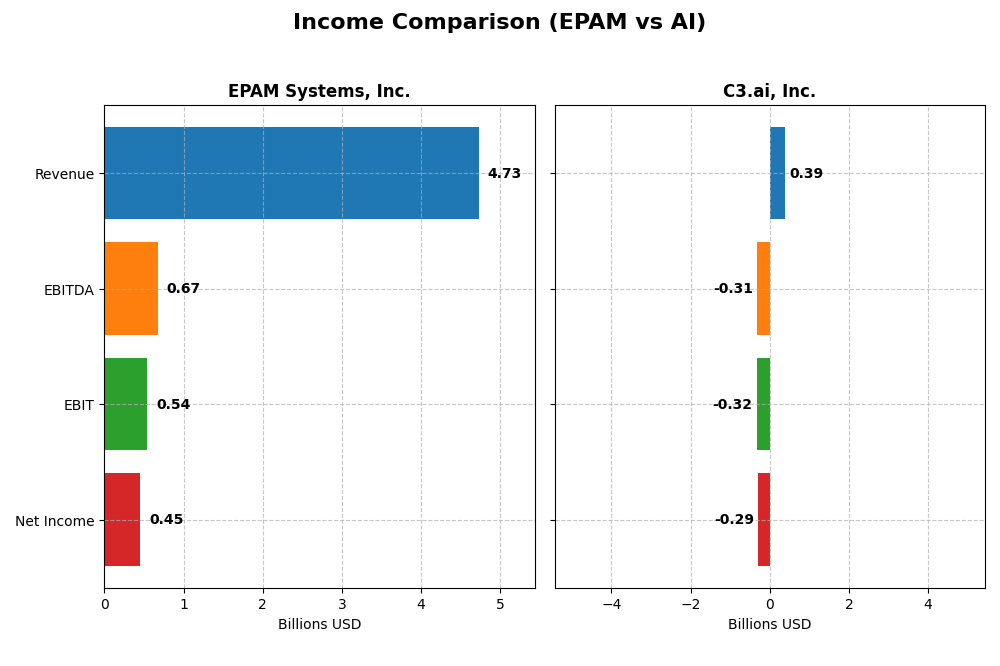
| Revenue | 4.73B | 389M |
| EBITDA | 672M | -312M |
| EBIT | 545M | -324M |
| Net Income | 455M | -289M |
| EPS | 7.93 | -2.24 |
| Fiscal Year | 2024 | 2025 |
Income Statement Interpretations
EPAM Systems, Inc.
EPAM’s revenue demonstrated steady growth from 2020 to 2024, increasing from $2.66B to $4.73B, with net income also rising from $327M to $455M. Margins remained generally stable, with a gross margin near 30.7% and net margin around 9.6%. In 2024, revenue growth slowed to 0.8%, but net margin and EPS improved, indicating enhanced profitability.
C3.ai, Inc.
C3.ai saw rapid revenue growth from $183M in 2021 to $389M in 2025, a 112.4% increase overall. However, net income remained negative, widening losses to $289M in 2025. The company’s gross margin was strong at 60.6%, but EBIT and net margins stayed deeply negative, reflecting ongoing operational challenges despite recent revenue acceleration.
Which one has the stronger fundamentals?
EPAM exhibits stronger fundamentals with consistent revenue and net income growth, stable margins, and positive net profitability. Conversely, while C3.ai achieves higher revenue growth and gross margins, it faces significant net losses and negative operating margins, indicating weaker profitability and higher risk in its financial performance over the period.
Financial Ratios Comparison
The table below presents a side-by-side comparison of key financial ratios for EPAM Systems, Inc. and C3.ai, Inc., based on their most recent fiscal year data.
| Ratios | EPAM Systems, Inc. (2024) | C3.ai, Inc. (2025) |
|---|---|---|
| ROE | 12.52% | -34.44% |
| ROIC | 10.67% | -36.10% |
| P/E | 29.47 | -9.84 |
| P/B | 3.69 | 3.39 |
| Current Ratio | 2.96 | 6.86 |
| Quick Ratio | 2.96 | 6.86 |
| D/E (Debt-to-Equity) | 0.045 | 0.006 |
| Debt-to-Assets | 3.44% | 0.47% |
| Interest Coverage | 0 | 0 |
| Asset Turnover | 1.00 | 0.38 |
| Fixed Asset Turnover | 14.07 | 4.91 |
| Payout ratio | 0 | 0 |
| Dividend yield | 0 | 0 |
Interpretation of the Ratios
EPAM Systems, Inc.
EPAM exhibits a mixed ratio profile with strengths in liquidity and low leverage, as reflected by a current ratio near 3 and a debt-to-equity ratio of 0.04, both favorable. Profitability metrics such as ROE (12.52%) and net margin (9.61%) are neutral, while valuation ratios like P/E (29.47) and P/B (3.69) are unfavorable, indicating potential overvaluation. EPAM does not pay dividends, aligning with a reinvestment strategy.
C3.ai, Inc.
C3.ai shows predominantly unfavorable profitability ratios, including a negative net margin (-74.21%) and ROE (-34.44%), reflecting operational challenges. Liquidity is strong with a quick ratio of 6.86, while debt levels remain low. The negative P/E ratio results from losses but is marked favorable due to the lack of earnings. C3.ai does not pay dividends, likely prioritizing growth and R&D investments amid ongoing losses.
Which one has the best ratios?
Considering the overall ratio evaluations, EPAM presents a slightly favorable profile due to solid liquidity, manageable debt, and positive profitability, despite some valuation concerns. In contrast, C3.ai faces significant profitability weaknesses and an unfavorable global ratio opinion, although it maintains strong liquidity and low leverage. Thus, EPAM holds a more balanced ratio stance than C3.ai.
Strategic Positioning
This section compares the strategic positioning of EPAM Systems, Inc. and C3.ai, Inc. in terms of Market position, Key segments, and Exposure to technological disruption:
EPAM Systems, Inc.
- Established global IT services provider facing competition in tech services.
- Diverse segments: financial services, consumer goods, healthcare, software, media, emerging verticals.
- Exposure through digital engineering and software development services; leverages AI, robotics, VR.
C3.ai, Inc.
- Enterprise AI software company operating internationally with rising competition.
- Focused on AI application platforms and industry-specific AI solutions across multiple sectors.
- High exposure via AI platforms, turnkey AI applications, and partnerships with tech giants.
EPAM vs C3.ai Positioning
EPAM employs a diversified business model across multiple industries, balancing risk and revenue sources. C3.ai concentrates on enterprise AI software, targeting specialized AI-driven applications. EPAM’s broad scope contrasts with C3.ai’s focused AI innovation, each with distinct market advantages and challenges.
Which has the best competitive advantage?
Both EPAM and C3.ai show very unfavorable MOAT evaluations, indicating declining ROIC and value destruction. Neither currently demonstrates a strong competitive advantage or sustainable economic moat based on capital efficiency trends.
Stock Comparison
The stock price chart highlights notable bearish trends for both EPAM Systems, Inc. and C3.ai, Inc. over the past year, with EPAM showing recent bullish momentum and C3.ai continuing a decelerating decline.
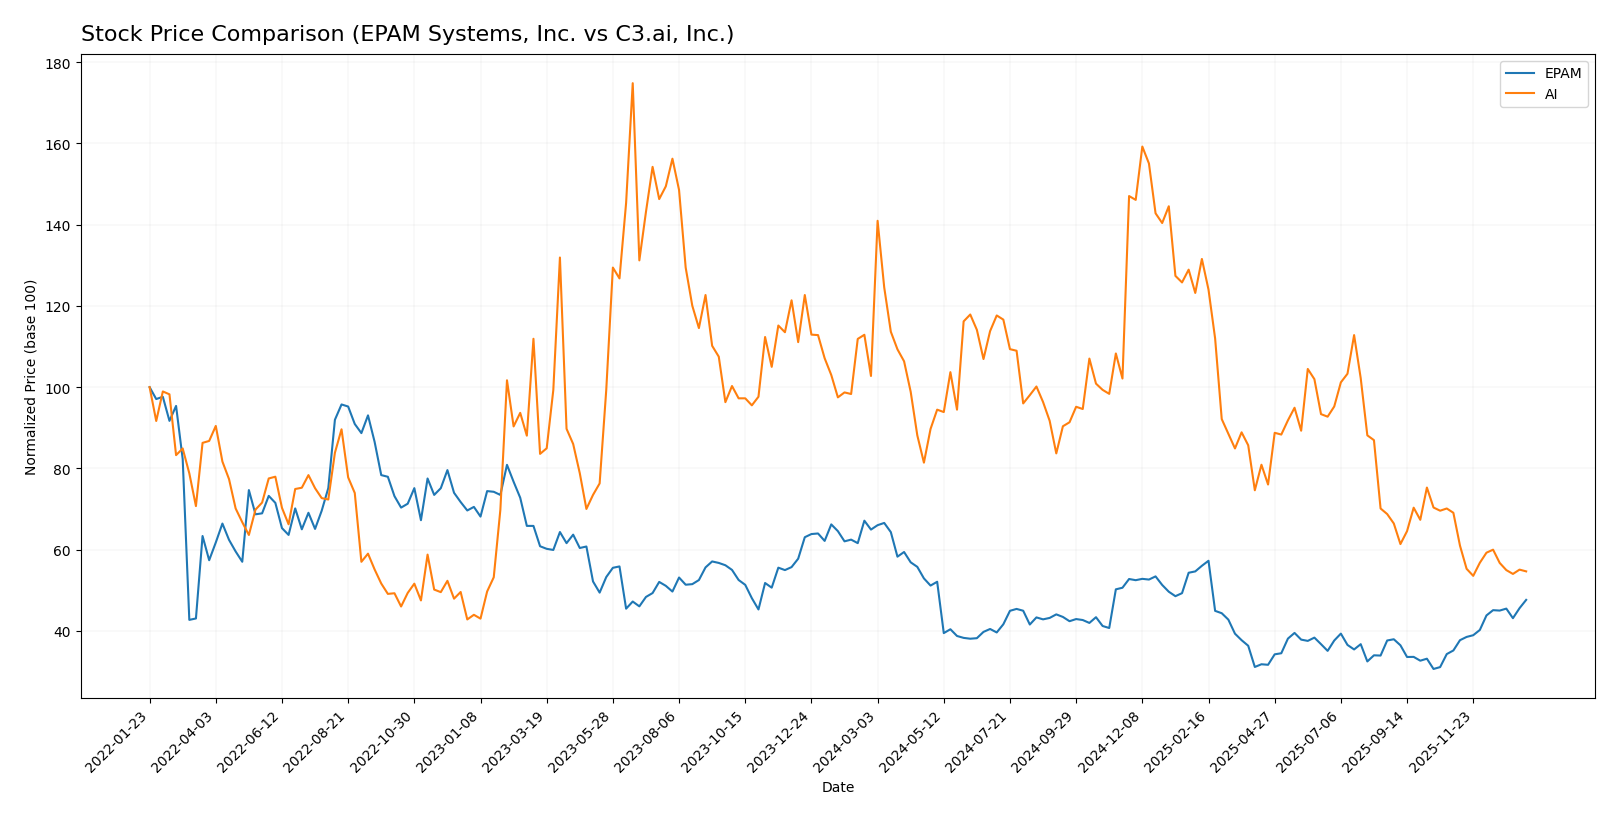
Trend Analysis
EPAM Systems, Inc. experienced a -26.64% price decline over the past 12 months, indicating a bearish trend with accelerating downward movement. Its price fluctuated widely, with a high of 309.4 and a low of 142.38, reflecting high volatility (std deviation 38.96).
C3.ai, Inc. showed a stronger bearish trend over the same period, with a -46.81% price drop and decelerating decline. The stock price ranged between 40.52 and 13.63, exhibiting lower volatility (std deviation 6.29).
Comparing both, EPAM Systems, Inc. outperformed C3.ai, Inc. despite its negative annual return, as its recent trend shows a significant 35.38% rebound, whereas C3.ai continues to decline.
Target Prices
The consensus target prices for EPAM Systems, Inc. and C3.ai, Inc. reflect moderate upside potential according to recent analyst estimates.
| Company | Target High | Target Low | Consensus |
|---|---|---|---|
| EPAM Systems, Inc. | 247 | 175 | 214 |
| C3.ai, Inc. | 16 | 11 | 13.5 |
Analysts see EPAM’s stock price, currently at 221.4 USD, slightly below the consensus target of 214 USD, suggesting limited upside. C3.ai’s stock trades near 13.91 USD, close to its 13.5 USD consensus target, indicating a balanced risk-reward outlook.
Analyst Opinions Comparison
This section compares analysts’ ratings and financial scores for EPAM Systems, Inc. and C3.ai, Inc.:
Rating Comparison
EPAM Rating
- Rating: A- indicating a very favorable assessment of financial standing.
- Discounted Cash Flow Score: 4, showing favorable valuation based on cash flows.
- ROE Score: 3, a moderate level of efficiency in generating profit from equity.
- ROA Score: 4, favorable utilization of assets to generate earnings.
- Debt To Equity Score: 4, favorable financial stability with low reliance on debt.
- Overall Score: 4, a favorable summary of financial health and prospects.
AI Rating
- Rating: D+ indicating a very unfavorable financial standing.
- Discounted Cash Flow Score: 1, reflecting very unfavorable valuation.
- ROE Score: 1, very unfavorable efficiency in profit generation.
- ROA Score: 1, very unfavorable asset utilization.
- Debt To Equity Score: 1, very unfavorable financial risk due to high debt.
- Overall Score: 1, very unfavorable overall financial health.
Which one is the best rated?
Based purely on the provided data, EPAM is significantly better rated than C3.ai. EPAM shows favorable scores across key financial metrics, while C3.ai’s scores are very unfavorable in all comparable categories.
Scores Comparison
The comparison of EPAM Systems and C3.ai scores is as follows:
EPAM Scores
- Altman Z-Score of 8.83 places EPAM in the safe zone, indicating low bankruptcy risk.
- Piotroski Score of 7 reflects strong financial health and investment potential.
AI Scores
- Altman Z-Score of 3.59 places AI in the safe zone, suggesting low bankruptcy risk.
- Piotroski Score of 2 indicates very weak financial strength and investment potential.
Which company has the best scores?
EPAM Systems shows a significantly higher Altman Z-Score and a much stronger Piotroski Score compared to C3.ai. Based solely on these scores, EPAM demonstrates stronger financial stability and health than C3.ai.
Grades Comparison
Here is a detailed comparison of recent grades assigned to EPAM Systems, Inc. and C3.ai, Inc.:
EPAM Systems, Inc. Grades
The table below summarizes recent grades given by reputable grading companies to EPAM Systems, Inc.:
| Grading Company | Action | New Grade | Date |
|---|---|---|---|
| TD Cowen | Maintain | Buy | 2026-01-09 |
| Mizuho | Maintain | Outperform | 2025-11-11 |
| JP Morgan | Maintain | Overweight | 2025-11-07 |
| Morgan Stanley | Maintain | Equal Weight | 2025-09-09 |
| JP Morgan | Maintain | Overweight | 2025-08-20 |
| Barclays | Maintain | Overweight | 2025-05-12 |
| Guggenheim | Maintain | Buy | 2025-05-09 |
| Morgan Stanley | Maintain | Equal Weight | 2025-05-09 |
| Needham | Maintain | Buy | 2025-05-09 |
| Piper Sandler | Maintain | Neutral | 2025-05-09 |
Overall, EPAM’s grades show a consistent positive outlook with multiple “Buy,” “Outperform,” and “Overweight” ratings maintained by major firms.
C3.ai, Inc. Grades
The table below summarizes recent grades given by reputable grading companies to C3.ai, Inc.:
| Grading Company | Action | New Grade | Date |
|---|---|---|---|
| Canaccord Genuity | Maintain | Hold | 2025-12-04 |
| Wedbush | Maintain | Outperform | 2025-12-04 |
| Needham | Maintain | Hold | 2025-12-04 |
| DA Davidson | Maintain | Underperform | 2025-12-04 |
| UBS | Maintain | Neutral | 2025-09-12 |
| Morgan Stanley | Maintain | Underweight | 2025-09-09 |
| Canaccord Genuity | Maintain | Hold | 2025-09-05 |
| Needham | Maintain | Hold | 2025-09-04 |
| Keybanc | Maintain | Underweight | 2025-09-04 |
| JMP Securities | Maintain | Market Outperform | 2025-09-04 |
Grades for C3.ai, Inc. reflect a more mixed sentiment, with a balance of “Hold,” “Underperform,” and “Underweight” ratings, contrasted by a few “Outperform” and “Market Outperform” assessments.
Which company has the best grades?
EPAM Systems, Inc. has received predominantly favorable grades, including multiple “Buy” and “Outperform” ratings, indicating stronger analyst confidence compared to C3.ai, Inc., which shows a more cautious consensus dominated by “Hold” and “Underweight” grades. This disparity suggests differing market perceptions of growth and risk profiles between the two companies.
Strengths and Weaknesses
Below is a comparison table of key strengths and weaknesses for EPAM Systems, Inc. and C3.ai, Inc. based on the most recent financial and operational data.
| Criterion | EPAM Systems, Inc. | C3.ai, Inc. |
|---|---|---|
| Diversification | Highly diversified across sectors including Financial Services (1.02B), Consumer Goods (1.01B), Software & Hi-Tech (702M), Healthcare (575M) | Limited diversification, mainly License and Service (278M) and Professional Services (32M) |
| Profitability | Moderate net margin (9.61%), ROE 12.52%, ROIC 10.67% but below WACC (11.76%) indicating value destruction | Negative profitability with net margin -74.21%, negative ROE and ROIC, clearly shedding value |
| Innovation | Stable revenue in Software & Hi-Tech sector, but declining ROIC trend implies challenges in innovation impact | Heavy investment in AI innovation but with declining ROIC and profitability, indicating current inefficiencies |
| Global presence | Strong global presence with multiple sector revenues and stable financial ratios like high current ratio (2.96) | Smaller scale with less global reach, high quick ratio (6.86) but poor asset turnover and interest coverage |
| Market Share | Solid position in IT services with steady revenues across sectors | Still establishing market share in AI software, revenue growing but profitability and efficiency lag behind |
Key takeaways: EPAM is a diversified IT services leader with moderate profitability but faces declining capital efficiency. C3.ai shows high innovation focus but suffers from significant losses and operational inefficiencies, posing higher investment risk.
Risk Analysis
Below is a comparison of key risks for EPAM Systems, Inc. and C3.ai, Inc. based on the most recent data available for 2025-2026:
| Metric | EPAM Systems, Inc. | C3.ai, Inc. |
|---|---|---|
| Market Risk | High beta (1.73) indicating higher price volatility | Very high beta (1.96), implying greater market sensitivity |
| Debt level | Very low debt-to-equity (0.04), low debt-to-assets (3.44%) | Minimal debt (0.01 D/E), very low debt-to-assets (0.47%) |
| Regulatory Risk | Moderate, typical for tech services, no recent issues | Moderate, AI sector faces evolving regulations and scrutiny |
| Operational Risk | Large global workforce (61,200 employees) — complexity in management | Smaller scale (891 employees), but rapid growth challenges |
| Environmental Risk | Limited exposure, primarily digital services | Limited direct impact, but AI energy consumption concerns rising |
| Geopolitical Risk | Exposure through global clients and operations | Global footprint with emphasis on North America and Europe |
In synthesis, C3.ai faces higher market risk due to its elevated beta and weaker financial health, reflected in poor profitability and operational efficiency ratios. EPAM, while also exposed to market volatility, maintains a strong balance sheet with minimal debt and solid operational controls, reducing financial distress risk. Regulatory and geopolitical uncertainties remain relevant for both but are more pronounced in AI due to rapid sector evolution. Investors should weigh EPAM’s stability against C3.ai’s higher growth risk profile.
Which Stock to Choose?
EPAM Systems, Inc. shows a generally favorable income evolution with 71% positive income statement metrics despite a slight revenue growth slowdown (0.8% in 2024). Its financial ratios are slightly favorable overall, supported by strong liquidity and low debt. Profitability remains solid with a 12.5% ROE and healthy margins, but the company is shedding value as its ROIC lags behind WACC, and profitability is declining. EPAM carries a very favorable A- rating and strong financial scores, including a safe Altman Z-Score of 8.83 and a strong Piotroski score of 7.
C3.ai, Inc. has a favorable income trend marked by significant revenue growth of 25.3% in 2025, yet it suffers from persistent net losses and negative profitability ratios such as a -74% net margin and -34% ROE. Its financial ratios are mostly unfavorable, with high operating risks and weak asset utilization, despite very low debt levels. The company is also destroying value with a sharply declining ROIC well below WACC. C3.ai’s rating is very unfavorable at D+, with a safe Altman Z-Score of 3.59 but a very weak Piotroski score of 2, reflecting financial fragility.
For investors prioritizing financial stability and profitability, EPAM might appear more favorable due to its stronger rating and income quality despite value destruction concerns. Conversely, investors with a higher risk tolerance focused on growth could find C3.ai’s strong revenue expansion and low debt appealing, though accompanied by significant profitability challenges and an unfavorable financial profile. Overall, the choice could depend on an investor’s preference for stability versus aggressive growth potential.
Disclaimer: Investment carries a risk of loss of initial capital. The past performance is not a reliable indicator of future results. Be sure to understand risks before making an investment decision.
Go Further
I encourage you to read the complete analyses of EPAM Systems, Inc. and C3.ai, Inc. to enhance your investment decisions: