Home > Comparison > Technology > DXC vs AI
The strategic rivalry between DXC Technology Company and C3.ai, Inc. shapes the evolution of the technology services sector. DXC operates as a capital-intensive global IT services provider, focusing on business and infrastructure solutions. In contrast, C3.ai delivers high-margin enterprise AI software with a leaner operational model. This analysis explores which company presents a superior risk-adjusted investment profile amid differing growth trajectories and sector dynamics.

Table of contents
Companies Overview
DXC Technology and C3.ai stand as pivotal players reshaping information technology services through distinct strategic lenses.
DXC Technology Company: Global IT Services Powerhouse
DXC Technology dominates Information Technology Services with 130K employees worldwide. Its core revenue stems from Global Business Services and Global Infrastructure Services, focusing on digital transformation, cloud migration, and cybersecurity. In 2026, DXC emphasizes accelerating secure application delivery and agile process automation to reduce costs and risks for enterprise clients.
C3.ai, Inc.: Enterprise AI Software Innovator
C3.ai specializes in enterprise artificial intelligence software with a workforce under 1K. It generates revenue by licensing its AI application platform and industry-specific AI solutions, including inventory optimization and predictive maintenance. The company’s 2026 strategy hinges on expanding AI adoption across sectors via strategic partnerships with AWS, Intel, and Microsoft.
Strategic Collision: Similarities & Divergences
DXC pursues a broad IT services approach, integrating legacy systems with cloud and automation, while C3.ai champions a focused AI-first software platform. Both battle for enterprise digital transformation budgets, yet DXC targets infrastructure-heavy modernization, and C3.ai targets AI-driven decision-making. Their investment profiles diverge sharply: DXC offers scale and stability; C3.ai presents higher growth potential paired with greater volatility.
Income Statement Comparison
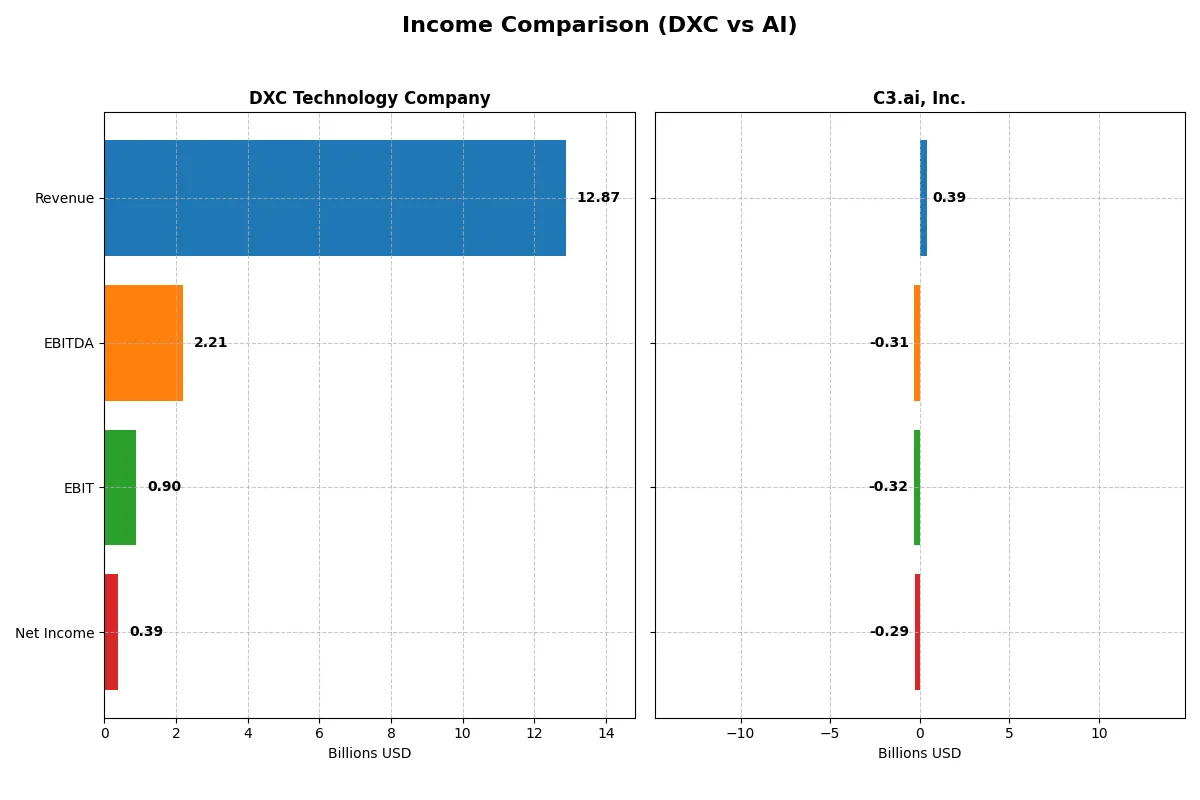
This data dissects the core profitability and scalability of both corporate engines to reveal who dominates the bottom line:
| Metric | DXC Technology Company (DXC) | C3.ai, Inc. (AI) |
|---|---|---|
| Revenue | 12.9B | 389M |
| Cost of Revenue | 9.77B | 153M |
| Operating Expenses | 2.40B | 560M |
| Gross Profit | 3.10B | 236M |
| EBITDA | 2.21B | -312M |
| EBIT | 895M | -324M |
| Interest Expense | 265M | 0 |
| Net Income | 389M | -289M |
| EPS | 2.15 | -2.24 |
| Fiscal Year | 2025 | 2025 |
Income Statement Analysis: The Bottom-Line Duel
This income statement comparison uncovers which company runs a more efficient and profitable corporate engine in 2025.
DXC Technology Company Analysis
DXC’s revenue declined 5.8% to $12.9B in 2025, while net income surged over fourfold to $389M. The gross margin holds steady near 24%, reflecting stable cost control. EBIT margin improved significantly to nearly 7%, signaling operational momentum. Despite top-line pressure, DXC sharply boosted profitability and EPS, reflecting better expense management and a turnaround in earnings.
C3.ai, Inc. Analysis
C3.ai’s revenue jumped 25% to $389M in 2025, with gross margin expanding to a robust 60.6%. However, the company remains unprofitable, reporting a -74% net margin and negative EBIT margin of -83%. Losses persist despite revenue growth and improved EPS. The steep operating expenses continue to weigh heavily on the bottom line, limiting efficiency gains.
Profitability Resurgence vs. Growth Burden
DXC clearly wins on profitability, transforming losses into positive net income and expanding margins despite declining revenue. C3.ai impresses with rapid revenue and gross profit growth but struggles to convert scale into profits. For investors prioritizing a clear path to earnings, DXC’s improving profitability profile appears more compelling than C3.ai’s high-growth yet loss-heavy model.
Financial Ratios Comparison
These vital ratios act as a diagnostic tool to expose the underlying fiscal health, valuation premiums, and capital efficiency of the companies compared:
| Ratios | DXC Technology Company (DXC) | C3.ai, Inc. (AI) |
|---|---|---|
| ROE | 12.0% | -34.4% |
| ROIC | 4.4% | -36.1% |
| P/E | 7.92 | -9.84 |
| P/B | 0.95 | 3.39 |
| Current Ratio | 1.22 | 6.86 |
| Quick Ratio | 1.22 | 6.86 |
| D/E | 1.41 | 0.006 |
| Debt-to-Assets | 34.4% | 0.47% |
| Interest Coverage | 2.63 | 0 |
| Asset Turnover | 0.97 | 0.38 |
| Fixed Asset Turnover | 6.82 | 4.91 |
| Payout ratio | 0 | 0 |
| Dividend yield | 0 | 0 |
| Fiscal Year | 2025 | 2025 |
Efficiency & Valuation Duel: The Vital Signs
Financial ratios act as a company’s DNA, revealing hidden risks and operational excellence that underlie stock performance and valuation.
DXC Technology Company
DXC shows moderate profitability with a 12.05% ROE and slim 3.02% net margin, signaling operational challenges. Valuation appears attractive with a low P/E of 7.92 and P/B near 1, indicating the stock is reasonably priced. Lack of dividends points to retained earnings fueling stability over growth, reflecting a prudent capital allocation strategy.
C3.ai, Inc.
C3.ai struggles with deep losses, reflected in a -34.44% ROE and negative net margin of -74.21%. Its sky-high P/S ratio above 6 suggests the stock is expensive and stretched despite a low debt load. Heavy investment in R&D consumes resources, aiming for long-term innovation rather than current shareholder payouts, which heightens risk.
Balanced Valuation vs. Growth Gambit
DXC offers a more balanced risk-reward profile with favorable valuation metrics and moderate profitability. C3.ai’s ratios reveal a high-risk growth play with significant operational losses and stretched valuation. Investors cautious about downside may lean toward DXC, while those seeking aggressive growth might consider C3.ai’s speculative profile.
Which one offers the Superior Shareholder Reward?
I observe DXC Technology Company does not pay dividends but maintains a modest free cash flow yield near 4.5 per share and a conservative payout ratio of zero. Its buyback activity is implied through steady free cash flow generation, supporting shareholder returns sustainably with manageable leverage (debt-to-equity ~1.4). Conversely, C3.ai, Inc. pays no dividends and posts significant net losses with negative free cash flow and operating margins, relying on heavy reinvestment into growth rather than shareholder distributions. Its buyback program is absent and high valuation multiples (price-to-sales ~7.3) reflect growth expectations but risk. I conclude DXC offers a more attractive and sustainable total return profile in 2026 due to disciplined capital allocation and positive cash generation.
Comparative Score Analysis: The Strategic Profile
The radar chart reveals the fundamental DNA and trade-offs of DXC Technology Company and C3.ai, Inc.:
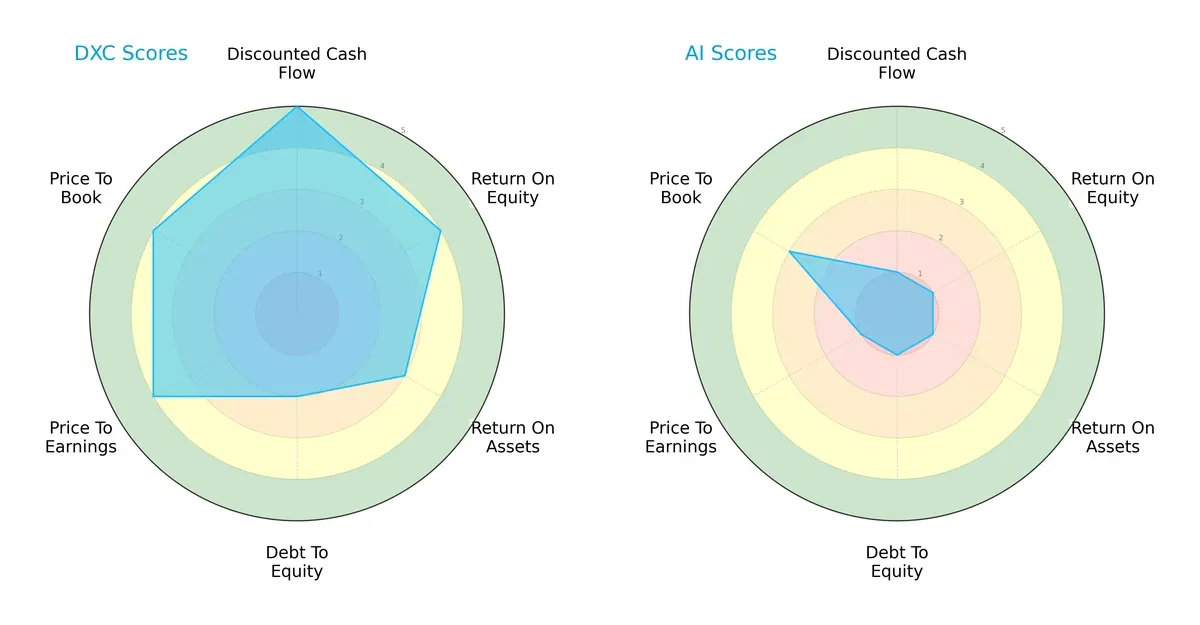
DXC Technology shows a balanced profile with strong DCF (5) and favorable ROE (4), P/E (4), and P/B (4) scores. Its moderate ROA (3) and weaker debt-to-equity (2) suggest some leverage risk but manageable. C3.ai relies heavily on a single strength—its moderate P/B score (3)—while lagging severely in all other metrics (all scores 1), indicating an imbalanced and risky financial profile.
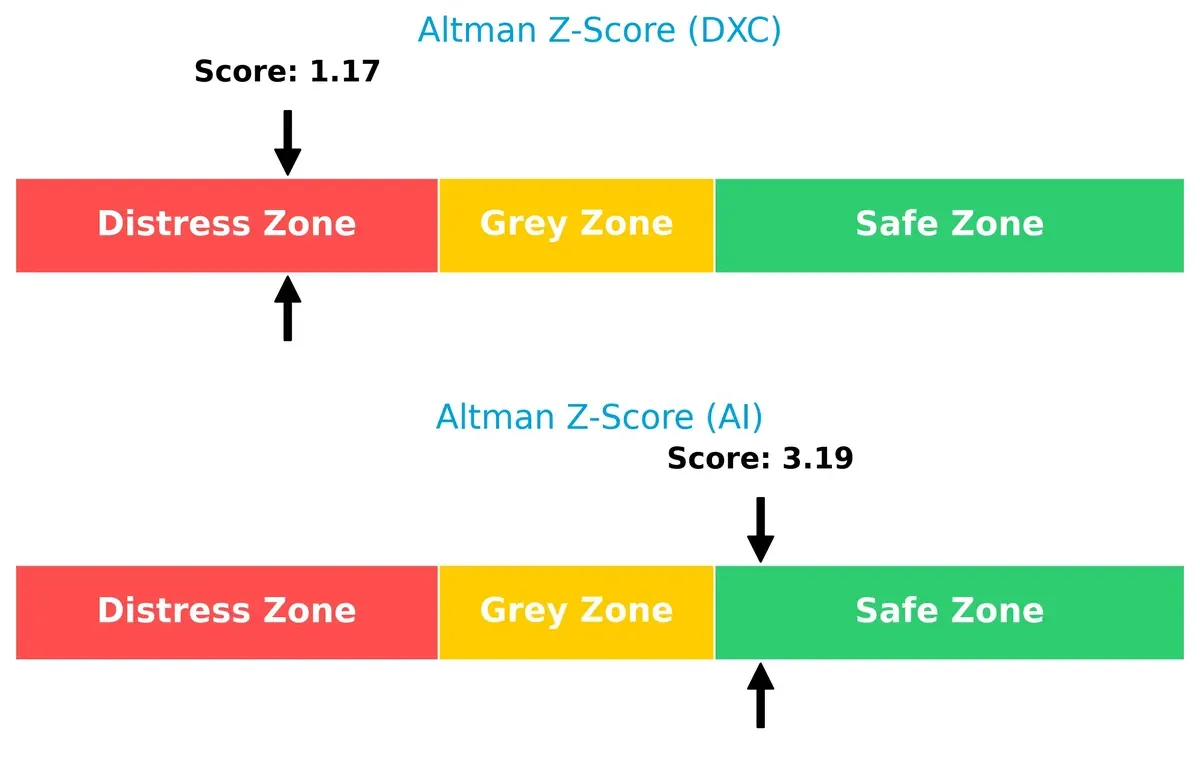
Bankruptcy Risk: Solvency Showdown
DXC’s Altman Z-Score sits in the distress zone at 1.17, signaling heightened bankruptcy risk amid this cycle. C3.ai scores 3.19, placing it firmly in the safe zone, which implies stronger long-term survival prospects:
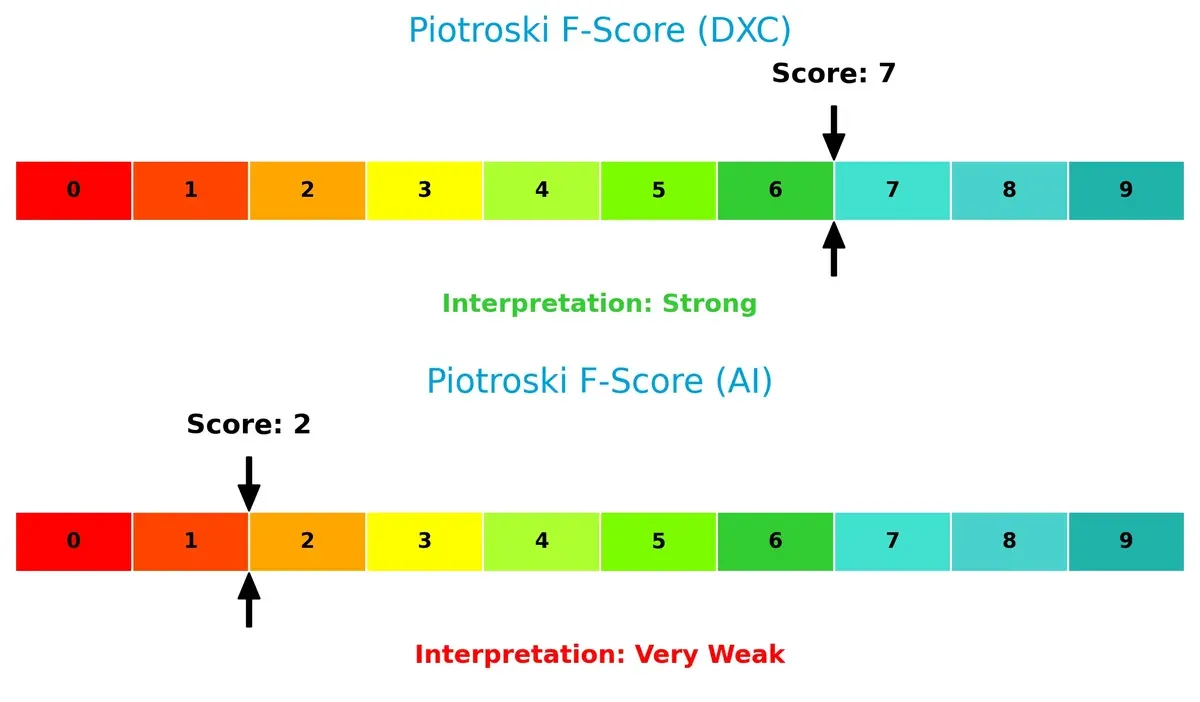
Financial Health: Quality of Operations
DXC’s Piotroski F-Score of 7 indicates strong financial health and operational quality. In contrast, C3.ai’s score of 2 flags weak internal metrics and potential red flags for investors:
How are the two companies positioned?
This section dissects DXC and C3.ai’s operational DNA by comparing their revenue distribution and internal strengths and weaknesses. The goal is to confront their economic moats and reveal which model offers the most resilient competitive advantage today.
Revenue Segmentation: The Strategic Mix
This visual comparison dissects how DXC Technology Company and C3.ai, Inc. diversify their income streams and where their primary sector bets lie:
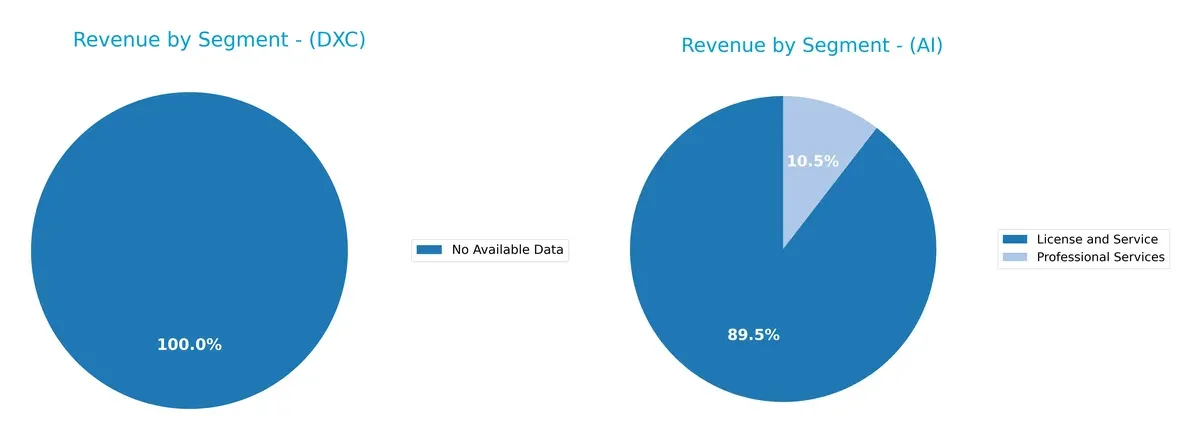
DXC Technology Company lacks available segment data, preventing a clear revenue mix analysis. Conversely, C3.ai anchors its revenue in License and Service, generating $278M in 2024, dwarfing Professional Services at $32M. C3.ai’s concentrated reliance on software licensing signals high margins but exposes it to sector-specific risks. Without DXC’s breakdown, C3.ai’s focused model contrasts with what might be a broader tech services scope.
Strengths and Weaknesses Comparison
This table compares the strengths and weaknesses of DXC Technology Company and C3.ai, Inc.:
DXC Strengths
- Favorable valuation metrics with PE at 7.92 and PB below 1
- Quick and fixed asset turnovers show operational efficiency
- Low WACC relative to ROIC supports cost-effective capital use
AI Strengths
- Strong quick ratio and low debt-to-equity indicate solid liquidity and low leverage
- Favorable fixed asset turnover suggests efficient asset management
- Growing License and Service revenue signals expanding market presence
DXC Weaknesses
- Low net margin at 3.02% reflects thin profitability
- Unfavorable ROIC below WACC signals poor capital returns
- Elevated debt-to-equity ratio at 1.41 increases financial risk
- Zero dividend yield may reduce income appeal
AI Weaknesses
- Deeply negative profitability ratios including net margin and ROE
- High WACC at 13.03% inflates capital costs
- Unfavorable current ratio despite strong quick ratio flags working capital imbalance
- Negative interest coverage ratio signals potential solvency concerns
DXC’s strengths lie in valuation and capital efficiency but face profitability and leverage challenges. AI’s liquidity and asset use are solid, yet persistent losses and high capital costs weigh heavily on its financial health. Each company’s profile reflects distinct strategic and operational trade-offs.
The Moat Duel: Analyzing Competitive Defensibility
A structural moat stands as the only reliable shield protecting long-term profits from relentless competitive erosion:
DXC Technology Company: Cost Efficiency in Legacy IT Services
DXC’s moat centers on cost advantage through scale in legacy IT outsourcing and cloud migration. Stable gross margins near 24% and improving EBIT reflect operational discipline. Yet, shrinking revenue signals pressure; new digital services must expand to sustain its edge in 2026.
C3.ai, Inc.: Innovation-Driven Network Effects
C3.ai’s moat derives from network effects embedded in its AI platform and strategic partnerships. Its high gross margin (60%) highlights pricing power, despite negative EBIT margins. Rapid revenue growth fuels future moat deepening, but persistent losses threaten durability if scale economies lag.
Cost Leadership vs. Network Effects: The Moat Showdown
Both firms destroy value with ROIC below WACC, signaling weak moats financially. DXC’s cost advantage offers steadier margin control. C3.ai’s network effects promise growth but come with risk. DXC holds a shallower but more defensible moat; C3.ai must prove scalable profitability to protect market share.
Which stock offers better returns?
Over the past year, both DXC Technology Company and C3.ai, Inc. experienced significant price declines with contrasting recent rebounds and persistent volatility shaping their trading dynamics.
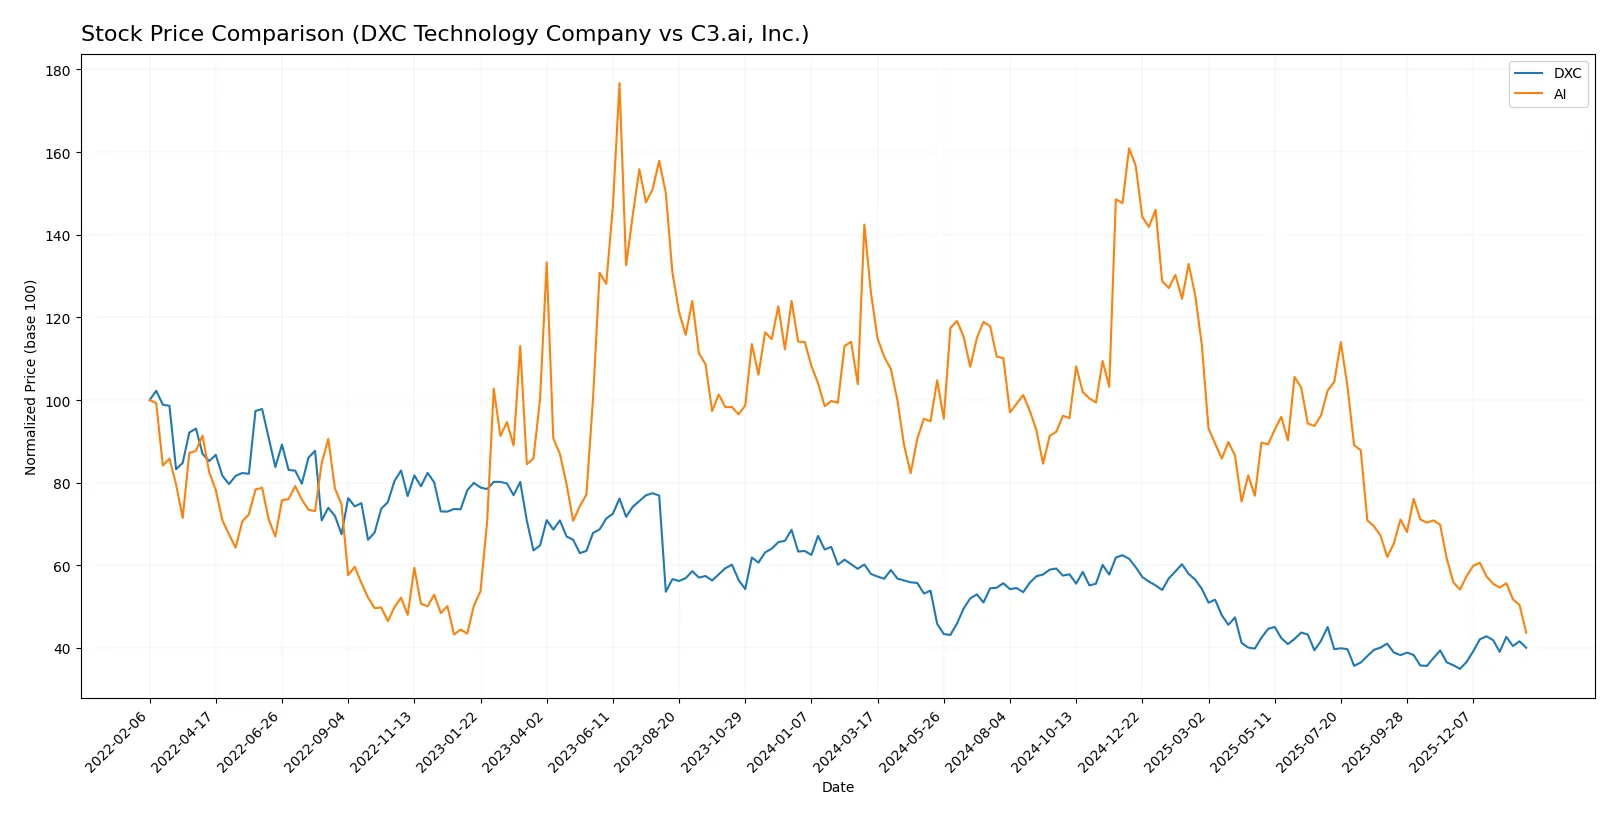
Trend Comparison
DXC Technology’s stock fell 30.82% over the past year, marking a bearish trend with accelerating losses. It hit a high of 22.5 and a low of 12.59, showing recent recovery of 11.77% since November 2025.
C3.ai’s stock dropped 65.27% in the same period, also bearish but with decelerating losses. Volatility was higher, with a 40.52 peak and 11.01 trough, followed by a continued recent decline of 21.75%.
DXC outperformed C3.ai over the last 12 months. DXC’s recent price rebound contrasts with C3.ai’s ongoing decline, delivering the stronger market performance.
Target Prices
Analysts present a moderate upside potential for both DXC Technology Company and C3.ai, Inc.
| Company | Target Low | Target High | Consensus |
|---|---|---|---|
| DXC Technology Company | 13 | 14 | 13.5 |
| C3.ai, Inc. | 10 | 16 | 12.33 |
DXC’s target consensus of 13.5 is slightly below its current price of 14.43, signaling limited near-term upside. C3.ai shows a wider range with a consensus above its 11.01 price, reflecting mixed analyst confidence but potential growth.

Don’t Let Luck Decide Your Entry Point
Optimize your entry points with our advanced ProRealTime indicators. You’ll get efficient buy signals with precise price targets for maximum performance. Start outperforming now!
How do institutions grade them?
The following tables summarize the latest institutional grades for DXC Technology Company and C3.ai, Inc.:
DXC Technology Company Grades
The table below shows recent grades from reputable financial institutions for DXC Technology Company.
| Grading Company | Action | New Grade | Date |
|---|---|---|---|
| Stifel | Maintain | Hold | 2025-10-31 |
| JP Morgan | Maintain | Underweight | 2025-08-20 |
| Morgan Stanley | Maintain | Equal Weight | 2025-08-01 |
| RBC Capital | Maintain | Sector Perform | 2025-08-01 |
| JP Morgan | Maintain | Underweight | 2025-05-21 |
| BMO Capital | Maintain | Market Perform | 2025-05-15 |
| RBC Capital | Maintain | Sector Perform | 2025-05-15 |
| Morgan Stanley | Maintain | Equal Weight | 2025-05-15 |
| Guggenheim | Maintain | Neutral | 2025-05-12 |
| Susquehanna | Maintain | Neutral | 2025-04-23 |
C3.ai, Inc. Grades
Below are recent grades provided by established financial analysts for C3.ai, Inc.
| Grading Company | Action | New Grade | Date |
|---|---|---|---|
| Wedbush | Maintain | Outperform | 2025-12-04 |
| DA Davidson | Maintain | Underperform | 2025-12-04 |
| Canaccord Genuity | Maintain | Hold | 2025-12-04 |
| Needham | Maintain | Hold | 2025-12-04 |
| UBS | Maintain | Neutral | 2025-09-12 |
| Morgan Stanley | Maintain | Underweight | 2025-09-09 |
| Canaccord Genuity | Maintain | Hold | 2025-09-05 |
| Keybanc | Maintain | Underweight | 2025-09-04 |
| UBS | Maintain | Neutral | 2025-09-04 |
| Needham | Maintain | Hold | 2025-09-04 |
Which company has the best grades?
C3.ai, Inc. holds generally stronger grades, including an Outperform rating by Wedbush. DXC Technology’s ratings cluster around Hold and Underweight. Investors may view C3.ai’s more bullish consensus as a signal of higher growth expectations.
Risks specific to each company
The following categories identify the critical pressure points and systemic threats facing both firms in the 2026 market environment:
1. Market & Competition
DXC Technology Company
- Established IT services with diversified client base faces intense tech service competition.
C3.ai, Inc.
- Niche AI software market with rapid innovation but highly competitive and fast-evolving landscape.
2. Capital Structure & Debt
DXC Technology Company
- Debt-to-equity ratio is high at 1.41, signaling financial leverage risk.
C3.ai, Inc.
- Practically no debt (0.01 ratio), indicating low financial risk but potential under-leverage.
3. Stock Volatility
DXC Technology Company
- Beta near 1.05 reflects average market volatility and moderate stock price risk.
C3.ai, Inc.
- High beta of 1.96 implies significant stock price swings and elevated volatility risk.
4. Regulatory & Legal
DXC Technology Company
- Operates globally with exposure to data privacy and outsourcing regulations.
C3.ai, Inc.
- AI sector faces emerging regulatory scrutiny on data use and algorithm transparency.
5. Supply Chain & Operations
DXC Technology Company
- Large operational footprint with complex legacy system transitions; moderate supply chain risk.
C3.ai, Inc.
- Primarily software-based, less supply chain exposure but dependent on cloud infrastructure partners.
6. ESG & Climate Transition
DXC Technology Company
- Moderate ESG risks due to large workforce and global operations; ongoing digital transformation aids sustainability.
C3.ai, Inc.
- Growing ESG focus with AI solutions for energy management, but faces scrutiny on AI ethics and data governance.
7. Geopolitical Exposure
DXC Technology Company
- Broad international presence exposes DXC to geopolitical and trade tensions risks.
C3.ai, Inc.
- Global reach but smaller scale limits direct geopolitical exposure; dependency on U.S. tech alliances.
Which company shows a better risk-adjusted profile?
DXC faces its largest risk in financial leverage with a high debt load increasing vulnerability in downturns. C3.ai’s dominant risk lies in extreme stock volatility and poor profitability metrics, heightening investment uncertainty. Despite DXC’s debt concerns, its stable market position and stronger financial metrics yield a better risk-adjusted profile. C3.ai’s Altman Z-score in the safe zone contrasts with its very weak Piotroski score, underscoring operational weaknesses despite low debt. The stark contrast in market capitalization and profitability metrics justifies caution on C3.ai’s aggressive valuation and volatile trading.
Final Verdict: Which stock to choose?
DXC Technology stands out as a cash-efficient operator with a sturdy balance sheet and improving profitability. Its main point of vigilance is the ongoing value destruction indicated by a declining ROIC. This stock suits investors with an appetite for turnaround stories and value-oriented, moderately aggressive growth portfolios.
C3.ai’s strategic moat lies in its high-margin, R&D-driven AI platform, offering potential for outsized revenue growth. Relative to DXC, it carries higher execution risk and negative profitability but benefits from a pristine balance sheet and robust liquidity. It fits well in growth-at-a-reasonable-price (GARP) portfolios tempered by risk tolerance.
If you prioritize financial resilience and improving earnings, DXC Technology is the compelling choice due to its improving cash flows and favorable valuation metrics. However, if you seek high-growth exposure with a tolerance for volatility and structural losses, C3.ai offers superior top-line momentum and innovation potential, albeit with significant execution risk.
Disclaimer: Investment carries a risk of loss of initial capital. The past performance is not a reliable indicator of future results. Be sure to understand risks before making an investment decision.
Go Further
I encourage you to read the complete analyses of DXC Technology Company and C3.ai, Inc. to enhance your investment decisions: