Home > Comparison > Technology > CTSH vs AI
The strategic rivalry between Cognizant Technology Solutions Corporation and C3.ai, Inc. shapes the future of the technology sector. Cognizant operates as a capital-intensive IT services giant with diversified consulting and outsourcing segments. In contrast, C3.ai focuses on high-margin, enterprise AI software solutions. This head-to-head pits scale and operational breadth against cutting-edge innovation. This analysis will clarify which trajectory offers superior risk-adjusted returns for a balanced portfolio.
Table of contents
Companies Overview
Cognizant and C3.ai stand as key players in the evolving Information Technology Services landscape.
Cognizant Technology Solutions Corporation: Global IT Services Powerhouse
Cognizant leads as a professional services giant, generating revenue from consulting, technology, and outsourcing. Its strength lies in delivering digital transformation across financial services, healthcare, and communications. In 2026, the company emphasizes enhancing customer experience through AI, analytics, and robotic process automation, targeting operational efficiency and seamless omni-channel solutions.
C3.ai, Inc.: Enterprise AI Innovator
C3.ai focuses exclusively on enterprise AI software, earning revenue by providing a comprehensive AI application platform and specialized industry solutions. Its 2026 strategy centers on expanding AI-driven tools for supply chain, predictive maintenance, and fraud detection. Strategic partnerships with AWS, Microsoft, and others fuel its push into industries like oil and gas, manufacturing, and financial services, carving a niche in AI innovation.
Strategic Collision: Similarities & Divergences
Both firms operate within technology services but diverge sharply in approach. Cognizant offers broad digital transformation consulting, while C3.ai delivers a focused AI platform with turnkey applications. They compete primarily in enterprise digital adoption, with Cognizant leveraging scale and breadth and C3.ai emphasizing AI specialization. This contrast defines their investment profiles: Cognizant as a diversified IT services leader and C3.ai as a high-beta AI growth contender.
Income Statement Comparison
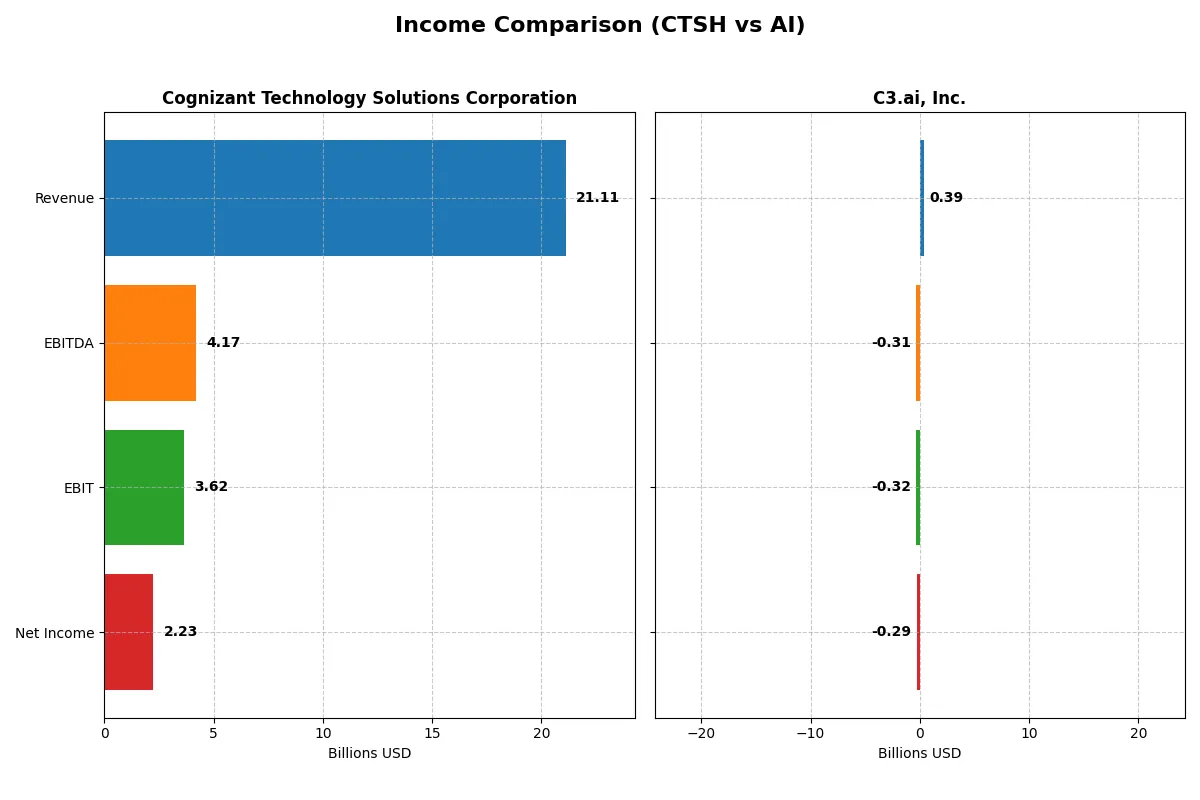
This data dissects the core profitability and scalability of both corporate engines to reveal who dominates the bottom line:
| Metric | Cognizant Technology Solutions Corporation (CTSH) | C3.ai, Inc. (AI) |
|---|---|---|
| Revenue | 21.1B | 389M |
| Cost of Revenue | 14.0B | 153M |
| Operating Expenses | 3.59B | 560M |
| Gross Profit | 7.12B | 236M |
| EBITDA | 4.17B | -312M |
| EBIT | 3.62B | -324M |
| Interest Expense | 37M | 0 |
| Net Income | 2.23B | -289M |
| EPS | 4.56 | -2.24 |
| Fiscal Year | 2025 | 2025 |
Income Statement Analysis: The Bottom-Line Duel
This comparison reveals the true efficiency and profitability of Cognizant and C3.ai’s business engines over recent years.
Cognizant Technology Solutions Corporation (CTSH) Analysis
CTSH’s revenue steadily grew from $18.5B in 2021 to $21.1B in 2025, with net income rising modestly to $2.23B in 2025. Gross margins hold firm around 33.7%, and EBIT margin improved to 17.2%, signaling operational efficiency. The latest year shows solid momentum with 7% revenue growth and a 21% EBIT jump despite slight net margin compression.
C3.ai, Inc. (AI) Analysis
AI exhibits rapid revenue growth of 25% in the last year, scaling from $183M in 2021 to $389M in 2025. However, it remains unprofitable, with a net loss widening to $289M and a negative 74% net margin. Despite a high 60.6% gross margin, AI’s EBIT margin stays deeply negative at -83%, reflecting heavy operating expenses and ongoing investment in growth.
Margin Strength vs. Growth Ambition
CTSH delivers consistent profitability with strong margins and moderate growth, underpinning a durable earnings engine. AI impresses with explosive revenue expansion but struggles to translate that into profits. For investors prioritizing financial stability and margin health, CTSH clearly leads. AI suits those focused on top-line momentum and willing to accept losses for future potential.
Financial Ratios Comparison
These vital ratios act as a diagnostic tool to expose the underlying fiscal health, valuation premiums, and capital efficiency of the companies compared here:
| Ratios | Cognizant Technology Solutions Corporation (CTSH) | C3.ai, Inc. (AI) |
|---|---|---|
| ROE | 15.5% (2024) | -34.4% (2025) |
| ROIC | 13.2% (2024) | -36.1% (2025) |
| P/E | 17.0 (2024) | -9.8 (2025) |
| P/B | 2.65 (2024) | 3.39 (2025) |
| Current Ratio | 2.09 (2024) | 6.86 (2025) |
| Quick Ratio | 2.09 (2024) | 6.86 (2025) |
| D/E | 0.10 (2024) | 0.006 (2025) |
| Debt-to-Assets | 7.5% (2024) | 0.47% (2025) |
| Interest Coverage | 53.6 (2024) | 0 (2025) |
| Asset Turnover | 0.99 (2024) | 0.38 (2025) |
| Fixed Asset Turnover | 12.8 (2024) | 4.91 (2025) |
| Payout Ratio | 27% (2024) | 0% (2025) |
| Dividend Yield | 1.57% (2024) | 0% (2025) |
| Fiscal Year | 2024 | 2025 |
Efficiency & Valuation Duel: The Vital Signs
Financial ratios act as a company’s DNA, uncovering hidden risks and revealing operational strengths critical to investment decisions.
Cognizant Technology Solutions Corporation
Cognizant shows solid profitability with a favorable net margin of 10.56%, though ROE and ROIC data are unavailable. Its P/E ratio near 18 signals a fairly valued stock, neither cheap nor expensive. The company returns 1.53% in dividends, balancing shareholder payouts with ongoing reinvestment.
C3.ai, Inc.
C3.ai struggles with deeply negative profitability metrics: a net margin of -74% and negative ROE and ROIC. The negative P/E ratio reflects losses despite a high P/B of 3.39, indicating an expensive valuation relative to book value. It pays no dividends, focusing heavily on R&D and growth, as shown by elevated expense ratios.
Balanced Profitability vs. Growth Risk
Cognizant offers a more stable risk-reward profile with positive margins and a moderate valuation. C3.ai’s metrics reveal high operational losses and valuation stretched by growth investments. Investors seeking operational safety might prefer Cognizant; those targeting speculative growth may consider C3.ai’s profile.
Which one offers the Superior Shareholder Reward?
I compare Cognizant Technology Solutions Corporation (CTSH) and C3.ai, Inc. (AI) on shareholder returns through dividends and buybacks. CTSH pays a steady 1.53% dividend yield with a prudent 27% payout ratio, well covered by free cash flow of 5.4/share. It also supports buybacks, reinforcing shareholder value sustainably. AI pays no dividends and reports negative margins, relying on cash reserves and heavy reinvestment in R&D and growth, reflected in a high current ratio near 7. However, negative free cash flow and operating cash flow raise sustainability concerns. I see CTSH’s balanced dividend and buyback strategy as superior for total return and long-term stability in 2026, while AI’s growth bets carry higher risk without immediate shareholder rewards.
Comparative Score Analysis: The Strategic Profile
The radar chart reveals the fundamental DNA and trade-offs of Cognizant Technology Solutions Corporation and C3.ai, Inc., highlighting their strategic strengths and weaknesses:
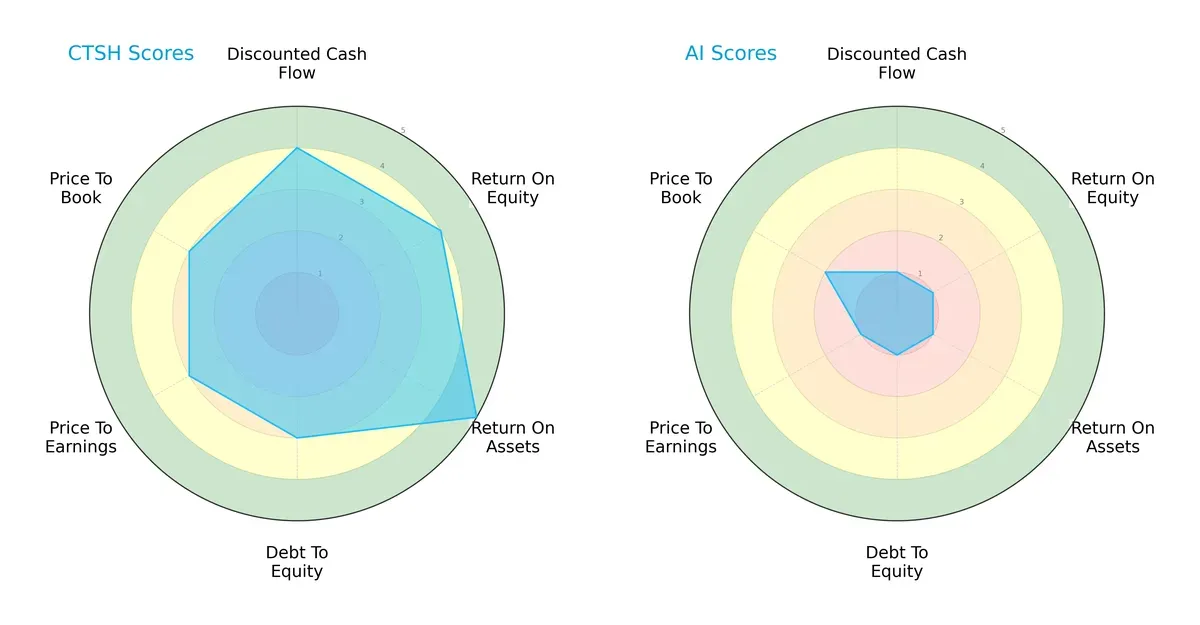
Cognizant demonstrates a balanced profile with strong ROA (5) and solid DCF (4) and ROE (4) scores, indicating efficient asset use and shareholder returns. Its moderate debt-to-equity (3) and valuation metrics (PE and PB at 3) signal controlled financial risk and fair pricing. Conversely, C3.ai suffers across all metrics, scoring very low (1 or 2), relying on no specific edge and showing pronounced financial and valuation weaknesses. Cognizant’s profile is clearly more resilient and well-rounded.
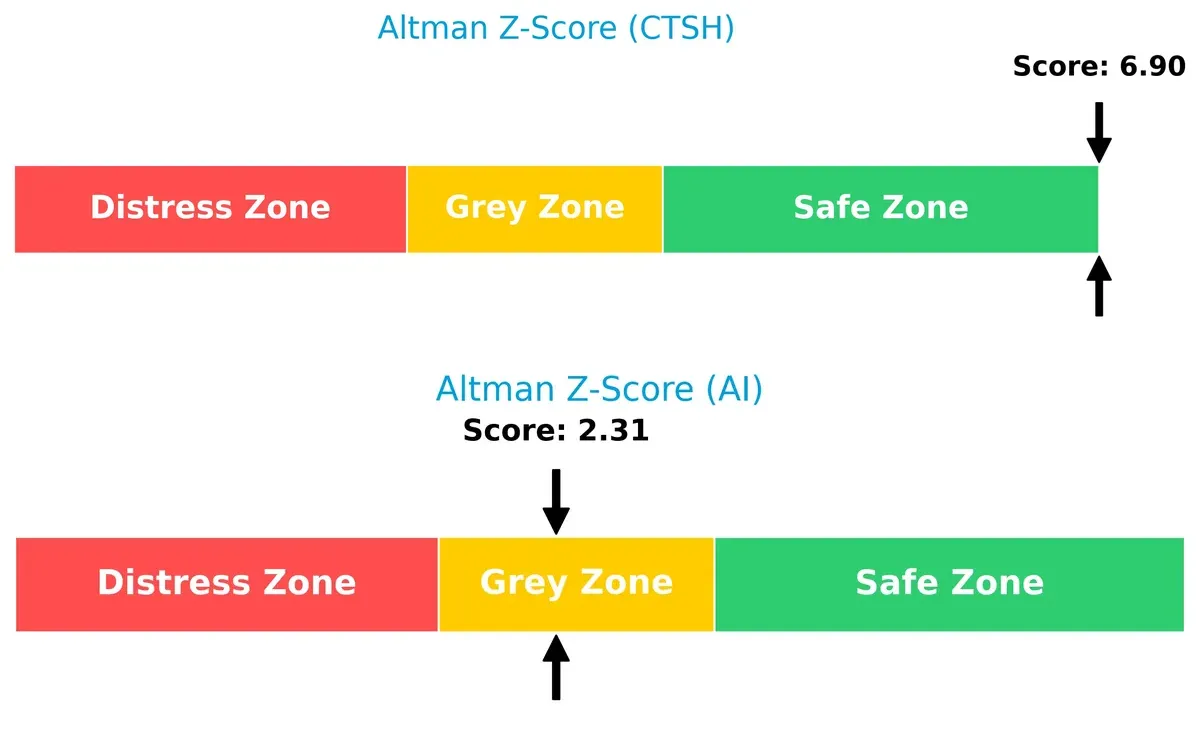
Bankruptcy Risk: Solvency Showdown
Cognizant’s Altman Z-Score of 6.9 places it decisively in the safe zone, reflecting a robust buffer against bankruptcy. C3.ai’s score of 2.3 falls into the grey zone, signaling elevated financial distress risk in this volatile cycle:
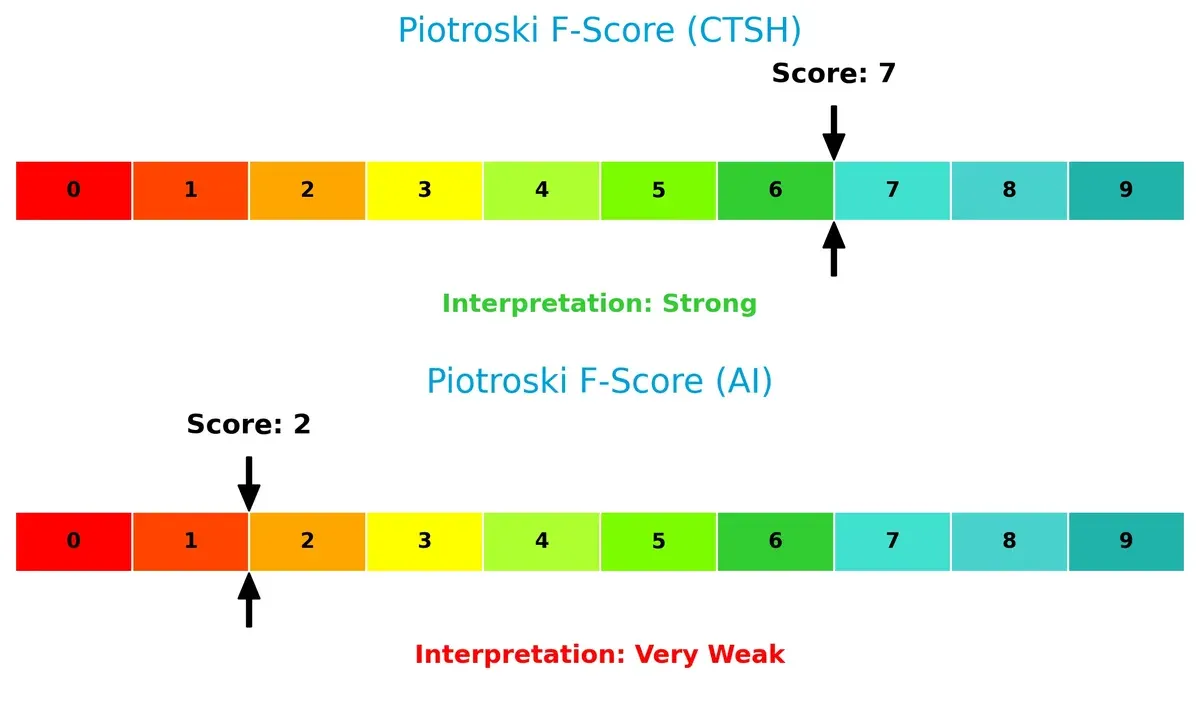
Financial Health: Quality of Operations
Cognizant’s Piotroski F-Score of 7 indicates strong financial health with solid profitability and operational efficiency. In contrast, C3.ai’s score of 2 raises red flags, suggesting weak internal metrics and potential financial instability:
How are the two companies positioned?
This section dissects the operational DNA of Cognizant and C3.ai by comparing their revenue distribution and internal dynamics, including strengths and weaknesses. The objective is to confront their economic moats and reveal which model offers a more resilient, sustainable competitive advantage in today’s market.
Revenue Segmentation: The Strategic Mix
This visual comparison dissects how Cognizant Technology Solutions Corporation and C3.ai diversify their income streams and where their primary sector bets lie:
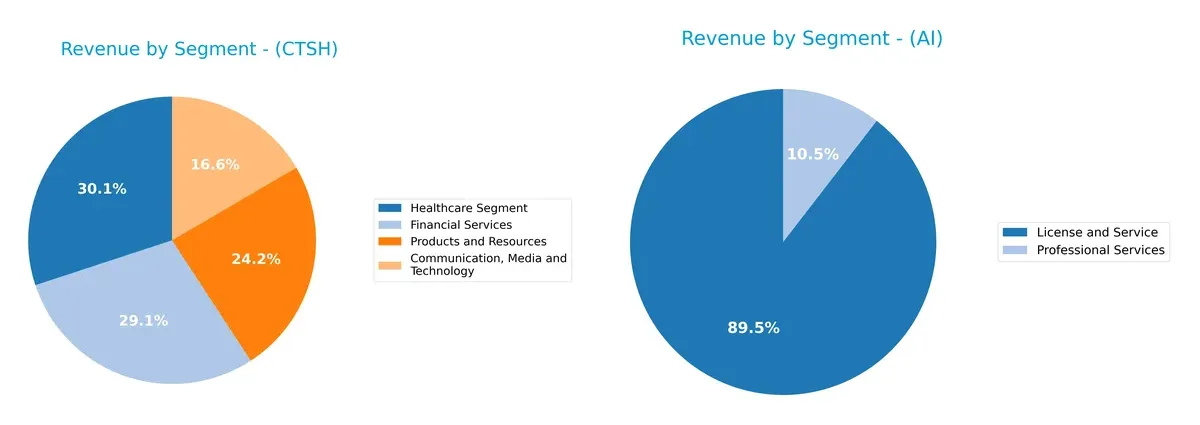
Cognizant boasts a broad revenue base with major segments like Healthcare ($5.9B), Financial Services ($5.7B), and Products ($4.8B), showcasing strong diversification. In contrast, C3.ai relies heavily on License and Service ($278M), with Professional Services trailing at $32M. Cognizant’s mix reduces concentration risk and leverages multiple industry ecosystems. C3.ai’s focus signals dependency on software licensing, anchoring growth but exposing it to sector-specific volatility.
Strengths and Weaknesses Comparison
This table compares the Strengths and Weaknesses of Cognizant Technology Solutions Corporation (CTSH) and C3.ai, Inc. (AI):
CTSH Strengths
- Diversified revenue across Communication, Financial Services, Healthcare, and Products segments
- Strong global presence with major revenue from North America and Europe
- Favorable net margin at 10.56%
- Low debt-to-assets ratio and high interest coverage ratio
- Established market share in multiple industries
AI Strengths
- Favorable quick ratio indicating strong liquidity management
- Low debt-to-assets ratio and low debt-to-equity level
- High fixed asset turnover signals efficient use of fixed assets
- Growing License and Service revenue stream
- Focused revenue in technology services with expanding geographic reach
CTSH Weaknesses
- Unfavorable ROE and ROIC at 0%, indicating low capital efficiency
- Unavailable WACC data limits cost of capital assessment
- Unfavorable current and quick ratios raise liquidity concerns
- Asset turnover metrics unfavorable, signaling asset utilization issues
- Slightly unfavorable overall financial ratios
AI Weaknesses
- Negative net margin (-74.21%) and ROE (-34.44%) indicate sustained losses
- Unfavorable WACC at 13.23% suggesting higher capital costs
- High P/B ratio at 3.39 may reflect overvaluation risk
- Unfavorable interest coverage of 0 indicates inability to cover interest expenses
- Unfavorable current ratio despite favorable quick ratio suggests working capital imbalance
- No dividend yield
Overall, CTSH shows a broad diversification and better profitability metrics but struggles with capital efficiency and liquidity ratios. AI displays liquidity strengths and asset efficiency but faces significant profitability and valuation challenges. These factors reflect contrasting strategic positions and operational risks for both companies.
The Moat Duel: Analyzing Competitive Defensibility
A structural moat is the only durable shield protecting long-term profits from relentless competition erosion. Let’s dissect the moats of two IT services firms:
Cognizant Technology Solutions Corporation: Diversified Services & Client Stickiness
Cognizant’s moat stems from high switching costs across complex IT outsourcing contracts, reflected in steady 17% EBIT margins and 33.7% gross margins. Its broad global footprint and expanding digital offerings could deepen this moat in 2026.
C3.ai, Inc.: Cutting-Edge AI Platform Innovation
C3.ai relies on intangible assets and network effects from its AI software platform, driving rapid 25% revenue growth but negative EBIT margins reflect heavy reinvestment. Its moat is narrower but potentially disruptive if it scales AI adoption across industries.
Client Relationships vs. Platform Innovation: Who Defends Better?
Cognizant’s wide moat benefits from stable cash flows and diversified client base, while C3.ai’s innovation moat is narrower and unprofitable. I see Cognizant better equipped to defend market share amid intensifying competition.
Which stock offers better returns?
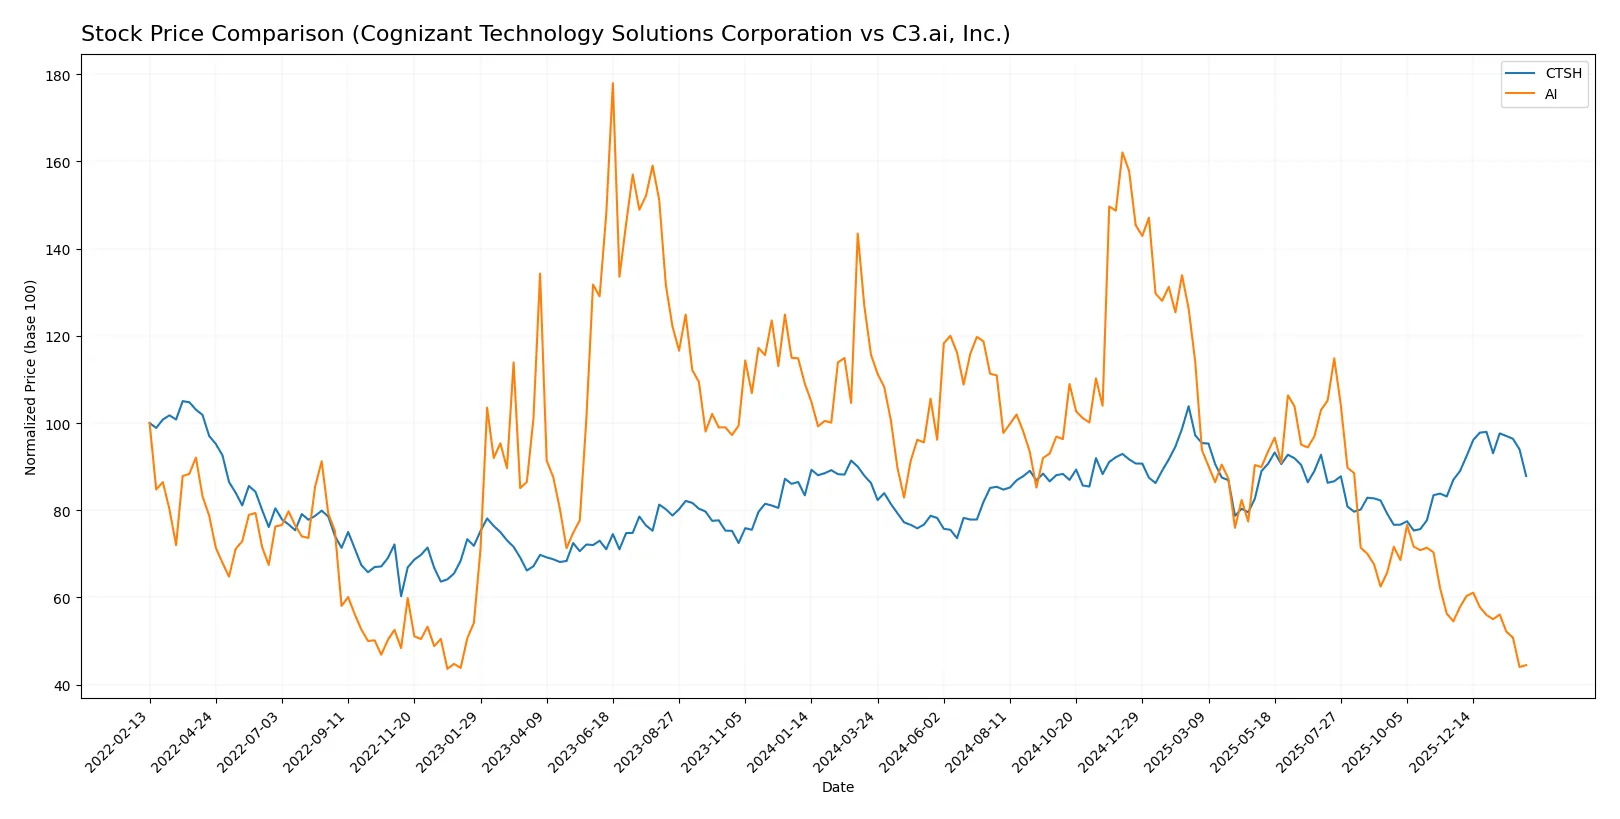
Over the past year, Cognizant Technology Solutions showed mild price appreciation with accelerating momentum, while C3.ai experienced a steep decline and slowing negative trend.
Trend Comparison
Cognizant Technology Solutions recorded a 1.83% price increase over 12 months, indicating a bullish trend with accelerating gains and a high of 90.7, low of 64.26.
C3.ai’s stock fell sharply by 61.58% over the same period, confirming a bearish trend with decelerating losses and a range between 40.52 and 11.01.
Cognizant Technology Solutions outperformed C3.ai, delivering the highest market performance with steady upward momentum versus a severe downtrend.
Target Prices
Analysts present a clear target price consensus for Cognizant Technology Solutions Corporation and C3.ai, Inc.
| Company | Target Low | Target High | Consensus |
|---|---|---|---|
| Cognizant Technology Solutions Corporation | 82 | 107 | 94.44 |
| C3.ai, Inc. | 10 | 16 | 12.33 |
The consensus target prices suggest upside potential for both stocks versus current prices: Cognizant trades at $76.71, well below its $94.44 consensus, while C3.ai at $11.11 lags slightly behind its $12.33 consensus. This implies moderate analyst optimism for both names.

Don’t Let Luck Decide Your Entry Point
Optimize your entry points with our advanced ProRealTime indicators. You’ll get efficient buy signals with precise price targets for maximum performance. Start outperforming now!
How do institutions grade them?
Cognizant Technology Solutions Corporation Grades
Here are the recent institutional grades assigned to Cognizant Technology Solutions Corporation:
| Grading Company | Action | New Grade | Date |
|---|---|---|---|
| Guggenheim | Maintain | Buy | 2026-01-28 |
| Citigroup | Maintain | Neutral | 2026-01-22 |
| Wells Fargo | Maintain | Overweight | 2026-01-14 |
| TD Cowen | Maintain | Hold | 2026-01-09 |
| UBS | Maintain | Neutral | 2025-12-08 |
| William Blair | Upgrade | Outperform | 2025-11-21 |
| UBS | Maintain | Neutral | 2025-10-30 |
| Wells Fargo | Maintain | Overweight | 2025-10-30 |
| RBC Capital | Maintain | Sector Perform | 2025-10-30 |
| JP Morgan | Maintain | Overweight | 2025-10-30 |
C3.ai, Inc. Grades
Here are the recent institutional grades assigned to C3.ai, Inc.:
| Grading Company | Action | New Grade | Date |
|---|---|---|---|
| Canaccord Genuity | Maintain | Hold | 2025-12-04 |
| DA Davidson | Maintain | Underperform | 2025-12-04 |
| Wedbush | Maintain | Outperform | 2025-12-04 |
| Needham | Maintain | Hold | 2025-12-04 |
| UBS | Maintain | Neutral | 2025-09-12 |
| Morgan Stanley | Maintain | Underweight | 2025-09-09 |
| Canaccord Genuity | Maintain | Hold | 2025-09-05 |
| UBS | Maintain | Neutral | 2025-09-04 |
| JMP Securities | Maintain | Market Outperform | 2025-09-04 |
| Keybanc | Maintain | Underweight | 2025-09-04 |
Which company has the best grades?
Cognizant Technology Solutions Corporation consistently received positive grades, including Buy and Outperform ratings. C3.ai, Inc. shows mixed ratings, with several Hold and Underperform grades. Cognizant’s stronger grades suggest more institutional confidence, potentially influencing investor sentiment favorably.
Risks specific to each company
The following categories identify the critical pressure points and systemic threats facing both firms in the 2026 market environment:
1. Market & Competition
Cognizant Technology Solutions Corporation
- Established with diversified IT services; faces intense competition from global consulting giants.
C3.ai, Inc.
- Niche AI software provider with high innovation but strong competition from large cloud and AI firms.
2. Capital Structure & Debt
Cognizant Technology Solutions Corporation
- Low debt-to-equity ratio and strong interest coverage indicate solid financial stability.
C3.ai, Inc.
- Minimal debt but weak interest coverage, signaling risk if revenues don’t improve.
3. Stock Volatility
Cognizant Technology Solutions Corporation
- Beta near 0.95 suggests moderate sensitivity to market swings.
C3.ai, Inc.
- High beta near 2 implies significant price volatility and investor risk.
4. Regulatory & Legal
Cognizant Technology Solutions Corporation
- Operates globally with exposure to data privacy and outsourcing regulations.
C3.ai, Inc.
- Emerging AI regulations could impact product deployment and client contracts.
5. Supply Chain & Operations
Cognizant Technology Solutions Corporation
- Large workforce and service complexity require robust operational management.
C3.ai, Inc.
- Smaller team and cloud-based model reduce supply chain risk but rely heavily on tech partners.
6. ESG & Climate Transition
Cognizant Technology Solutions Corporation
- Increasing focus on sustainable IT services and digital health solutions.
C3.ai, Inc.
- AI solutions may enable clients’ climate goals, but company ESG disclosures are limited.
7. Geopolitical Exposure
Cognizant Technology Solutions Corporation
- Diversified international presence exposes it to geopolitical tensions and currency risks.
C3.ai, Inc.
- Global reach but smaller scale may limit geopolitical risk compared to larger peers.
Which company shows a better risk-adjusted profile?
Cognizant’s primary risk is operational complexity amid global competition. C3.ai’s biggest threat lies in its weak profitability and volatile stock. Cognizant displays a stronger risk-adjusted profile supported by a safe Altman Z-Score of 6.9 and solid Piotroski score of 7. Meanwhile, C3.ai lingers in the grey zone on bankruptcy risk with a low Piotroski score of 2. The stark contrast in financial health and stability justifies caution toward C3.ai despite its innovation edge.
Final Verdict: Which stock to choose?
Cognizant Technology Solutions Corporation (CTSH) shines with its reliable cash-generation engine and steady operational efficiency. Its main point of vigilance lies in a slightly declining return on invested capital, which could pressure future growth. CTSH suits portfolios seeking stable, income-generating exposure with moderate growth ambitions.
C3.ai, Inc. (AI) boasts a strategic moat in AI-driven innovation and high gross margins, reflecting strong potential market disruption. However, its current financial instability and persistent losses present a significant risk compared to CTSH’s steadiness. AI fits best with high-risk, high-reward growth portfolios willing to endure volatility.
If you prioritize dependable cash flow and proven profitability, CTSH is the compelling choice due to its robust financial health and favorable rating scores. However, if you seek aggressive growth and can tolerate financial uncertainty, AI offers superior revenue growth potential and exposure to cutting-edge AI technologies, albeit with a value-destroying track record.
Disclaimer: Investment carries a risk of loss of initial capital. The past performance is not a reliable indicator of future results. Be sure to understand risks before making an investment decision.
Go Further
I encourage you to read the complete analyses of Cognizant Technology Solutions Corporation and C3.ai, Inc. to enhance your investment decisions: