In the fast-evolving technology sector, CDW Corporation and C3.ai, Inc. stand out as key players offering distinct yet overlapping IT services. CDW focuses on comprehensive IT solutions across hardware and software, while C3.ai pioneers enterprise artificial intelligence applications. Their shared industry and innovation-driven strategies make them compelling candidates for comparison. This article will help you decide which company presents the most promising investment opportunity in 2026.

Table of contents
Companies Overview
I will begin the comparison between CDW Corporation and C3.ai, Inc. by providing an overview of these two companies and their main differences.
CDW Corporation Overview
CDW Corporation delivers information technology (IT) solutions across the United States, the United Kingdom, and Canada. It serves corporate, small business, and public sectors by offering hardware, software, and integrated IT solutions including cloud, data center, and security services. Founded in 1984 and headquartered in Vernon Hills, Illinois, CDW is a well-established player with 15,100 employees and a market cap of $17.2B.
C3.ai, Inc. Overview
C3.ai, Inc. is an enterprise artificial intelligence (AI) software company operating globally with a focus on providing AI platforms and applications. The company offers solutions for various industries including oil and gas, manufacturing, and financial services. Founded in 2009 and headquartered in Redwood City, California, C3.ai employs 891 people and has a market cap of $1.9B, reflecting its specialized niche in AI software.
Key similarities and differences
Both CDW and C3.ai operate within the technology sector and provide IT-related services, but their business models differ significantly. CDW focuses on delivering a broad range of IT hardware and software solutions along with related services to diverse markets, while C3.ai specializes in AI software platforms and industry-specific AI applications. CDW has a much larger workforce and market capitalization, reflecting its broader scope and established presence compared to the more focused and smaller C3.ai.
Income Statement Comparison
Below is a comparison of key income statement metrics for CDW Corporation and C3.ai, Inc. based on their most recent fiscal year results.

| Metric | CDW Corporation | C3.ai, Inc. |
|---|---|---|
| Market Cap | 17.2B | 1.9B |
| Revenue | 21.0B | 389M |
| EBITDA | 1.93B | -312M |
| EBIT | 1.65B | -324M |
| Net Income | 1.08B | -289M |
| EPS | 8.06 | -2.24 |
| Fiscal Year | 2024 | 2025 |
Income Statement Interpretations
CDW Corporation
From 2020 to 2024, CDW Corporation saw overall revenue growth of 13.7% and net income growth of 36.7%, with gross margin steady around 21.9%. However, in the most recent year, revenue and net income declined slightly by 1.8% and 0.7% respectively. Margins remain favorable, with net margin at 5.13%, indicating resilience despite recent slowdowns.
C3.ai, Inc.
C3.ai experienced strong revenue growth of 112.4% over the 2021-2025 period, with a 25.3% increase in the last year. Gross margin is high at 60.6%, but the company reported significant net losses, with net margin at -74.2%. While recent EPS and net margin improved, overall net income declined sharply, reflecting ongoing profitability challenges.
Which one has the stronger fundamentals?
CDW Corporation exhibits stronger fundamentals with consistent profitability, positive net income growth, and stable margins despite recent minor declines. C3.ai shows impressive revenue expansion but faces persistent losses and negative net margins. CDW’s balanced financials contrast with C3.ai’s high growth yet unprofitable profile, highlighting their different risk and return profiles.
Financial Ratios Comparison
Below is a comparison of key financial ratios for CDW Corporation and C3.ai, Inc. based on the most recent fiscal year data available.
| Ratios | CDW Corporation (2024) | C3.ai, Inc. (2025) |
|---|---|---|
| ROE | 45.8% | -34.4% |
| ROIC | 13.1% | -36.1% |
| P/E | 21.6 | -9.8 |
| P/B | 9.90 | 3.39 |
| Current Ratio | 1.35 | 6.86 |
| Quick Ratio | 1.24 | 6.86 |
| D/E | 2.55 | 0.006 |
| Debt-to-Assets | 40.8% | 0.47% |
| Interest Coverage | 7.70 | 0 |
| Asset Turnover | 1.43 | 0.38 |
| Fixed Asset Turnover | 67.3 | 4.91 |
| Payout ratio | 30.8% | 0% |
| Dividend yield | 1.43% | 0% |
Interpretation of the Ratios
CDW Corporation
CDW shows a balanced financial profile with half of its key ratios rated favorable, including a strong return on equity (45.81%) and return on invested capital (13.13%). Areas like price-to-book and debt-to-equity ratios raise some concern. The company pays dividends with a moderate yield of 1.43%, supported by stable free cash flow, but investors should watch payout sustainability.
C3.ai, Inc.
C3.ai’s ratios reveal financial challenges, with significant unfavorable metrics such as a negative net margin (-74.21%) and return on equity (-34.44%). Despite a favorable price-to-earnings ratio, the absence of dividend payments reflects its ongoing reinvestment and growth strategy. Its low debt level contrasts with weak asset turnover and no interest coverage.
Which one has the best ratios?
CDW Corporation holds the advantage with a slightly favorable overall ratio profile, marked by strong profitability and moderate risk indicators. In contrast, C3.ai faces considerable financial headwinds, reflected in mostly unfavorable ratios and negative returns, underscoring a riskier position despite some positive liquidity and leverage metrics.
Strategic Positioning
This section compares the strategic positioning of CDW Corporation and C3.ai, Inc. in terms of Market position, Key segments, and Exposure to technological disruption:
CDW Corporation
- Established leader in IT solutions with broad geographic presence and scale.
- Diverse revenue from hardware, software products, and IT services segments.
- Moderate exposure; offers integrated IT solutions including cloud and security.
C3.ai, Inc.
- Emerging enterprise AI software provider with global reach but smaller scale.
- Focused on AI software licenses and professional services across industries.
- High exposure; specializes in enterprise AI applications and advanced analytics.
CDW Corporation vs C3.ai, Inc. Positioning
CDW pursues a diversified approach with multiple product lines and customer sectors, enabling broader market coverage but facing competitive pressure in hardware. C3.ai concentrates on AI software, offering specialized solutions, yet faces challenges in scaling profitability.
Which has the best competitive advantage?
CDW exhibits a slightly favorable moat with value creation despite declining profitability, indicating some competitive advantage. C3.ai has a very unfavorable moat, shedding value amid declining returns, reflecting weaker competitive positioning.
Stock Comparison
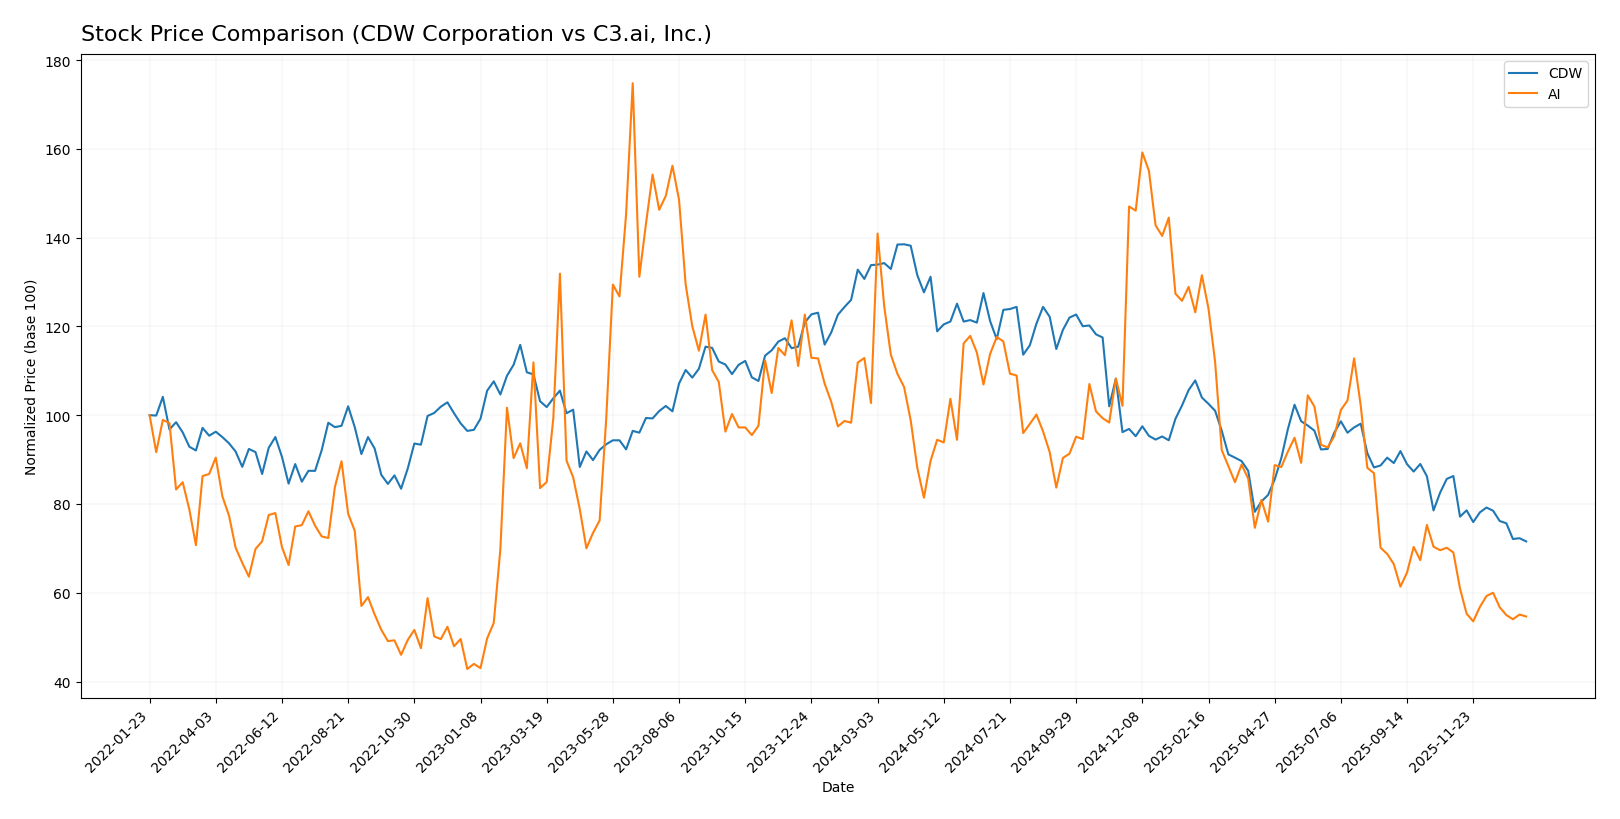
The stock prices of CDW Corporation and C3.ai, Inc. have both experienced significant declines over the past 12 months, reflecting bearish trends with decelerating momentum and notable differences in volatility and volume dynamics.
Trend Analysis
CDW Corporation’s stock price fell by 46.52% over the past year, indicating a bearish trend with deceleration. The price ranged from a high of 255.78 to a low of 132.16, showing elevated volatility with a standard deviation of 33.89.
C3.ai, Inc. recorded a 46.81% decline over the same period, also bearish with deceleration. The price fluctuated between 40.52 and 13.63, with lower volatility than CDW, reflected in a 6.29 standard deviation.
Comparing both stocks, CDW and C3.ai delivered similar market performance declines, with neither outperforming; both experienced significant losses and bearish trends over the past year.
Target Prices
Analyst consensus presents moderate upside potential for both CDW Corporation and C3.ai, Inc.
| Company | Target High | Target Low | Consensus |
|---|---|---|---|
| CDW Corporation | 190 | 148 | 175 |
| C3.ai, Inc. | 16 | 11 | 13.5 |
For CDW, the consensus target of 175 suggests a significant upside from the current 132.16 stock price, indicating positive analyst sentiment. C3.ai’s consensus target of 13.5 is slightly below its current price of 13.91, signaling more cautious expectations.
Analyst Opinions Comparison
This section compares analysts’ ratings and grades for CDW Corporation and C3.ai, Inc.:
Rating Comparison
CDW Rating
- Rating: B, evaluated as Very Favorable by analysts.
- Discounted Cash Flow Score: 4, indicating Favorable valuation based on future cash flows.
- ROE Score: 5, a Very Favorable indicator of profit generation efficiency.
- ROA Score: 4, Favorable use of assets to generate earnings.
- Debt To Equity Score: 1, marked as Very Unfavorable, implying higher financial risk.
- Overall Score: 3, considered Moderate in overall financial standing.
AI Rating
- Rating: D+, also considered Very Favorable by analysts.
- Discounted Cash Flow Score: 1, showing a Very Unfavorable valuation.
- ROE Score: 1, reflecting Very Unfavorable efficiency in generating profit.
- ROA Score: 1, indicating Very Unfavorable asset utilization.
- Debt To Equity Score: 1, also Very Unfavorable, suggesting similar financial risk.
- Overall Score: 1, classified as Very Unfavorable overall.
Which one is the best rated?
Based strictly on the provided data, CDW holds higher ratings and stronger scores in discounted cash flow, ROE, and ROA compared to AI. Both have equally unfavorable debt-to-equity scores, but CDW’s overall score is significantly better than AI’s.
Scores Comparison
Here is a comparison of the Altman Z-Score and Piotroski Score for CDW and C3.ai:
CDW Scores
- Altman Z-Score: 2.68, positioned in the grey zone, indicating moderate bankruptcy risk.
- Piotroski Score: 6, classified as average financial strength.
AI Scores
- Altman Z-Score: 3.59, in the safe zone, indicating low bankruptcy risk.
- Piotroski Score: 2, classified as very weak financial strength.
Which company has the best scores?
Based strictly on the scores, AI has a better Altman Z-Score indicating lower bankruptcy risk, while CDW has a stronger Piotroski Score reflecting better financial strength. Each company leads in a different score metric.
Grades Comparison
Here is a comparison of the latest grades assigned to CDW Corporation and C3.ai, Inc.:
CDW Corporation Grades
The following table summarizes recent grades from reputable financial institutions for CDW Corporation:
| Grading Company | Action | New Grade | Date |
|---|---|---|---|
| Morgan Stanley | Maintain | Overweight | 2025-12-17 |
| Raymond James | Upgrade | Strong Buy | 2025-11-25 |
| Barclays | Maintain | Equal Weight | 2025-11-05 |
| UBS | Maintain | Buy | 2025-11-05 |
| Evercore ISI Group | Maintain | Outperform | 2025-10-20 |
| UBS | Maintain | Buy | 2025-08-07 |
| Barclays | Maintain | Equal Weight | 2025-08-07 |
| JP Morgan | Maintain | Neutral | 2025-07-17 |
| Citigroup | Maintain | Neutral | 2025-07-11 |
| Barclays | Maintain | Equal Weight | 2025-05-08 |
Overall, CDW Corporation’s grades show a positive trend, with multiple buy and outperform ratings, including an upgrade to Strong Buy from Raymond James.
C3.ai, Inc. Grades
The following table summarizes recent grades from reputable financial institutions for C3.ai, Inc.:
| Grading Company | Action | New Grade | Date |
|---|---|---|---|
| Canaccord Genuity | Maintain | Hold | 2025-12-04 |
| Wedbush | Maintain | Outperform | 2025-12-04 |
| Needham | Maintain | Hold | 2025-12-04 |
| DA Davidson | Maintain | Underperform | 2025-12-04 |
| UBS | Maintain | Neutral | 2025-09-12 |
| Morgan Stanley | Maintain | Underweight | 2025-09-09 |
| Canaccord Genuity | Maintain | Hold | 2025-09-05 |
| Needham | Maintain | Hold | 2025-09-04 |
| Keybanc | Maintain | Underweight | 2025-09-04 |
| JMP Securities | Maintain | Market Outperform | 2025-09-04 |
C3.ai’s grades indicate a mixed to cautious stance with several hold and underperform ratings, alongside a few outperform opinions.
Which company has the best grades?
CDW Corporation has received stronger grades overall, including multiple buy and outperform ratings, whereas C3.ai, Inc. shows a more mixed consensus with several hold and underweight ratings. This difference may reflect varying market confidence levels and risk perceptions for investors.
Strengths and Weaknesses
The table below compares the key strengths and weaknesses of CDW Corporation and C3.ai, Inc. based on recent financial performance, market presence, and innovation metrics.
| Criterion | CDW Corporation | C3.ai, Inc. |
|---|---|---|
| Diversification | High: Broad hardware, software, and services portfolio with $15.2B hardware and $3.8B software in 2024 | Moderate: Focused on AI software and professional services, $278M license and service revenue in 2024 |
| Profitability | Favorable: ROIC 13.13%, ROE 45.81%, net margin 5.13%, value creator with slightly declining ROIC | Unfavorable: Negative ROIC (-36.1%), net margin -74.21%, value destroyer with sharply declining ROIC |
| Innovation | Moderate: Steady growth in software products, but core business relies heavily on hardware sales | High: Pure AI software company with growth potential but currently unprofitable and high volatility |
| Global presence | Strong: Large hardware and service distribution across private and public sectors in North America | Limited: Primarily software licensing and services with less global scale |
| Market Share | Large: Significant share in IT hardware and software distribution markets | Small: Emerging player in AI software market |
CDW Corporation shows strength in diversification and profitability with a robust presence in hardware and software markets, although its profitability is slightly declining. C3.ai presents high innovation potential but suffers from severe profitability issues and a very unfavorable financial outlook, indicating higher investment risk.
Risk Analysis
Below is a table summarizing key risks for CDW Corporation and C3.ai, Inc. as of the most recent fiscal years.
| Metric | CDW Corporation | C3.ai, Inc. |
|---|---|---|
| Market Risk | Moderate beta at 1.07, sensitive to IT sector fluctuations | High beta at 1.96, very sensitive to market volatility |
| Debt level | High debt-to-equity at 2.55, debt-to-assets 40.8% (neutral) | Very low debt-to-equity at 0.01, minimal leverage |
| Regulatory Risk | Moderate, operates primarily in stable US/UK/Canada markets | Higher, due to AI software in regulated sectors globally |
| Operational Risk | Diversified IT services reduce risk, but reliance on third-party providers | High, dependent on technology innovation and strategic partnerships |
| Environmental Risk | Moderate, limited direct environmental impact | Low, software business with minimal environmental footprint |
| Geopolitical Risk | Moderate, exposure to North America and UK | Elevated, global operations including geopolitically sensitive regions |
The most impactful risks are CDW’s elevated debt level, which increases financial vulnerability despite stable cash flows, and C3.ai’s high market sensitivity combined with operational risks linked to fast-evolving AI technology and global regulatory environments. Investors should weigh CDW’s financial leverage against its steady business model, while C3.ai’s volatility and weak profitability metrics signal higher risk despite growth potential.
Which Stock to Choose?
CDW Corporation shows a favorable income statement with a 13.7% revenue growth overall and 36.7% net income growth over 2020-2024, supported by a strong ROE of 45.8% and a slightly favorable rating. Its debt level is moderate with a net debt to EBITDA of 2.85, and it holds a slightly favorable moat status despite a declining ROIC trend.
C3.ai, Inc. exhibits rapid revenue growth of 112.4% over 2021-2025 but suffers from negative profitability metrics including a -74.2% net margin and a very unfavorable global ratios evaluation. It maintains low debt levels and a very unfavorable moat rating, with a safe zone Altman Z-score but a weak Piotroski score indicating financial challenges.
Investors with a risk-tolerant or growth-focused profile might find C3.ai’s high revenue expansion appealing, despite its unfavorable profitability and financial ratios. Conversely, those prioritizing stability and consistent value creation may view CDW’s favorable income growth and solid financial metrics as more indicative of sustainable performance.
Disclaimer: Investment carries a risk of loss of initial capital. The past performance is not a reliable indicator of future results. Be sure to understand risks before making an investment decision.
Go Further
I encourage you to read the complete analyses of CDW Corporation and C3.ai, Inc. to enhance your investment decisions: