Home > Comparison > Industrials > CHRW vs JBHT
The strategic rivalry between C.H. Robinson Worldwide, Inc. and J.B. Hunt Transport Services, Inc. shapes the landscape of the integrated freight and logistics sector. C.H. Robinson operates as a capital-light logistics broker with expansive carrier partnerships, while J.B. Hunt runs a capital-intensive, asset-heavy transportation network. This analysis pits a flexible service model against a fleet-dominant approach to identify which offers superior risk-adjusted returns for diversified portfolios in 2026.
Table of contents
Companies Overview
C.H. Robinson and J.B. Hunt stand as pivotal players in North America’s integrated freight and logistics sector.
C.H. Robinson Worldwide, Inc.: Global Freight & Logistics Solutions Leader
C.H. Robinson dominates as a provider of freight transportation and logistics services globally. Its core revenue stems from brokerage services across truckload, intermodal, and ocean freight. In 2026, the company strategically emphasizes expanding its managed transportation services, leveraging a network of 85,000 carriers to sustain its competitive advantage in supply chain efficiency.
J.B. Hunt Transport Services, Inc.: Diverse Surface Transportation Specialist
J.B. Hunt leads with a broad surface transportation portfolio, including intermodal, dedicated contract, and final mile services. The company’s revenue engine relies heavily on owning and operating large fleets of trucks and trailers. In 2026, J.B. Hunt focuses on scaling integrated capacity solutions and technology-driven logistics to enhance fleet utilization and customer service.
Strategic Collision: Similarities & Divergences
Both firms compete fiercely in freight brokerage and intermodal transport, yet their philosophies diverge. C.H. Robinson leans on an asset-light, broker-centric model, while J.B. Hunt invests substantially in physical fleet assets. Their primary battleground is optimizing network efficiency and customer integration. This distinction crafts contrasting investment profiles: asset-light scalability versus asset-heavy operational control.
Income Statement Comparison
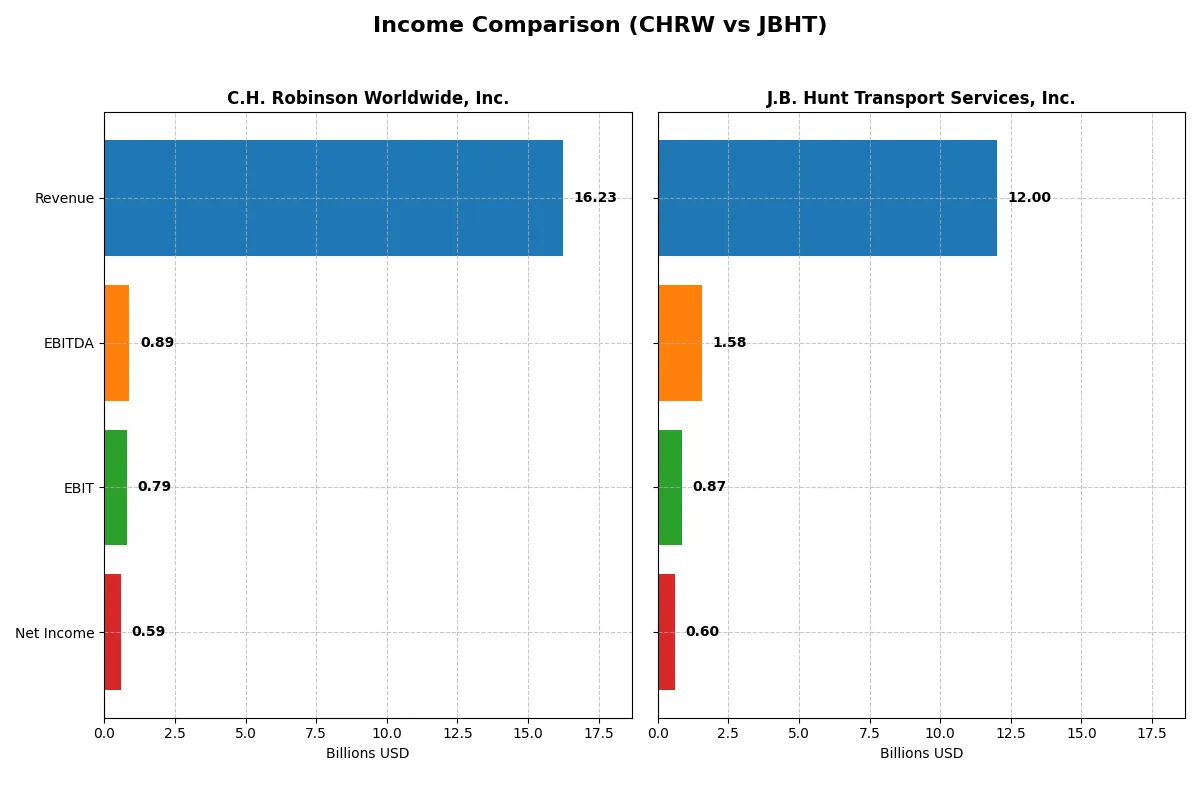
This data dissects the core profitability and scalability of both corporate engines to reveal who dominates the bottom line:
| Metric | C.H. Robinson Worldwide, Inc. (CHRW) | J.B. Hunt Transport Services, Inc. (JBHT) |
|---|---|---|
| Revenue | 16.2B | 12.0B |
| Cost of Revenue | 14.9B | 10.7B |
| Operating Expenses | 564M | 397M |
| Gross Profit | 1.36B | 1.26B |
| EBITDA | 888M | 1.58B |
| EBIT | 786M | 865M |
| Interest Expense | 63M | 71M |
| Net Income | 587M | 598M |
| EPS | 4.88 | 6.12 |
| Fiscal Year | 2025 | 2025 |
Income Statement Analysis: The Bottom-Line Duel
This income statement comparison reveals the true efficiency and profitability of two leading logistics companies over recent years.
C.H. Robinson Worldwide, Inc. Analysis
C.H. Robinson’s revenue declined notably over 2021-2025, dropping nearly 30%. Yet, net income bounced back sharply in 2025 with a 26% EPS jump, reflecting operational leverage. Gross margin remained stable near 8.4%, while net margin improved to 3.6%, signaling improved cost control despite top-line pressure.
J.B. Hunt Transport Services, Inc. Analysis
J.B. Hunt posted a flatter revenue trend, dipping just 1.4% overall but suffered a steep gross profit drop in 2025. EBIT margin held firm at 7.2%, supporting a net margin near 5%. Though EPS grew 10% in the last year, overall profitability weakened, driven by margin compression and volatile cost structures.
Margin Resilience vs. Revenue Contraction
C.H. Robinson shows stronger margin momentum despite shrinking revenues, improving bottom-line efficiency. J.B. Hunt maintains higher margins but faces more volatile gross profits and slower growth. For investors prioritizing margin recovery and earnings growth amid revenue headwinds, C.H. Robinson’s profile offers a more compelling fundamental trajectory.
Financial Ratios Comparison
These vital ratios act as a diagnostic tool to expose the underlying fiscal health, valuation premiums, and capital efficiency of the companies compared below:
| Ratios | C.H. Robinson Worldwide, Inc. (CHRW) | J.B. Hunt Transport Services, Inc. (JBHT) |
|---|---|---|
| ROE | 27.0% | 0% |
| ROIC | 15.4% | 0% |
| P/E | 26.6 | 31.7 |
| P/B | 7.19 | 0 |
| Current Ratio | 1.28 | 0 |
| Quick Ratio | 1.28 | 0 |
| D/E (Debt-to-Equity) | 1.01 | 0 |
| Debt-to-Assets | 32.9% | 0% |
| Interest Coverage | 7.44 | 12.19 |
| Asset Turnover | 3.35 | 0 |
| Fixed Asset Turnover | 38.37 | 0 |
| Payout ratio | 63.3% | 28.7% |
| Dividend yield | 2.38% | 0.91% |
| Fiscal Year | 2024 | 2025 |
Efficiency & Valuation Duel: The Vital Signs
Financial ratios serve as a company’s DNA, exposing hidden risks and operational strength behind headline figures.
C.H. Robinson Worldwide, Inc.
C.H. Robinson displays a robust 27% ROE and a solid 15% ROIC, signaling efficient capital use and shareholder value creation. However, its P/E of 26.6 suggests a slightly stretched valuation, while a 2.38% dividend yield rewards investors steadily. The company balances growth with disciplined returns.
J.B. Hunt Transport Services, Inc.
J.B. Hunt shows a weaker profitability profile with a 0% ROE and no reported ROIC, reflecting recent challenges. Its P/E of 31.7 indicates an expensive stock relative to earnings. Dividend yield is low at 0.91%, and limited reinvestment data clouds its growth strategy visibility.
Valuation Stretch vs. Operational Efficiency
C.H. Robinson offers superior operational metrics and a meaningful dividend, offsetting a somewhat high valuation. J.B. Hunt’s higher valuation lacks matching profitability, increasing risk. Investors prioritizing stable returns and operational strength may find C.H. Robinson’s profile more appealing.
Which one offers the Superior Shareholder Reward?
I observe that C.H. Robinson (CHRW) yields 2.38% with a payout ratio near 63%, supported by robust free cash flow covering 96% of dividends. Its buyback program, though modest, complements returns. J.B. Hunt (JBHT) offers a smaller 0.9% yield and a lower payout ratio around 29%, reinvesting heavily in capex and growth, but free cash flow coverage is erratic. Historically, CHRW’s steady dividends plus buybacks provide a sustainable model. JBHT’s aggressive reinvestment may fuel growth, yet risks dilute near-term returns. I conclude CHRW delivers a superior total shareholder reward in 2026.
Comparative Score Analysis: The Strategic Profile
The radar chart reveals the fundamental DNA and trade-offs of C.H. Robinson and J.B. Hunt, highlighting their financial strengths and valuation nuances:
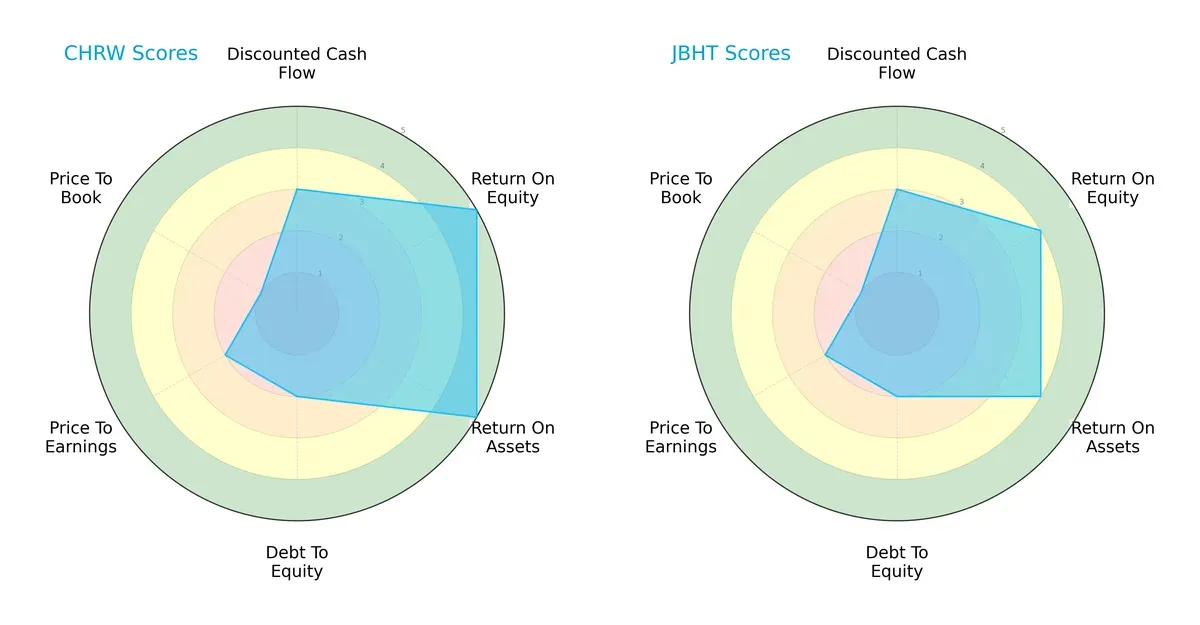
C.H. Robinson boasts superior returns on equity (5 vs. 4) and assets (5 vs. 4), underscoring operational efficiency. Both firms share moderate discounted cash flow and debt-to-equity scores (3 and 2, respectively). Valuation metrics (P/E and P/B) are equally weak for both, signaling potential market skepticism. C.H. Robinson presents a more balanced profile with stronger profitability, while J.B. Hunt leans on consistent but slightly lower returns.
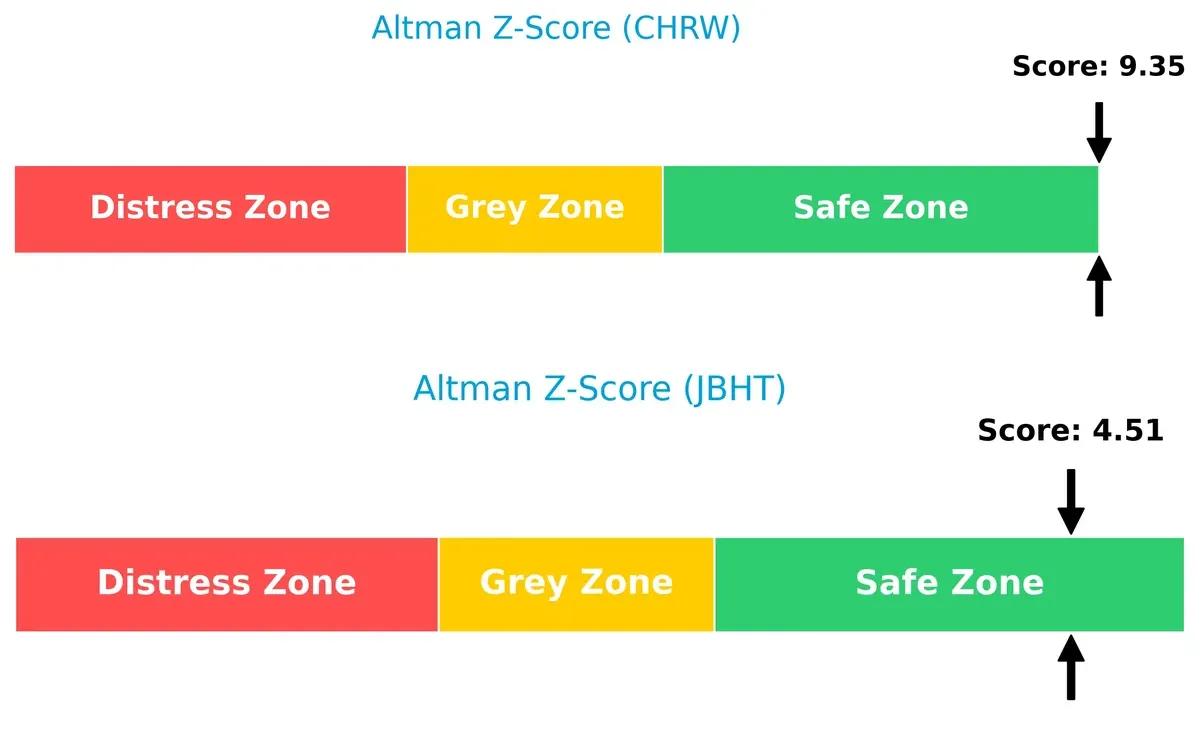
Bankruptcy Risk: Solvency Showdown
C.H. Robinson’s Altman Z-Score of 9.35 far exceeds J.B. Hunt’s 4.51, indicating a superior margin of safety and financial stability for long-term survival in this economic cycle:
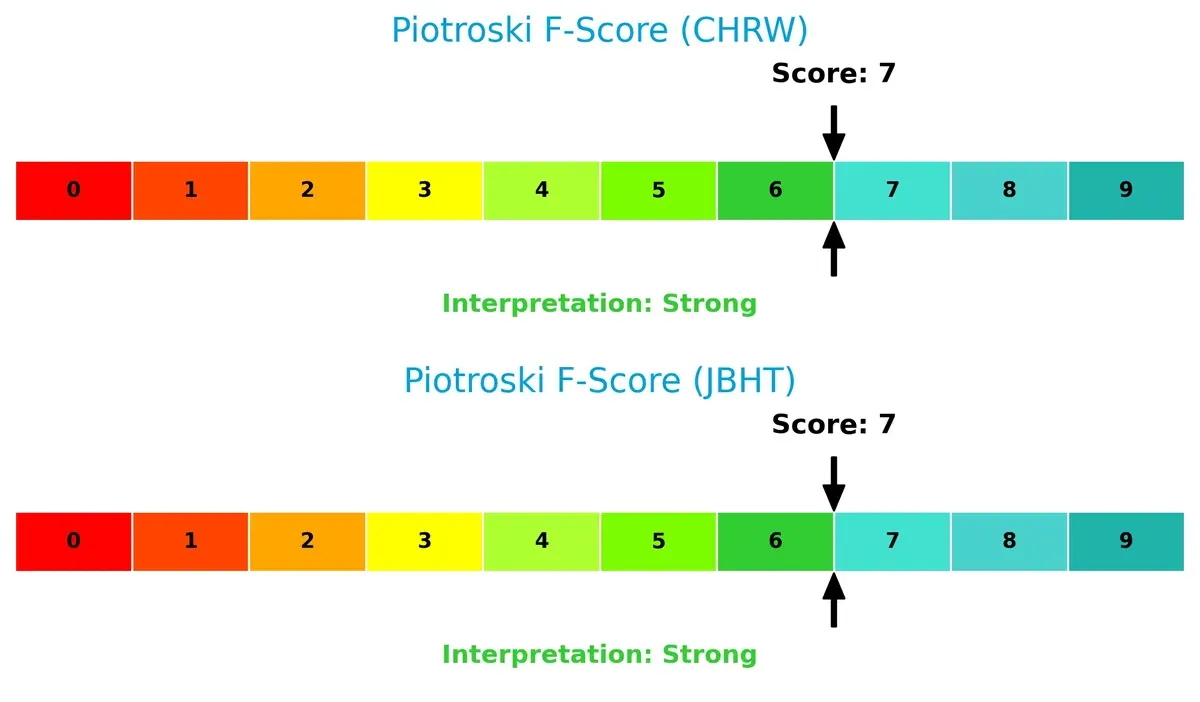
Financial Health: Quality of Operations
Both companies score a strong 7 on the Piotroski F-Score, reflecting robust internal financial health and operational quality. Neither shows red flags, suggesting solid fundamentals underpin their business models:
How are the two companies positioned?
This section dissects the operational DNA of CHRW and JBHT by comparing their revenue distribution and internal dynamics. The goal is to confront their economic moats and reveal which model offers the most resilient, sustainable competitive advantage today.
Revenue Segmentation: The Strategic Mix
This visual comparison dissects how C.H. Robinson and J.B. Hunt diversify their income streams and highlights their primary sector bets:
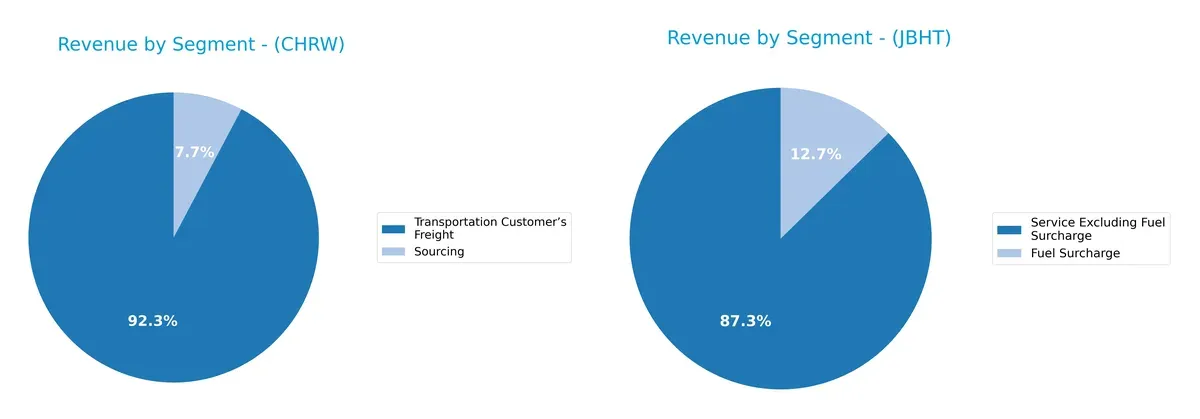
C.H. Robinson anchors its 2024 revenue with $16.4B from Transportation Customer’s Freight, while $1.37B comes from Sourcing, showing moderate diversification. J.B. Hunt relies heavily on $10.6B Service revenue, with $1.53B Fuel Surcharge as a smaller add-on. C.H. Robinson’s mix suggests strong freight brokerage dominance, whereas J.B. Hunt’s reliance on service revenue reveals concentration risk but also infrastructure leverage.
Strengths and Weaknesses Comparison
This table compares the strengths and weaknesses of C.H. Robinson Worldwide and J.B. Hunt Transport Services:
C.H. Robinson Strengths
- Strong profitability with 27.04% ROE and 15.36% ROIC
- Favorable WACC at 7.78% below ROIC
- High asset and fixed asset turnover indicating operational efficiency
- Solid global presence with significant US and Non-US revenues
- Robust interest coverage ratio of 12.45 supporting debt service
J.B. Hunt Strengths
- Favorable debt structure with zero debt-to-assets and low debt-to-equity
- Positive interest coverage ratio at 12.19
- Favorable price-to-book ratio signaling undervaluation
- Large service revenue base excluding fuel surcharge
- Diversified service segments including DCS, ICS, JBI, and JBT
C.H. Robinson Weaknesses
- Low net margin at 2.63%, indicating tight profitability
- Elevated debt-to-equity ratio at 1.01, increasing financial risk
- High P/E and P/B ratios suggesting overvaluation
- Moderate current ratio at 1.28, only neutral liquidity
- Dividend yield higher but may pressure cash flow
J.B. Hunt Weaknesses
- Zero reported ROE and ROIC reflecting lack of profitability
- Unavailable WACC data limits cost of capital assessment
- Negative liquidity ratios with zero current and quick ratios
- Poor asset turnover metrics indicating inefficient asset use
- Low dividend yield at 0.91%, limiting income for investors
The comparison highlights C.H. Robinson’s operational efficiency and profitability strengths but flags valuation and debt concerns. J.B. Hunt shows financial conservatism with low leverage but struggles with profitability and asset utilization, posing strategic challenges.
The Moat Duel: Analyzing Competitive Defensibility
A structural moat is the only true shield protecting long-term profits from relentless competitive erosion. Here’s how two logistics giants measure up:
C.H. Robinson Worldwide, Inc.: Data-Driven Network Moat
C.H. Robinson’s moat stems from its vast, integrated freight network and broker relationships. This yields steady ROIC above WACC, signaling value creation despite a slight decline in profitability. New tech and global expansion may deepen this edge in 2026.
J.B. Hunt Transport Services, Inc.: Asset-Intensive Scale Advantage
J.B. Hunt’s moat relies on owning a massive fleet and dedicated contract services, contrasting C.H. Robinson’s asset-light model. While ROIC data is unavailable, scale and service diversity drive stable margins. Expansion into final mile and intermodal markets could disrupt peers.
Network Connectivity vs. Fleet Scale: The Moat Battle
C.H. Robinson’s data-rich brokerage network creates a wider moat through operational leverage and lower capital intensity. J.B. Hunt’s asset-heavy scale offers depth but risks slower adaptability. I see C.H. Robinson better positioned to defend market share amid rising competition.
Which stock offers better returns?
The past year shows C.H. Robinson’s stock surging with strong acceleration, while J.B. Hunt’s price barely moves despite recent gains, reflecting distinct trading dynamics for both.
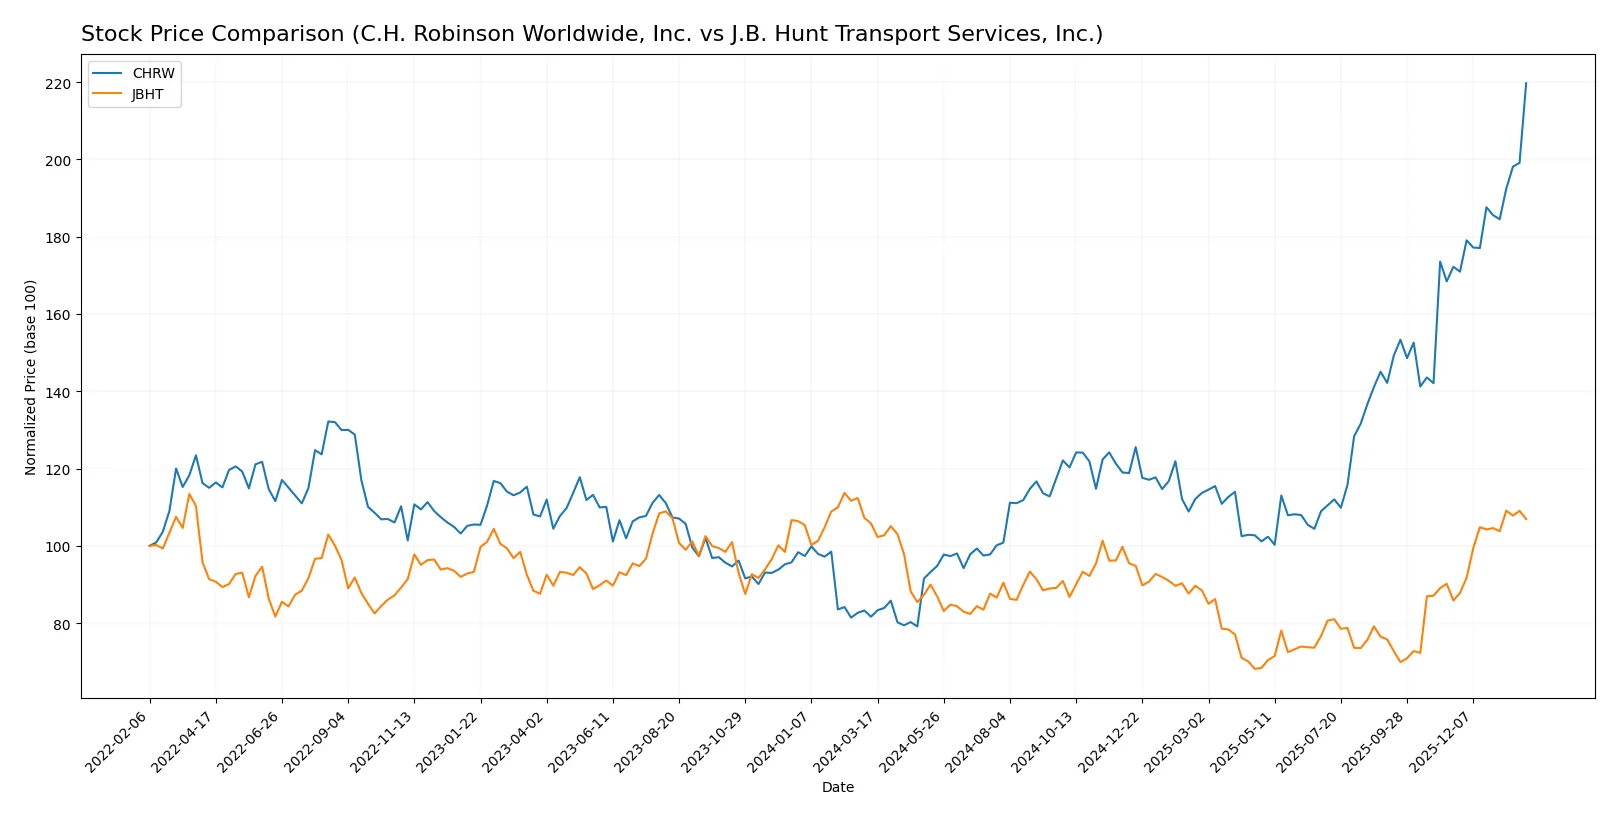
Trend Comparison
C.H. Robinson’s stock gained 169.08% over 12 months with accelerating momentum and a high volatility of 26.76. The price ranged from 70.22 to 194.95, confirming a robust bullish trend.
J.B. Hunt’s stock rose only 1.06% over the same 12-month span but shows recent acceleration with a 24.51% gain. Volatility is lower at 20.04, and the price fluctuated between 129.23 and 206.85.
C.H. Robinson clearly outperforms J.B. Hunt with a much stronger 12-month return and higher volatility, indicating superior market performance despite both showing acceleration recently.
Target Prices
Analysts present a bullish consensus for both C.H. Robinson Worldwide and J.B. Hunt Transport Services, reflecting confidence in their logistics operations.
| Company | Target Low | Target High | Consensus |
|---|---|---|---|
| C.H. Robinson Worldwide, Inc. | 90 | 220 | 184.19 |
| J.B. Hunt Transport Services, Inc. | 150 | 240 | 195 |
The consensus targets for CHRW and JBHT sit close to their current prices, indicating moderate upside potential but also reflecting recent strong performance in the integrated freight sector.

Don’t Let Luck Decide Your Entry Point
Optimize your entry points with our advanced ProRealTime indicators. You’ll get efficient buy signals with precise price targets for maximum performance. Start outperforming now!
How do institutions grade them?
Here is a summary of recent institutional grades for C.H. Robinson Worldwide, Inc. and J.B. Hunt Transport Services, Inc.:
C.H. Robinson Worldwide, Inc. Grades
The following table shows institutional grades for C.H. Robinson Worldwide, Inc. from reliable sources:
| Grading Company | Action | New Grade | Date |
|---|---|---|---|
| Citigroup | maintain | Neutral | 2026-01-30 |
| Benchmark | maintain | Buy | 2026-01-30 |
| Stifel | maintain | Buy | 2026-01-29 |
| Evercore ISI Group | maintain | Outperform | 2026-01-29 |
| Morgan Stanley | maintain | Underweight | 2026-01-29 |
| Truist Securities | maintain | Buy | 2026-01-29 |
| Wells Fargo | maintain | Overweight | 2026-01-29 |
| Susquehanna | maintain | Positive | 2026-01-29 |
| UBS | maintain | Buy | 2026-01-23 |
| Truist Securities | maintain | Buy | 2026-01-15 |
J.B. Hunt Transport Services, Inc. Grades
The following table shows institutional grades for J.B. Hunt Transport Services, Inc. from reliable sources:
| Grading Company | Action | New Grade | Date |
|---|---|---|---|
| Benchmark | maintain | Buy | 2026-01-20 |
| Stifel | maintain | Hold | 2026-01-16 |
| UBS | maintain | Neutral | 2026-01-16 |
| Barclays | maintain | Equal Weight | 2026-01-15 |
| Truist Securities | maintain | Hold | 2026-01-15 |
| Stifel | maintain | Hold | 2026-01-14 |
| Evercore ISI Group | maintain | Outperform | 2026-01-13 |
| JP Morgan | maintain | Overweight | 2026-01-12 |
| Bernstein | maintain | Market Perform | 2026-01-09 |
| Citigroup | downgrade | Neutral | 2026-01-08 |
Which company has the best grades?
C.H. Robinson Worldwide, Inc. holds predominantly buy and outperform ratings, with fewer downgrades than J.B. Hunt Transport Services, Inc., which has several hold and neutral grades. This suggests stronger institutional confidence in C.H. Robinson’s outlook, potentially influencing investor sentiment favorably.
Risks specific to each company
The following categories identify the critical pressure points and systemic threats facing both firms in the 2026 market environment:
1. Market & Competition
C.H. Robinson Worldwide, Inc.
- Faces intense pricing pressure with a net margin of 2.63%, weaker than industry norms.
J.B. Hunt Transport Services, Inc.
- Exhibits stronger net margin at 4.99% but lacks ROE and ROIC, signaling operational challenges.
2. Capital Structure & Debt
C.H. Robinson Worldwide, Inc.
- Debt-to-equity at 1.01 is high, a red flag despite decent interest coverage of 12.45.
J.B. Hunt Transport Services, Inc.
- Shows no debt, reflecting a conservative balance sheet and lower financial risk.
3. Stock Volatility
C.H. Robinson Worldwide, Inc.
- Beta of 0.913 indicates below-market volatility, suggesting relative stock stability.
J.B. Hunt Transport Services, Inc.
- Beta of 1.27 reveals higher stock volatility, exposing shareholders to greater price swings.
4. Regulatory & Legal
C.H. Robinson Worldwide, Inc.
- Operates globally with exposure to complex customs and transportation regulations.
J.B. Hunt Transport Services, Inc.
- Similar broad operations face regulatory scrutiny, especially in dedicated and final mile services.
5. Supply Chain & Operations
C.H. Robinson Worldwide, Inc.
- Relies on 85,000 third-party carriers, which can increase operational risk and variability.
J.B. Hunt Transport Services, Inc.
- Maintains a large company-owned fleet, reducing third-party dependency but increasing capital intensity.
6. ESG & Climate Transition
C.H. Robinson Worldwide, Inc.
- Faces pressure to improve sustainability in freight logistics and fresh produce sourcing.
J.B. Hunt Transport Services, Inc.
- Must adapt truck fleet and intermodal services to evolving emissions regulations and green standards.
7. Geopolitical Exposure
C.H. Robinson Worldwide, Inc.
- Global forwarding exposes it to trade tensions and geopolitical disruptions.
J.B. Hunt Transport Services, Inc.
- Primarily North American focus limits geopolitical risk but is vulnerable to regional trade policies.
Which company shows a better risk-adjusted profile?
C.H. Robinson’s greatest risk is its high leverage amid modest profitability, raising financial vulnerability. J.B. Hunt’s key risk lies in operational inefficiencies reflected by zero ROE and ROIC. Despite its higher volatility, J.B. Hunt’s debt-free balance sheet offers a safer cushion. Overall, J.B. Hunt presents a better risk-adjusted profile, supported by its Altman Z-score of 4.51 in the safe zone and strong Piotroski score. Meanwhile, C.H. Robinson’s higher debt ratio and unfavorable valuation multiples warrant caution.
Final Verdict: Which stock to choose?
C.H. Robinson Worldwide stands out with its unmatched capital efficiency and strong return on equity, signaling disciplined management and value creation. Its point of vigilance lies in a modest current ratio and rising debt levels, which could pressure liquidity in downturns. It fits a portfolio seeking resilient, value-driven growth with moderate risk tolerance.
J.B. Hunt Transport impresses with a strategic moat anchored in operational scale and recurring logistics contracts, providing revenue stability. Compared to C.H. Robinson, it offers a safer balance sheet and a steadier cash conversion cycle. It suits investors targeting growth at a reasonable price with an emphasis on stability and income.
If you prioritize high capital efficiency and aggressive value creation, C.H. Robinson is the compelling choice due to superior ROIC and equity returns. However, if you seek steadier cash flow and financial safety, J.B. Hunt offers better stability and a durable operational moat, though it commands a premium. Both present distinct analytical scenarios depending on investor risk appetite and strategy.
Disclaimer: Investment carries a risk of loss of initial capital. The past performance is not a reliable indicator of future results. Be sure to understand risks before making an investment decision.
Go Further
I encourage you to read the complete analyses of C.H. Robinson Worldwide, Inc. and J.B. Hunt Transport Services, Inc. to enhance your investment decisions: