Home > Comparison > Real Estate > DLR vs BXP
The strategic rivalry between Digital Realty Trust, Inc. and BXP, Inc. shapes the office REIT landscape. Digital Realty operates a global data center platform, focusing on scalable digital infrastructure. BXP, Inc. leads as a developer and owner of Class A office properties concentrated in key U.S. markets. This clash represents a contrast between innovative tech-focused real estate and traditional premium office space. This analysis aims to identify which trajectory offers superior risk-adjusted returns for diversified portfolios.

Table of contents
Companies Overview
Digital Realty Trust and BXP dominate the U.S. office REIT landscape with distinct strategic approaches and market footprints.
Digital Realty Trust, Inc.: Global Data Center REIT Leader
Digital Realty Trust excels as a global data center REIT, generating revenue through colocation and interconnection services. Its core strength lies in PlatformDIGITALR, a proprietary global data center platform. In 2026, the company focuses on scaling digital business and addressing data gravity challenges across 284 facilities in 23 countries, leveraging broad geographic reach as a competitive edge.
BXP, Inc.: Premier U.S. Class A Office REIT
BXP operates as the largest publicly-held developer and owner of Class A office properties in the U.S. Its revenue engine centers on leasing and managing 51.2M square feet of premium office space in top-tier markets like Boston and New York. In 2026, BXP prioritizes expanding and redeveloping its urban portfolio, maintaining leadership in high-demand, coastal office hubs.
Strategic Collision: Similarities & Divergences
Both firms embrace real estate investment trusts but diverge sharply in customer focus—Digital Realty targets the tech-driven data economy, while BXP serves traditional office tenants. Their primary battleground is market specialization: global digital infrastructure versus premium U.S. office space. This contrast defines their investment profiles—Digital Realty offers tech-sector exposure, whereas BXP provides stability tied to prime commercial real estate.
Income Statement Comparison
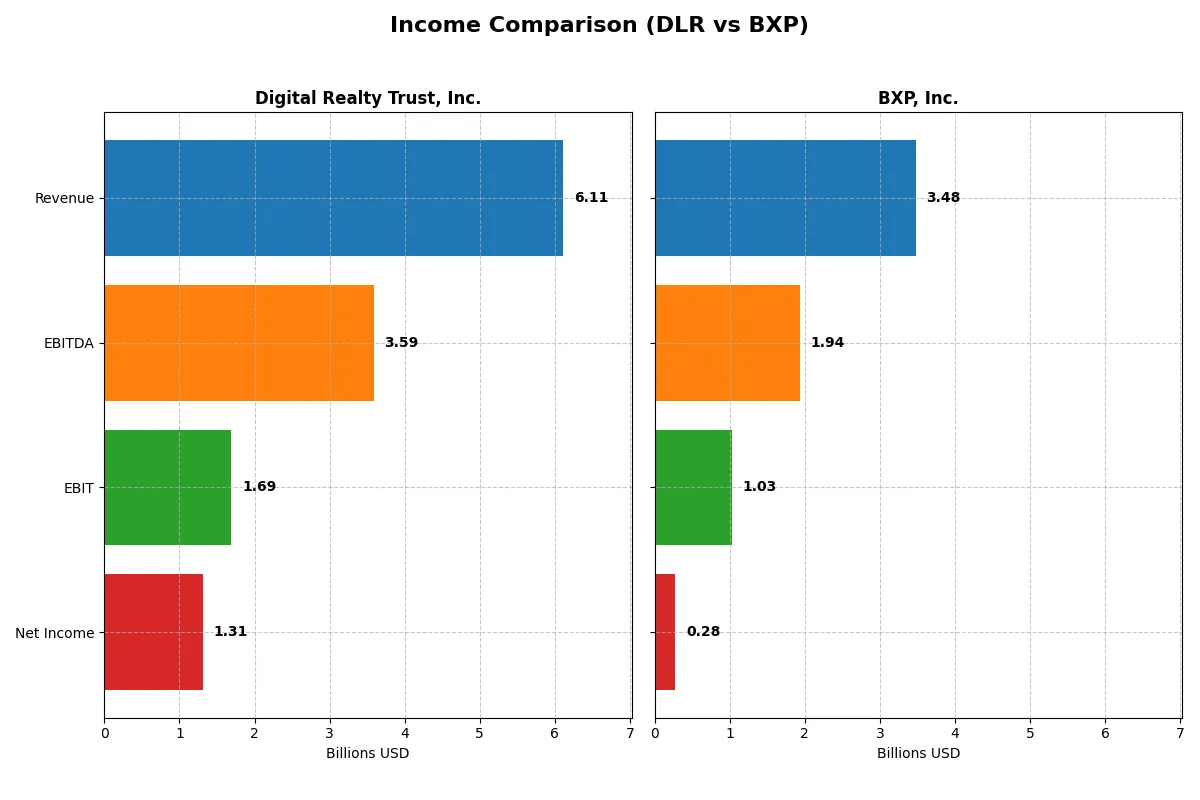
The following data dissects the core profitability and scalability of both corporate engines to reveal who dominates the bottom line:
| Metric | Digital Realty Trust, Inc. (DLR) | BXP, Inc. (BXP) |
|---|---|---|
| Revenue | 6.11B | 3.48B |
| Cost of Revenue | 2.73B | 1.37B |
| Operating Expenses | 2.73B | 169M |
| Gross Profit | 3.39B | 2.11B |
| EBITDA | 3.59B | 1.94B |
| EBIT | 1.69B | 1.03B |
| Interest Expense | 438M | 648M |
| Net Income | 1.31B | 277M |
| EPS | 3.76 | 1.75 |
| Fiscal Year | 2025 | 2025 |
Income Statement Analysis: The Bottom-Line Duel
The following income statement comparison highlights which company operates with superior efficiency and profitability in the evolving market landscape.
Digital Realty Trust, Inc. Analysis
Digital Realty’s revenue rose sharply by 10% in 2025, reaching $6.1B, with net income surging 97% year-over-year to $1.31B. The company maintains healthy gross and net margins at 55.4% and 21.4%, respectively, demonstrating robust operational control. Its EBIT margin also improved to 27.7%, signaling strong momentum and efficiency gains.
BXP, Inc. Analysis
BXP’s revenue increased modestly by 2.2% to $3.48B in 2025, while net income jumped dramatically from $14M to $277M, reflecting margin expansion despite a higher interest expense of 18.6%. The firm boasts a superior gross margin of 60.6% and EBIT margin of 29.6%, evidencing efficient cost management and a sharp rebound in profitability.
Margin Strength vs. Revenue Growth
Digital Realty leads in revenue scale and consistent margin improvement, with a strong 10% revenue growth and stable net margin expansion. BXP excels in margin strength but lags in top-line growth and suffers from elevated interest costs. For investors prioritizing revenue momentum and balanced profitability, Digital Realty presents a more compelling profile.
Financial Ratios Comparison
These vital ratios act as a diagnostic tool to expose the underlying fiscal health, valuation premiums, and capital efficiency of each company:
| Ratios | Digital Realty Trust, Inc. (DLR) | BXP, Inc. (BXP) |
|---|---|---|
| ROE | 2.82% (2024) | 5.38% (2025) |
| ROIC | 1.02% (2024) | 7.63% (2025) |
| P/E | 95.17 (2024) | 38.78 (2025) |
| P/B | 2.69 (2024) | 2.09 (2025) |
| Current Ratio | 1.11 (2024) | 2.28 (2025) |
| Quick Ratio | 1.11 (2024) | 2.28 (2025) |
| D/E | 0.84 (2024) | 3.37 (2025) |
| Debt-to-Assets | 39.77% (2024) | 66.34% (2025) |
| Interest Coverage | 1.04 (2024) | 3.00 (2025) |
| Asset Turnover | 0.12 (2024) | 0.13 (2025) |
| Fixed Asset Turnover | 4.71 (2024) | 0.17 (2025) |
| Payout ratio | 271.08% (2024) | 209.20% (2025) |
| Dividend yield | 2.85% (2024) | 5.39% (2025) |
| Fiscal Year | 2024 | 2025 |
Efficiency & Valuation Duel: The Vital Signs
Financial ratios act as a company’s DNA, revealing hidden risks and operational excellence that shape investor decisions.
Digital Realty Trust, Inc.
Digital Realty Trust shows a modest ROE of 2.82% and a net margin of 10.85%, reflecting low profitability but solid margin control. The stock trades at a stretched P/E of 95.17, signaling expensive valuation. Shareholders receive a favorable 2.85% dividend yield, balancing limited growth reinvestment.
BXP, Inc.
BXP posts a higher ROE of 5.38% but a lower net margin at 7.95%, indicating moderate profitability with some operational challenges. Its P/E of 38.78 remains high yet more reasonable than Digital Realty. BXP offers a neutral 5.39% dividend yield, despite elevated debt levels that pressure interest coverage.
Premium Valuation vs. Operational Safety
Digital Realty’s elevated valuation contrasts with BXP’s higher leverage and weaker coverage ratios. BXP’s stronger ROIC and dividend yield come with increased risk. Investors prioritizing stability might prefer Digital Realty’s safer profile; those seeking yield with risk tolerance may lean toward BXP.
Which one offers the Superior Shareholder Reward?
I compare Digital Realty Trust (DLR) and BXP, Inc. (BXP) by their dividend yields, payout ratios, and buyback intensity. DLR yields around 2.85% with a payout ratio exceeding 270%, signaling unsustainable dividends despite solid free cash flow of 7.0 per share. BXP offers a higher yield near 5.4% with a more reasonable payout ratio around 209%, supported by positive free cash flow and consistent buybacks. BXP’s stronger operating margins and a more conservative capital allocation suggest a sustainable model. I conclude BXP delivers the superior total shareholder reward in 2026, balancing yield and growth prudently.
Comparative Score Analysis: The Strategic Profile
The radar chart reveals the fundamental DNA and trade-offs of Digital Realty Trust, Inc. and BXP, Inc., highlighting their strategic strengths and vulnerabilities:
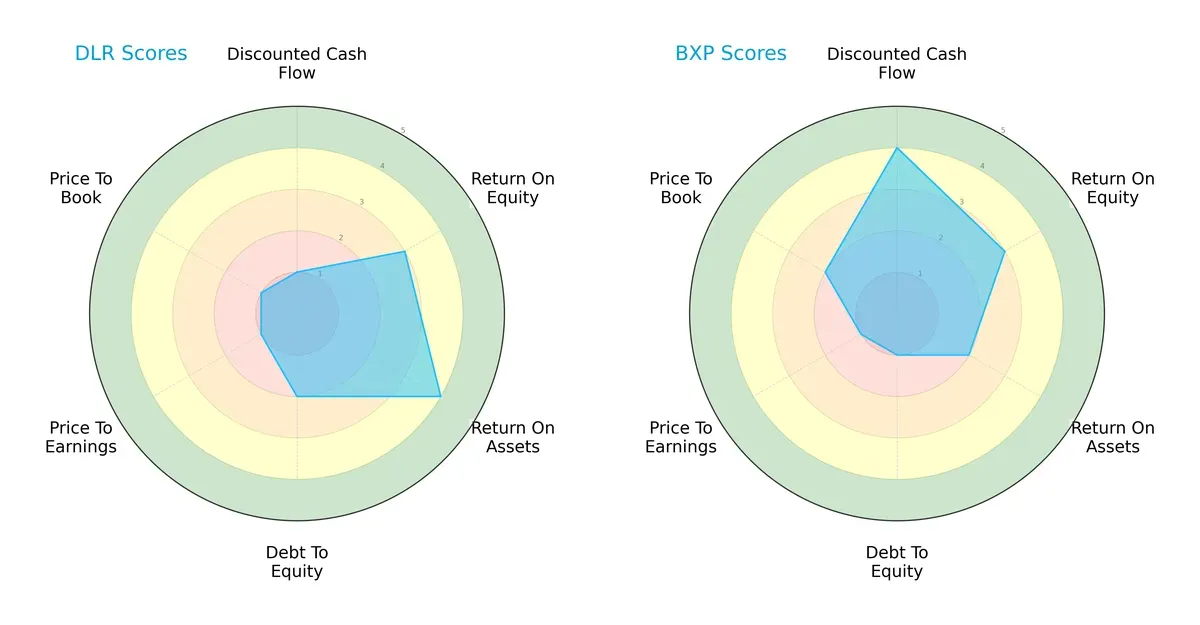
Digital Realty Trust exhibits a strong asset efficiency (ROA score 4) but struggles with cash flow valuation (DCF score 1) and balance sheet leverage (Debt/Equity score 2). BXP excels in discounted cash flow (DCF score 4), signaling better future cash generation, yet it carries heavier financial risk with a very unfavorable Debt/Equity score (1). Both share moderate equity returns (ROE score 3) and poor valuation metrics (P/E and P/B scores at or below 2). I find Digital Realty Trust’s profile more balanced, while BXP leans heavily on its cash flow strength despite leverage risks.
Bankruptcy Risk: Solvency Showdown
The Altman Z-Scores place both companies in the distress zone, signaling elevated bankruptcy risk amid this market cycle:
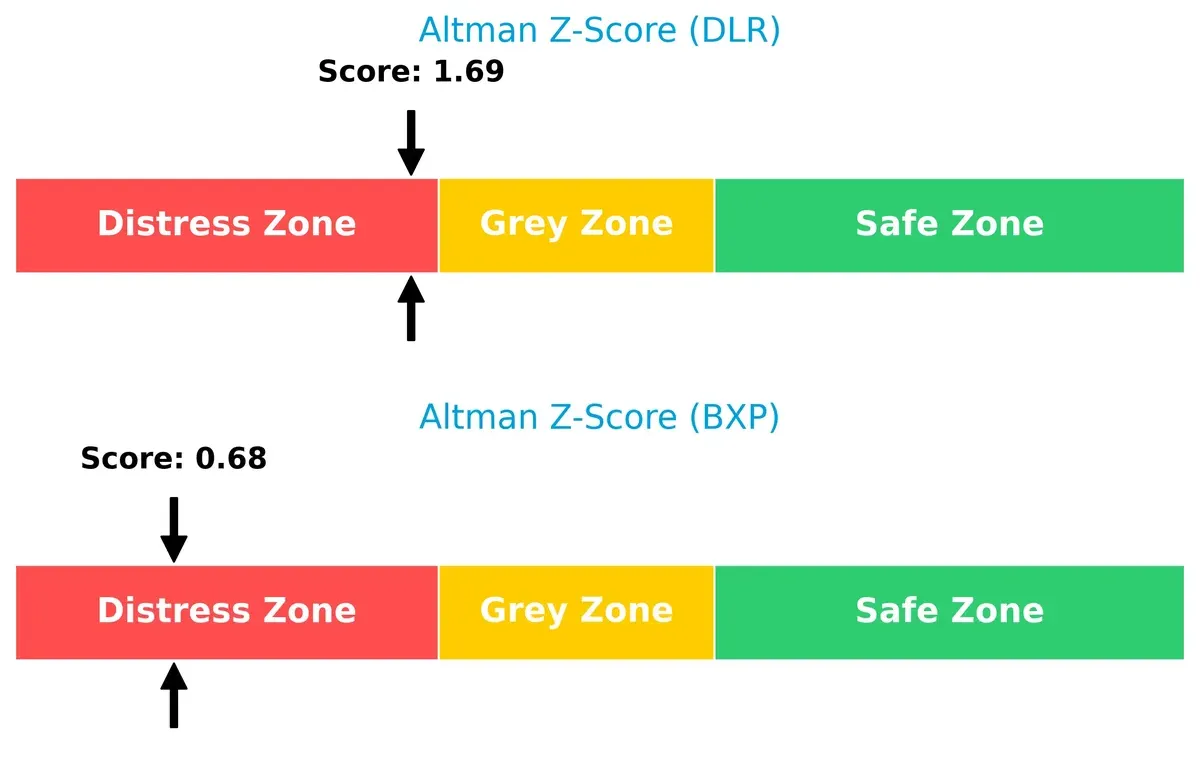
Digital Realty Trust’s Z-Score of 1.69 teeters just below the critical 1.8 threshold, indicating serious financial stress but slightly better resilience than BXP’s 0.68. I view both firms as vulnerable, but Digital Realty’s comparatively higher score offers a marginally stronger solvency outlook.
Financial Health: Quality of Operations
Piotroski F-Scores reveal a stark contrast in operational quality and financial strength between the two:
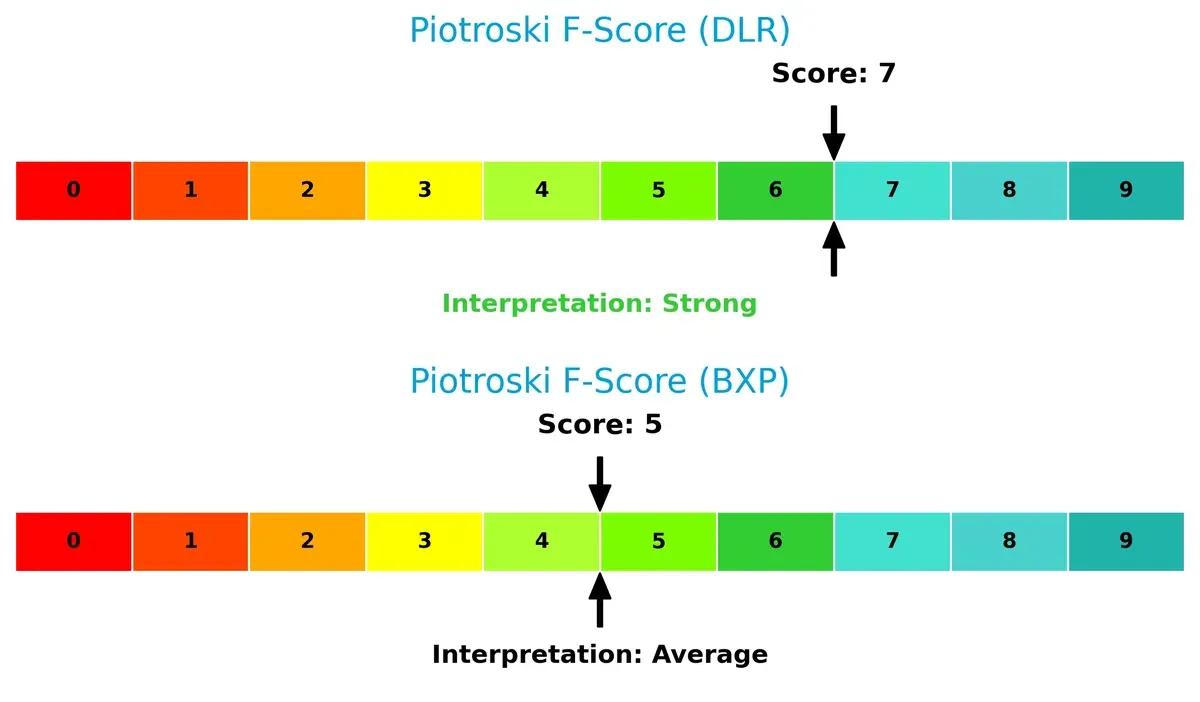
Digital Realty Trust scores a robust 7, reflecting strong profitability, liquidity, and efficiency. BXP’s score of 5 flags average internal health, suggesting potential red flags in operational metrics. I regard Digital Realty as having superior financial discipline and lower risk of deterioration compared to BXP.
How are the two companies positioned?
This section dissects the operational DNA of DLR and BXP by comparing their revenue distribution and internal dynamics—strengths and weaknesses. The goal is to confront their economic moats and identify which model offers the most resilient, sustainable competitive advantage today.
Revenue Segmentation: The Strategic Mix
This comparison dissects how Digital Realty Trust, Inc. and BXP, Inc. diversify their income streams and where their primary sector bets lie:
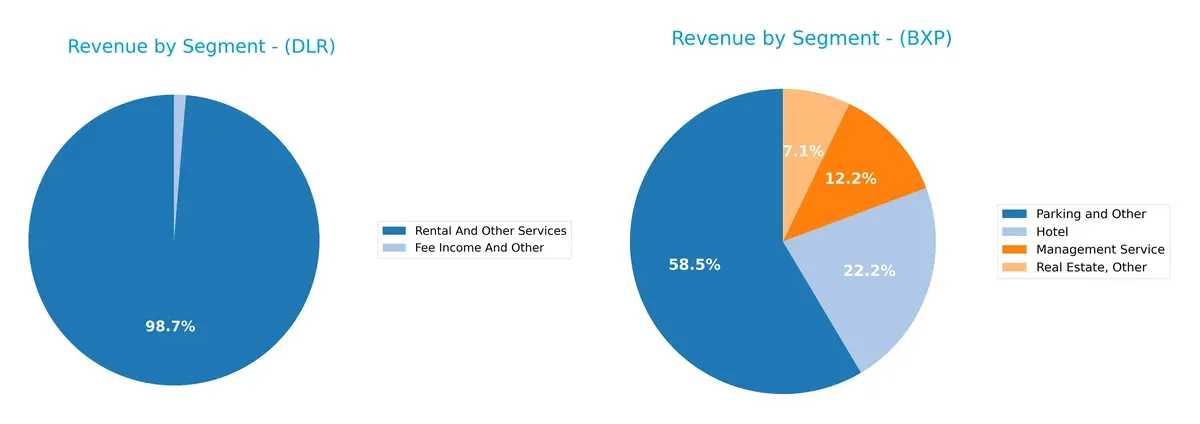
Digital Realty Trust anchors revenue in “Rental And Other Services,” generating over $5.4B in 2024, dwarfing its modest $72M fee income. BXP, by contrast, diversifies with “Parking and Other” at $135M, “Hotel” $51M, and “Management Service” $28M, avoiding dependency on a single stream. DLR’s concentration signals infrastructure dominance but raises concentration risk. BXP’s mix implies resilience through varied real estate-related services.
Strengths and Weaknesses Comparison
This table compares the strengths and weaknesses of Digital Realty Trust, Inc. and BXP, Inc.:
DLR Strengths
- Balanced revenue from rental services and fee income
- Strong global presence with nearly equal US and non-US revenue
- Favorable quick ratio and fixed asset turnover
- Dividend yield above 2.8%
BXP Strengths
- Diverse revenue streams including parking, hotel, and management services
- Favorable WACC and liquidity ratios
- Higher dividend yield around 5.4%
- Concentrated presence in key US markets with stable revenue
DLR Weaknesses
- Low ROE and ROIC indicate weak capital efficiency
- High P/E ratio suggests overvaluation risk
- Neutral leverage but asset turnover is low
- Net margin just above 10%
BXP Weaknesses
- High debt-to-equity and debt-to-assets ratios raise financial risk
- Low interest coverage ratio signals vulnerability
- Unfavorable asset turnover metrics
- Moderate net margin under 8%
Digital Realty Trust benefits from a diversified global footprint and operational efficiency in fixed assets, but struggles with capital returns and valuation concerns. BXP shows strong liquidity and capital cost management but faces risks from heavy leverage and operational inefficiencies. Both companies’ strategies must balance growth and risk management given their distinct financial profiles.
The Moat Duel: Analyzing Competitive Defensibility
A structural moat is the only true shield protecting long-term profits from relentless competitive erosion. Let’s dissect how these two REITs defend their turf:
Digital Realty Trust, Inc. (DLR): Global Data Center Network Moat
DLR’s competitive edge stems from its vast, interconnected data center platform serving global digital demand. This manifests in stable, favorable margins and robust revenue growth. However, a declining ROIC trend signals potential pressure on capital efficiency by 2026.
BXP, Inc. (BXP): Premium Office Location Moat
BXP leverages prime Class A office properties in top U.S. metros, creating high switching costs for tenants. Its ROIC grows strongly, outpacing WACC by nearly 3%, reflecting superior capital allocation. Growth prospects hinge on urban office market recovery and redevelopment opportunities.
Moat Strength Face-Off: Network Scale vs. Location Prestige
BXP exhibits a wider and deeper moat with a very favorable ROIC trend and clear value creation. DLR’s moat benefits from scale but faces efficiency headwinds. I find BXP better positioned to defend and expand its market share in 2026.
Which stock offers better returns?
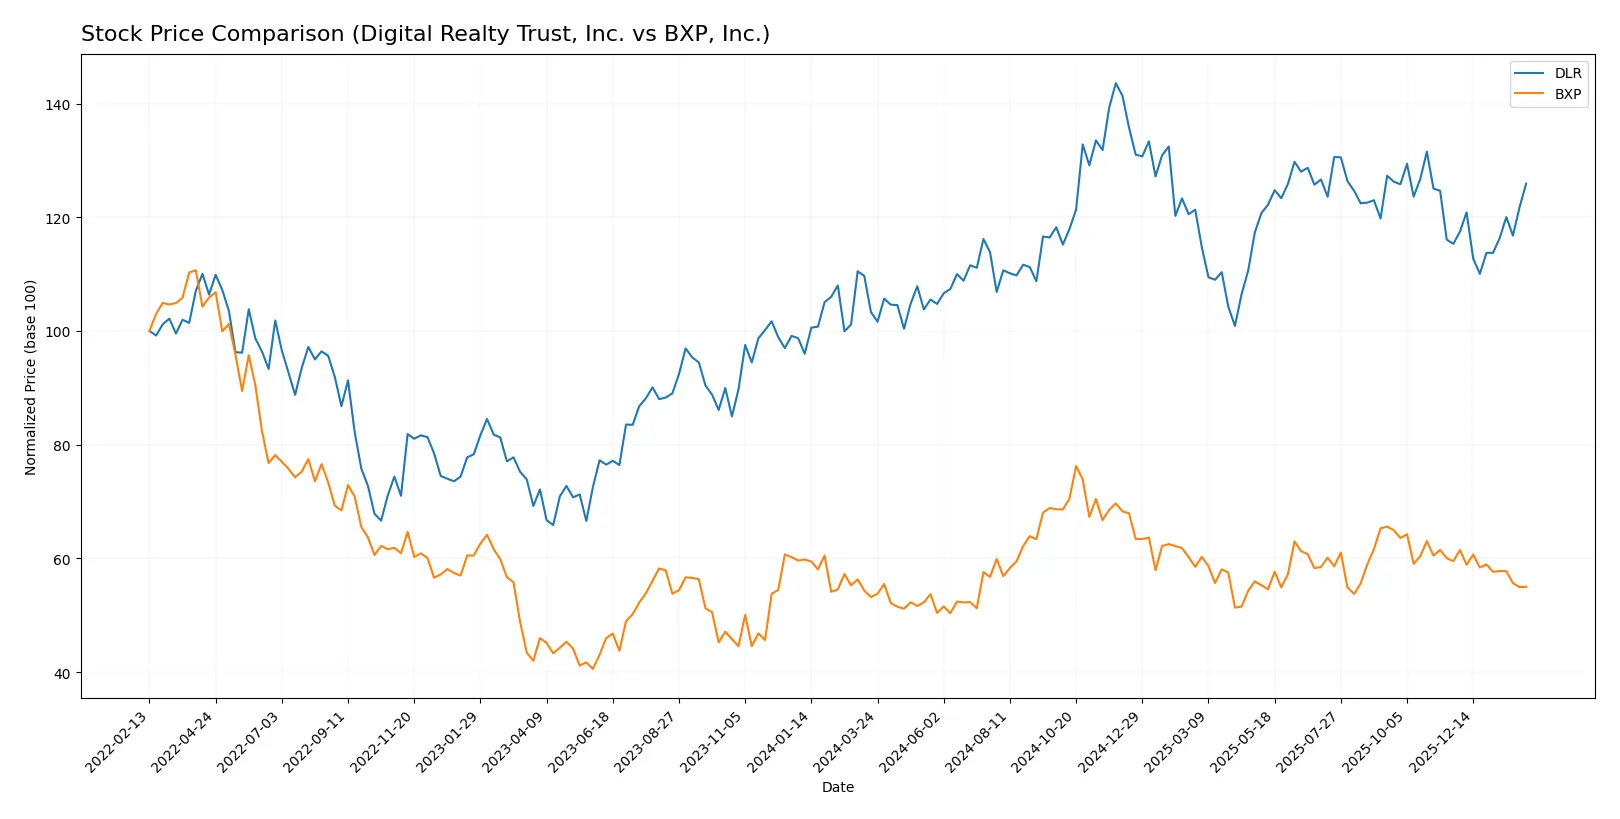
The past year shows Digital Realty Trust, Inc. with a strong price rise and accelerating momentum, while BXP, Inc. experienced modest gains and recent weakening in price action.
Trend Comparison
Digital Realty Trust, Inc. posted a 21.84% price increase over 12 months, signaling a bullish trend with accelerating gains and a high volatility level of 13.56%. Its price ranged between 136.83 and 195.69, reflecting strong upward momentum.
BXP, Inc. gained 3.39% over the same period, maintaining a bullish but decelerating trend with lower volatility at 6.62%. The stock’s price fluctuated from 59.26 to 89.72, showing a slowdown in upward movement.
Digital Realty Trust, Inc. outperformed BXP, Inc. in market performance, delivering significantly higher returns and accelerating trends compared to BXP’s modest gains and recent price weakness.
Target Prices
Analysts set a clear target price range for both Digital Realty Trust, Inc. and BXP, Inc., reflecting moderate upside potential.
| Company | Target Low | Target High | Consensus |
|---|---|---|---|
| Digital Realty Trust, Inc. | 164 | 210 | 188.3 |
| BXP, Inc. | 70 | 85 | 77.07 |
The target consensus for Digital Realty Trust exceeds its current price of 171.62 by about 10%, signaling analyst confidence. BXP’s consensus target at 77.07 suggests a roughly 19% upside from its 64.72 market price, indicating stronger bullish sentiment in this REIT.

Don’t Let Luck Decide Your Entry Point
Optimize your entry points with our advanced ProRealTime indicators. You’ll get efficient buy signals with precise price targets for maximum performance. Start outperforming now!
How do institutions grade them?
This section summarizes recent institutional grades for Digital Realty Trust, Inc. and BXP, Inc.:
Digital Realty Trust, Inc. Grades
The table below shows the latest grades assigned by major financial institutions to Digital Realty Trust, Inc.:
| Grading Company | Action | New Grade | Date |
|---|---|---|---|
| Citigroup | Maintain | Buy | 2026-02-06 |
| Stifel | Maintain | Buy | 2026-02-06 |
| HSBC | Upgrade | Buy | 2026-01-15 |
| Scotiabank | Maintain | Sector Outperform | 2026-01-14 |
| Barclays | Upgrade | Equal Weight | 2026-01-13 |
| Mizuho | Maintain | Outperform | 2026-01-12 |
| B of A Securities | Downgrade | Neutral | 2026-01-08 |
| Truist Securities | Maintain | Buy | 2025-11-05 |
| Citigroup | Maintain | Buy | 2025-10-29 |
| Barclays | Maintain | Underweight | 2025-10-27 |
BXP, Inc. Grades
The table below shows the latest grades assigned by major financial institutions to BXP, Inc.:
| Grading Company | Action | New Grade | Date |
|---|---|---|---|
| Citigroup | Maintain | Neutral | 2026-02-03 |
| Truist Securities | Maintain | Hold | 2026-02-02 |
| Evercore ISI Group | Maintain | In Line | 2026-01-29 |
| Cantor Fitzgerald | Maintain | Overweight | 2026-01-29 |
| Barclays | Maintain | Overweight | 2026-01-23 |
| Scotiabank | Maintain | Sector Perform | 2026-01-14 |
| JP Morgan | Maintain | Overweight | 2026-01-13 |
| Barclays | Upgrade | Overweight | 2026-01-13 |
| UBS | Maintain | Neutral | 2026-01-08 |
| Citigroup | Maintain | Neutral | 2026-01-07 |
Which company has the best grades?
Digital Realty Trust, Inc. generally receives stronger grades, including multiple Buy and Outperform ratings. BXP, Inc. mostly holds Neutral and Overweight grades. Investors may view Digital Realty’s higher consensus as a sign of stronger institutional confidence.
Risks specific to each company
The following categories identify the critical pressure points and systemic threats facing both firms in the 2026 market environment:
1. Market & Competition
Digital Realty Trust, Inc.
- Global data center platform faces intense competition from cloud providers and edge computing trends.
BXP, Inc.
- Largest US Class A office REIT competes in saturated urban markets with shifting office space demand.
2. Capital Structure & Debt
Digital Realty Trust, Inc.
- Moderate debt-to-equity ratio at 0.84 with neutral interest coverage signals manageable leverage.
BXP, Inc.
- High debt-to-equity at 3.37 and weak interest coverage at 1.59 increase financial risk significantly.
3. Stock Volatility
Digital Realty Trust, Inc.
- Beta of 1.15 indicates moderately higher volatility than the market.
BXP, Inc.
- Beta near 1.01 suggests volatility roughly in line with the broader market.
4. Regulatory & Legal
Digital Realty Trust, Inc.
- Faces data privacy and infrastructure regulations across 23 countries, increasing compliance complexity.
BXP, Inc.
- Subject to stringent US urban zoning and environmental regulations impacting development timelines.
5. Supply Chain & Operations
Digital Realty Trust, Inc.
- Global footprint exposes it to cross-border supply chain disruptions and rising construction costs.
BXP, Inc.
- Concentration in five US markets limits geographic diversification but simplifies supply chain risks.
6. ESG & Climate Transition
Digital Realty Trust, Inc.
- Pressure to reduce data center energy consumption amid rising ESG scrutiny and carbon regulations.
BXP, Inc.
- Office buildings face increasing retrofit costs to meet evolving climate and sustainability standards.
7. Geopolitical Exposure
Digital Realty Trust, Inc.
- Operations in 23 countries expose it to geopolitical tensions and regulatory changes worldwide.
BXP, Inc.
- Focused solely in the US, limiting geopolitical risk but increasing exposure to domestic policy shifts.
Which company shows a better risk-adjusted profile?
Digital Realty’s primary risk lies in geopolitical and regulatory complexity due to its global footprint. BXP’s greatest threat is its high leverage and weak interest coverage. Despite higher volatility, Digital Realty maintains a more balanced capital structure and stronger liquidity. Recent data show BXP’s debt ratios and interest coverage lag materially behind industry norms. Thus, Digital Realty exhibits a better risk-adjusted profile, balancing growth with prudent financial management amid sector headwinds.
Final Verdict: Which stock to choose?
Digital Realty Trust’s superpower lies in its robust revenue growth and solid gross margins, signaling operational strength in a competitive sector. Its point of vigilance is a declining ROIC trend, which flags challenges in capital efficiency. It fits well in aggressive growth portfolios seeking sector leadership.
BXP, meanwhile, commands a strategic moat through its steadily improving ROIC, indicating a sustainable competitive advantage. Its healthier liquidity ratios and stronger value creation metrics suggest a safer profile than Digital Realty. BXP suits investors favoring growth at a reasonable price with a stability tilt.
If you prioritize aggressive growth and are comfortable navigating capital efficiency headwinds, Digital Realty Trust offers compelling momentum. However, if you seek a balance of growth and financial stability supported by a rising ROIC, BXP outshines as the more prudent choice. Each scenario depends on your risk tolerance and portfolio goals.
Disclaimer: Investment carries a risk of loss of initial capital. The past performance is not a reliable indicator of future results. Be sure to understand risks before making an investment decision.
Go Further
I encourage you to read the complete analyses of Digital Realty Trust, Inc. and BXP, Inc. to enhance your investment decisions: