In the dynamic Aerospace & Defense industry, TransDigm Group Incorporated (TDG) and BWX Technologies, Inc. (BWXT) stand out with distinct yet overlapping market focuses. TDG excels in aircraft components, while BWXT specializes in nuclear technologies and services. Both companies push innovation within critical sectors, making them compelling contenders for investors. This article will analyze their strengths to uncover which offers the more attractive investment opportunity for your portfolio.
Table of contents
Companies Overview
I will begin the comparison between TransDigm Group Incorporated and BWX Technologies, Inc. by providing an overview of these two companies and their main differences.
TransDigm Group Incorporated Overview
TransDigm Group Incorporated is a Cleveland-based aerospace and defense company focused on designing, producing, and supplying aircraft components. Its diverse product portfolio spans mechanical actuators, ignition systems, specialized pumps, and cockpit systems, serving markets including airlines, military agencies, and repair depots globally. Founded in 1993, it employs around 16,600 people and operates primarily in the industrial sector.
BWX Technologies, Inc. Overview
BWX Technologies, Inc., headquartered in Lynchburg, Virginia, manufactures and sells nuclear components and services worldwide. Its operations cover naval nuclear propulsion, commercial nuclear power equipment, and nuclear materials processing. Founded in 1867, the company operates through three segments targeting defense, energy, and medical applications, with approximately 8,700 employees and a strong focus on nuclear technology within the industrial sector.
Key similarities and differences
Both companies operate within the aerospace and defense industry and serve government and commercial sectors. TransDigm specializes in aircraft components and systems, while BWX Technologies focuses on nuclear components and services. TransDigm’s business is broader in aviation-related products, whereas BWX has a niche in nuclear propulsion and power generation. Employee count and market capitalization also differ significantly, reflecting their distinct operational scales and areas of expertise.
Income Statement Comparison
The table below presents a side-by-side comparison of the most recent fiscal year income statement metrics for TransDigm Group Incorporated and BWX Technologies, Inc.
| Metric | TransDigm Group Incorporated | BWX Technologies, Inc. |
|---|---|---|
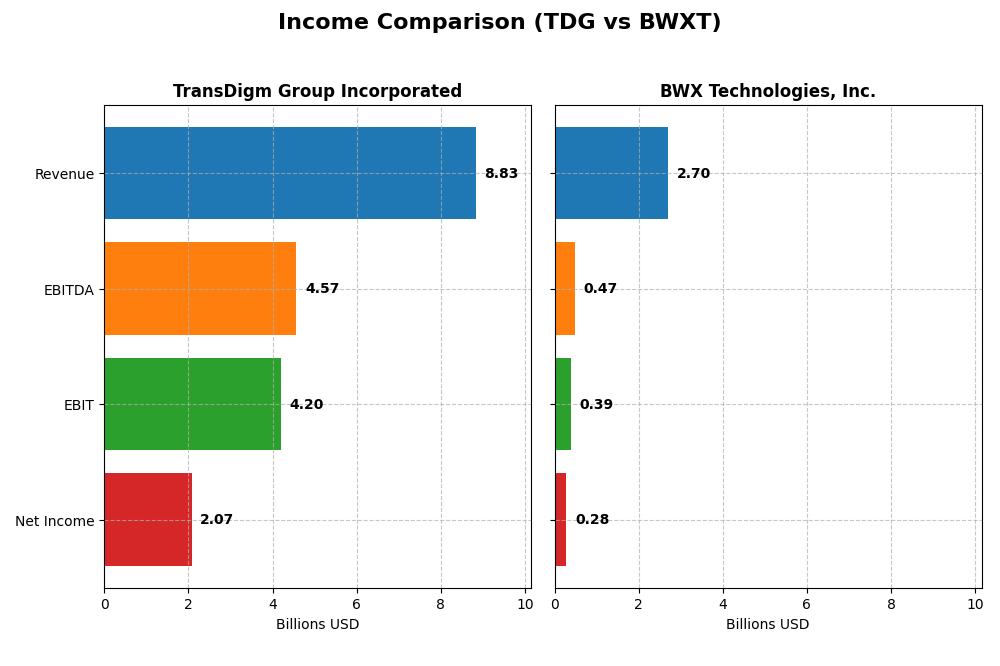
| Market Cap | 77.6B | 17.7B |
| Revenue | 8.83B | 2.70B |
| EBITDA | 4.57B | 474M |
| EBIT | 4.20B | 388M |
| Net Income | 2.07B | 282M |
| EPS | 32.08 | 3.08 |
| Fiscal Year | 2025 | 2024 |
Income Statement Interpretations
TransDigm Group Incorporated
TransDigm’s revenue rose steadily from $4.8B in 2021 to $8.8B in 2025, with net income surging from $680M to $2.07B. Margins improved notably, with a gross margin at 60.14% and net margin at 23.49% in 2025, reflecting strong profitability. The latest year showed favorable growth in revenue (11.22%) and net income (25.21%), signaling robust operational efficiency.
BWX Technologies, Inc.
BWXT’s revenue grew moderately, from $2.12B in 2020 to $2.7B in 2024, with net income increasing from $279M to $282M. Margins remain stable but lower than TransDigm’s, with a 24.23% gross margin and 10.43% net margin in 2024. The recent year showed solid revenue growth (8.31%) and EPS growth (14.55%) despite slight unfavorable operating expense trends relative to revenue growth.
Which one has the stronger fundamentals?
TransDigm demonstrates stronger fundamentals with higher and improving margins, significant net income growth (205% over 5 years), and robust EPS expansion, despite a less favorable interest expense ratio. BWXT shows steady revenue and moderate net income gains but faces challenges in margin stability and expense management. Overall, TransDigm’s income statement exhibits more favorable growth and profitability metrics.
Financial Ratios Comparison
This table presents the most recent financial ratios for TransDigm Group Incorporated and BWX Technologies, Inc., offering a side-by-side view of their fiscal year 2025 and 2024 metrics respectively.
| Ratios | TransDigm Group Incorporated (2025) | BWX Technologies, Inc. (2024) |
|---|---|---|
| ROE | -21.41% | 26.09% |
| ROIC | 15.22% | 12.77% |
| P/E | 37.0 | 36.2 |
| P/B | -7.92 | 9.44 |
| Current Ratio | 3.21 | 1.96 |
| Quick Ratio | 2.25 | 1.88 |
| D/E | -3.10 | 1.00 |
| Debt-to-Assets | 131.08% | 37.51% |
| Interest Coverage | 2.65 | 9.64 |
| Asset Turnover | 0.39 | 0.94 |
| Fixed Asset Turnover | 5.59 | 2.12 |
| Payout ratio | 4.64 | 0.31 |
| Dividend yield | 12.55% | 0.87% |
Interpretation of the Ratios
TransDigm Group Incorporated
TransDigm shows a mixed ratio profile with strong net margin (23.49%) and return on invested capital (15.22%), but negative return on equity (-21.41%) and high debt to assets (131.08%) signal financial risks. The current ratio is high but marked unfavorable, indicating liquidity concerns. Dividend yield is robust at 12.55%, suggesting significant shareholder returns, though risks of unsustainable payouts exist.
BWX Technologies, Inc.
BWXT presents a generally favorable ratio set with a positive net margin (10.43%), strong return on equity (26.09%), and manageable debt levels (debt to assets 37.51%). Liquidity ratios are solid, and interest coverage is notably favorable at 9.83. Dividend yield is low (0.87%), reflecting modest direct shareholder returns, possibly prioritizing reinvestment or growth strategies instead.
Which one has the best ratios?
Both companies have a balanced mix of favorable and unfavorable ratios, each scoring 50% in favorable metrics. TransDigm’s higher profitability contrasts with its leverage and liquidity risks, while BWXT shows steadier equity returns and healthier financial structure but lower dividend yield. Overall, both are slightly favorable, but their financial profiles suit different risk preferences.
Strategic Positioning
This section compares the strategic positioning of TransDigm Group Incorporated and BWX Technologies, Inc., including market position, key segments, and exposure to technological disruption:
TransDigm Group Incorporated
- Leading aerospace components supplier with broad market and moderate competitive pressure.
- Diverse segments: Airframe, Power & Control, Non-aviation related business driving growth.
- Exposure to aerospace and defense tech with incremental innovation in mechanical and electro-mechanical systems.
BWX Technologies, Inc.
- Specialized nuclear components manufacturer with niche market and focused competition.
- Three nuclear segments: Operations, Power, and Services, mainly government and commercial.
- Exposure to nuclear technology disruption through advanced reactor and fuel innovations.
TransDigm Group Incorporated vs BWX Technologies, Inc. Positioning
TransDigm adopts a diversified aerospace components approach across multiple sectors, while BWXT focuses on nuclear technology with government and commercial clients. TransDigm’s broad segment mix contrasts with BWXT’s specialized nuclear operations, presenting differing market scope and complexity.
Which has the best competitive advantage?
TransDigm exhibits a very favorable moat with growing ROIC and strong value creation, indicating durable competitive advantage. BWXT shows a slightly favorable moat with declining ROIC despite value creation, suggesting less stable profitability.
Stock Comparison
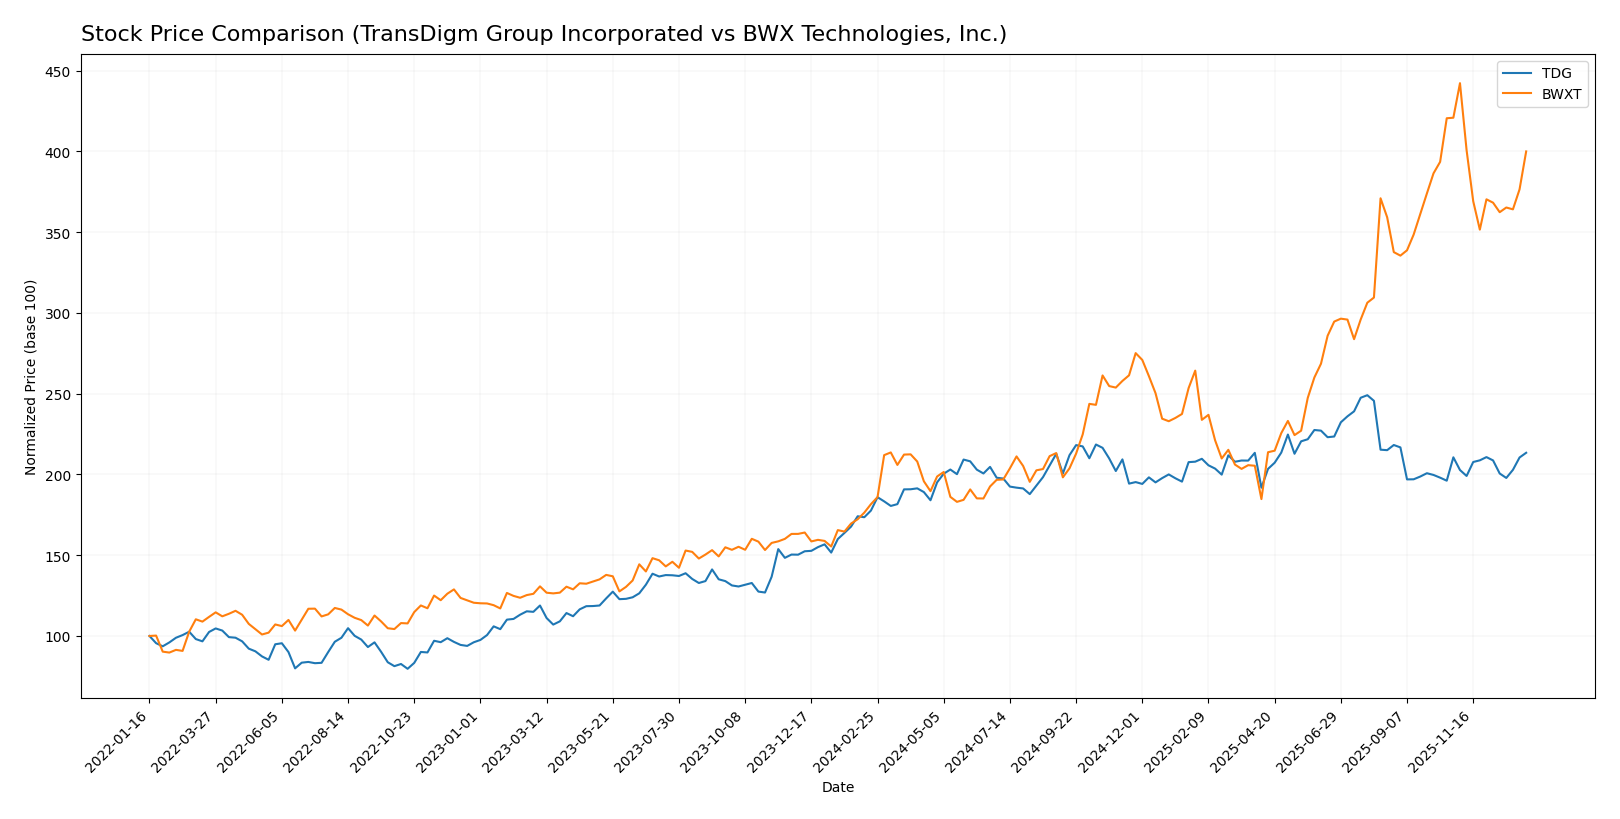
The stock prices of TransDigm Group Incorporated (TDG) and BWX Technologies, Inc. (BWXT) have shown significant price movements and distinct trading dynamics over the past year, reflecting differing investor sentiment and market performance.
Trend Analysis
TransDigm Group Incorporated (TDG) experienced a bullish trend over the past 12 months with a price increase of 20.15%. The trend showed deceleration, with a high volatility reflected by a standard deviation of 89.71. The stock price ranged from a low of 1146.39 to a high of 1607.45.
BWX Technologies, Inc. (BWXT) demonstrated a stronger bullish trend over the same period, with a 120.27% price increase. This trend also decelerated, but with lower volatility at a standard deviation of 33.8. The stock price ranged between 87.71 and 213.61.
Comparing the two, BWXT delivered the highest market performance over the past year, significantly outperforming TDG in percentage price growth despite lower volatility.
Target Prices
Here is the current target price consensus for selected aerospace and defense companies based on verified analyst data:
| Company | Target High | Target Low | Consensus |
|---|---|---|---|
| TransDigm Group Incorporated | 1660 | 1370 | 1506.17 |
| BWX Technologies, Inc. | 225 | 180 | 200 |
Analysts expect TransDigm shares to appreciate moderately above the current price of $1377.42, while BWXT is anticipated to grow slightly from its current $193.20 price. Both show a cautiously optimistic outlook.
Analyst Opinions Comparison
This section compares analysts’ ratings and financial scores for TransDigm Group Incorporated and BWX Technologies, Inc.:
Rating Comparison
TDG Rating
- Rating: C+ with a very favorable status
- Discounted Cash Flow Score: 3, moderate
- ROE Score: 1, very unfavorable
- ROA Score: 5, very favorable
- Debt To Equity Score: 1, very unfavorable
BWXT Rating
- Rating: B- with a very favorable status
- Discounted Cash Flow Score: 3, moderate
- ROE Score: 5, very favorable
- ROA Score: 4, favorable
- Debt To Equity Score: 1, very unfavorable
Which one is the best rated?
BWXT holds a better overall rating (B-) compared to TDG’s C+, supported by stronger ROE and ROA scores. Both share moderate DCF scores and very unfavorable debt-to-equity scores, but BWXT’s financial efficiency metrics appear more favorable.
Scores Comparison
Here is a comparison of the Altman Z-Score and Piotroski Score for both companies:
TDG Scores
- Altman Z-Score: 1.91, positioned in the grey zone indicating moderate risk.
- Piotroski Score: 6, classified as average financial strength.
BWXT Scores
- Altman Z-Score: 6.55, in the safe zone indicating low bankruptcy risk.
- Piotroski Score: 5, also classified as average financial strength.
Which company has the best scores?
BWXT has a significantly higher Altman Z-Score, placing it firmly in the safe zone, while TDG is in the grey zone. Both have average Piotroski Scores, with TDG slightly higher at 6 versus 5 for BWXT.
Grades Comparison
Here is a comparison of the latest grades from recognized financial institutions for the two companies:
TransDigm Group Incorporated Grades
This table summarizes recent grades assigned by major financial firms to TransDigm Group Incorporated:
| Grading Company | Action | New Grade | Date |
|---|---|---|---|
| JP Morgan | Maintain | Neutral | 2025-11-14 |
| Morgan Stanley | Maintain | Overweight | 2025-11-14 |
| RBC Capital | Maintain | Sector Perform | 2025-11-13 |
| BMO Capital | Maintain | Outperform | 2025-11-13 |
| UBS | Maintain | Buy | 2025-11-13 |
| Stifel | Maintain | Buy | 2025-11-13 |
| Morgan Stanley | Maintain | Overweight | 2025-10-15 |
| Truist Securities | Maintain | Buy | 2025-10-15 |
| Susquehanna | Maintain | Neutral | 2025-10-09 |
| Jefferies | Maintain | Buy | 2025-09-17 |
Grades for TransDigm Group show a consistent trend of buy-related recommendations, with several firms maintaining a Buy or Overweight stance, indicating general confidence in the stock.
BWX Technologies, Inc. Grades
Below are the recent grades from reputable firms for BWX Technologies, Inc.:
| Grading Company | Action | New Grade | Date |
|---|---|---|---|
| B of A Securities | Maintain | Buy | 2025-11-13 |
| BTIG | Maintain | Buy | 2025-11-07 |
| Truist Securities | Maintain | Hold | 2025-11-04 |
| Truist Securities | Maintain | Hold | 2025-10-15 |
| Deutsche Bank | Maintain | Hold | 2025-10-08 |
| B of A Securities | Maintain | Buy | 2025-08-13 |
| Deutsche Bank | Maintain | Hold | 2025-08-06 |
| Maxim Group | Downgrade | Hold | 2025-08-06 |
| Truist Securities | Maintain | Hold | 2025-08-05 |
| Deutsche Bank | Downgrade | Hold | 2025-07-08 |
BWX Technologies exhibits a more mixed rating profile, with a noticeable number of Hold ratings and some downgrades from Buy to Hold, suggesting more cautious analyst sentiment.
Which company has the best grades?
TransDigm Group Incorporated holds stronger and more consistent positive grades compared to BWX Technologies, which has more Hold ratings and downgrades. This suggests that TransDigm is currently viewed more favorably, potentially affecting investor confidence and portfolio decisions.
Strengths and Weaknesses
Below is a comparative overview of key strengths and weaknesses for TransDigm Group Incorporated (TDG) and BWX Technologies, Inc. (BWXT), based on the latest available financial and operational data.
| Criterion | TransDigm Group Incorporated (TDG) | BWX Technologies, Inc. (BWXT) |
|---|---|---|
| Diversification | Strong product diversification across Airframe and Power & Control segments, with Non-Aviation business adding minor revenue (4B+ and 4.5B in main segments). | Moderate diversification with Government and Commercial Operations segments, Government segment dominant (~2.2B vs 0.5B). |
| Profitability | High net margin (23.5%), favorable ROIC (15.2%), but negative ROE (-21.4%) and some liquidity concerns. | Moderate net margin (10.4%), favorable ROE (26.1%) and ROIC (12.8%), with generally stable liquidity ratios. |
| Innovation | Consistent growth in ROIC (+73% trend) suggests strong operational efficiency and innovation. | Declining ROIC (-14%) trend indicates challenges in sustaining profitability improvements. |
| Global presence | Global footprint supported by diverse aerospace product lines, increasing revenues year-over-year. | Mainly focused on nuclear technology with significant government contracts, more specialized global reach. |
| Market Share | Strong market position in aerospace components with growing revenues and durable competitive advantage. | Stable market presence in nuclear sectors, but with smaller commercial segment and profitability pressure. |
Key takeaways: TransDigm shows a robust competitive moat with growing profitability and diversified aerospace portfolio, although some financial ratios signal caution. BWXT maintains solid profitability and government contracts but faces declining returns and narrower diversification. Investors should balance growth potential with risk exposure accordingly.
Risk Analysis
Below is a comparison of key risks for TransDigm Group Incorporated (TDG) and BWX Technologies, Inc. (BWXT) based on the most recent financial and operational data from 2025 and 2024 respectively:
| Metric | TransDigm Group Incorporated (TDG) | BWX Technologies, Inc. (BWXT) |
|---|---|---|
| Market Risk | Moderate (beta 0.917) | Moderate (beta 0.852) |
| Debt Level | Very High (Debt-to-Assets 131.08%) | Moderate (Debt-to-Assets 37.51%) |
| Regulatory Risk | Moderate (Aerospace & Defense sector, complex compliance) | High (Nuclear industry, strict regulations) |
| Operational Risk | Moderate (Complex supply chains, diverse product lines) | High (Nuclear components, critical safety requirements) |
| Environmental Risk | Moderate (Manufacturing footprint, aerospace sector) | High (Nuclear materials handling and waste) |
| Geopolitical Risk | Moderate (Global aerospace markets exposure) | High (Defense and nuclear contracts linked to government policy) |
The most significant risks are BWXT’s regulatory, operational, and environmental risks due to its involvement in nuclear technologies, which demand stringent compliance and carry high safety stakes. TDG faces a critical financial risk with its extremely high debt level, signaling potential leverage concerns despite favorable operational margins. Investors should weigh BWXT’s stable financial health and regulatory complexities against TDG’s financial leverage and market dynamics when considering portfolio inclusion.
Which Stock to Choose?
TransDigm Group Incorporated (TDG) exhibits strong income growth with an 84% revenue increase over five years and favorable margins, including a 23.49% net margin in 2025. Its financial ratios show mixed signals: half favorable, some unfavorable, with a notable negative return on equity and high debt levels. The company demonstrates a very favorable moat with growing ROIC exceeding WACC, but ratings reflect moderate overall scores and some concerns on equity returns and leverage.
BWX Technologies, Inc. (BWXT) shows moderate income growth of 27% over five years, with stable profitability and a 10.43% net margin in 2024. Its financial ratios are slightly more balanced, with half favorable and fewer unfavorable measures, including positive returns on equity and moderate debt levels. The moat is slightly favorable, indicating value creation but with a declining ROIC trend. Ratings are slightly better overall, with strong return on equity but unfavorable valuation ratios.
For investors prioritizing durable competitive advantage and strong recent income growth, TDG might appear more favorable due to its very favorable moat and robust income statement despite some financial leverage risks. Conversely, those favoring steady profitability and balanced ratios could find BWXT more attractive, given its stable returns and safer financial scores. Ultimately, the preference may depend on whether an investor tolerates higher leverage and variability for growth or prefers steadier financial stability.
Disclaimer: Investment carries a risk of loss of initial capital. The past performance is not a reliable indicator of future results. Be sure to understand risks before making an investment decision.
Go Further
I encourage you to read the complete analyses of TransDigm Group Incorporated and BWX Technologies, Inc. to enhance your investment decisions: