Home > Comparison > Industrials > BA vs BWXT
The strategic rivalry between The Boeing Company and BWX Technologies, Inc. shapes the future of the aerospace & defense sector. Boeing operates as a capital-intensive industrial giant with diversified aerospace manufacturing and services. BWX Technologies focuses on specialized nuclear components and services with a precision-driven niche model. This analysis will assess which company’s operational strategy offers superior risk-adjusted returns for diversified portfolios navigating complex industrial cycles.
Table of contents
Companies Overview
The Boeing Company and BWX Technologies, Inc. hold pivotal roles in aerospace and defense, shaping critical sectors globally.
The Boeing Company: Aerospace & Defense Giant
The Boeing Company dominates as a leader in commercial and military aerospace. It generates revenue by designing, manufacturing, and servicing commercial jetliners, military aircraft, satellites, and defense systems. In 2026, Boeing focuses strategically on expanding its Global Services segment, enhancing digital analytics and fleet support to sustain competitive advantage in a complex geopolitical environment.
BWX Technologies, Inc.: Nuclear Components Specialist
BWX Technologies excels as a key provider of nuclear components and services for defense and commercial power sectors. Its revenue stems from manufacturing reactors, nuclear fuel, and precision components mostly for government and energy clients. In 2026, BWXT prioritizes innovation in nuclear materials processing and power generation technologies, leveraging its specialized expertise to meet evolving energy and defense demands.
Strategic Collision: Similarities & Divergences
Both companies operate in aerospace and defense but differ fundamentally in scope. Boeing pursues a broad aerospace ecosystem integrating commercial aviation and defense, while BWXT maintains a focused niche in nuclear technology. Their primary battleground lies in defense contracting, but Boeing’s diversified portfolio contrasts with BWXT’s specialized approach. Investors face distinct risk profiles rooted in Boeing’s scale and BWXT’s concentration.
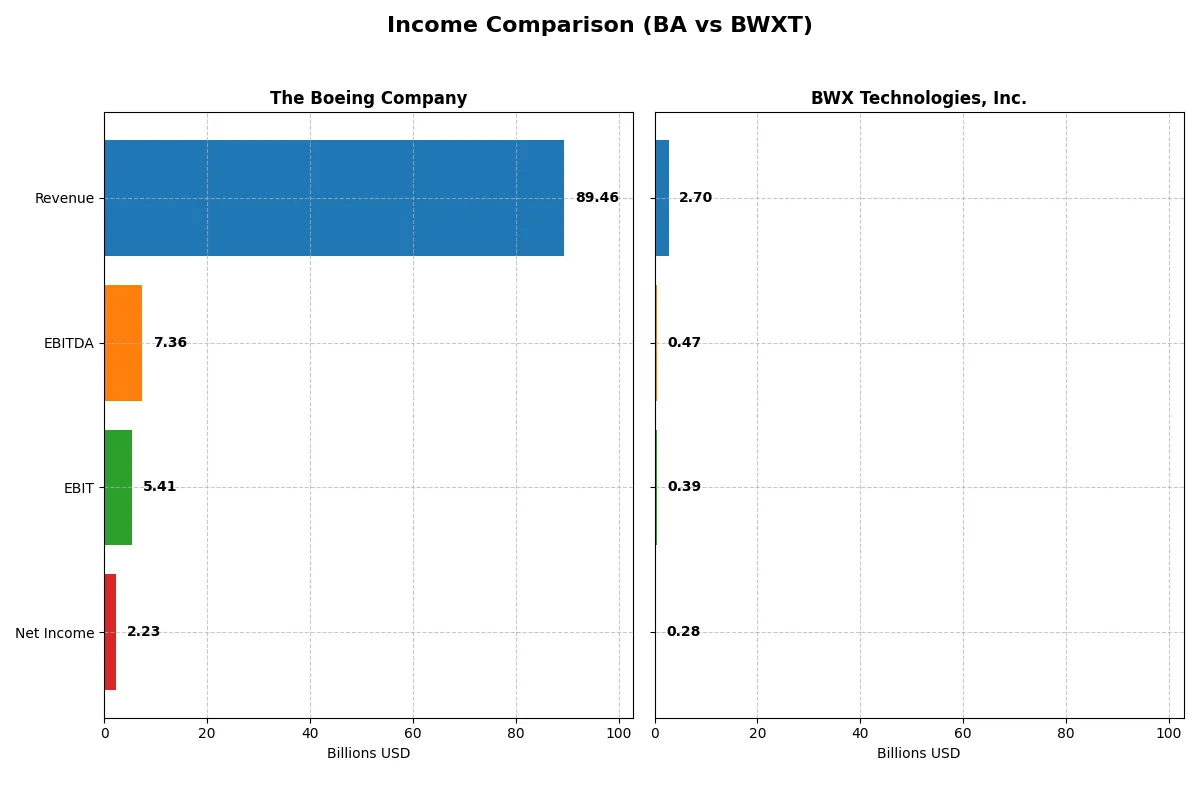
Income Statement Comparison
This data dissects the core profitability and scalability of both corporate engines to reveal who dominates the bottom line:
| Metric | The Boeing Company (BA) | BWX Technologies, Inc. (BWXT) |
|---|---|---|
| Revenue | 89.5B | 2.7B |
| Cost of Revenue | 85.2B | 2.0B |
| Operating Expenses | 9.7B | 275M |
| Gross Profit | 4.3B | 655M |
| EBITDA | 7.4B | 474M |
| EBIT | 5.4B | 388M |
| Interest Expense | 2.8B | 39M |
| Net Income | 2.2B | 282M |
| EPS | 2.49 | 3.08 |
| Fiscal Year | 2025 | 2024 |
Income Statement Analysis: The Bottom-Line Duel
This income statement comparison reveals which company runs a more efficient and profitable corporate engine in a challenging market environment.
The Boeing Company Analysis
Boeing’s revenue climbed sharply from $62B in 2021 to nearly $89.5B in 2025, reversing prior losses into a $2.2B net income in 2025. Gross and net margins remain thin but improved substantially, reflecting a recovery in operational efficiency. The 2025 surge signals strong momentum after years of negative earnings and margin pressure.
BWX Technologies, Inc. Analysis
BWXT steadily grew revenue from $2.1B in 2020 to $2.7B in 2024, maintaining consistently healthy gross (24.2%) and net margins (10.4%). Despite modest net income growth overall, BWXT’s margins and profitability demonstrate stable operational discipline. The latest year shows solid earnings expansion and margin resilience amid rising costs.
Margin Recovery vs. Margin Consistency
Boeing’s dramatic turnaround in revenue and profitability outpaces BWXT’s steadier growth but at a historically volatile margin profile. BWXT delivers reliable, superior margins with gradual income gains. For investors, Boeing offers high-reward recovery potential, while BWXT provides a consistent margin-rich profile with lower volatility.
Financial Ratios Comparison
These vital ratios act as a diagnostic tool to expose the underlying fiscal health, valuation premiums, and capital efficiency of the companies compared below:
| Ratios | The Boeing Company (BA) | BWX Technologies, Inc. (BWXT) |
|---|---|---|
| ROE | 41.0% | 26.1% |
| ROIC | -6.7% | 12.8% |
| P/E | 74.1 | 36.2 |
| P/B | 30.3 | 9.44 |
| Current Ratio | 1.27 | 1.96 |
| Quick Ratio | 0.49 | 1.88 |
| D/E (Debt to Equity) | 9.92 | 0.98 |
| Debt-to-Assets | 32.2% | 36.8% |
| Interest Coverage | -1.95 | 9.64 |
| Asset Turnover | 0.53 | 0.94 |
| Fixed Asset Turnover | 5.73 | 2.12 |
| Payout ratio | 14.8% | 31.3% |
| Dividend yield | 0.20% | 0.87% |
| Fiscal Year | 2025 | 2024 |
Efficiency & Valuation Duel: The Vital Signs
Ratios act as the company’s DNA, revealing hidden risks and operational excellence through profitability, valuation, and liquidity metrics.
The Boeing Company
Boeing posts a robust ROE near 41%, signaling strong shareholder returns despite a slim 2.5% net margin. Its valuation appears stretched with a P/E of 74 and P/B above 30, reflecting market optimism or risk. Dividend yield is low at 0.2%, hinting at limited payouts and reinvestment focused on R&D and growth amid operational challenges.
BWX Technologies, Inc.
BWXT delivers solid profitability with a 26% ROE and a healthy 10.4% net margin, underscoring efficient operations. Its valuation is more moderate, with a P/E at 36 and P/B near 9.4, suggesting reasonable market expectations. The company maintains favorable liquidity and interest coverage, returning value modestly with a sub-1% dividend yield.
Valuation Stretch vs. Operational Strength
Boeing’s exceptionally high valuation contrasts with weaker profitability and liquidity, posing elevated risk despite strong equity returns. BWXT balances solid margins and returns with a more conservative valuation and stronger liquidity. Investors seeking operational safety and steadier fundamentals may favor BWXT’s profile over Boeing’s stretched metrics.
Which one offers the Superior Shareholder Reward?
I see Boeing (BA) offers a near-zero dividend yield at 0.2% with a low payout ratio of 14.8%, but it suffers negative free cash flow (-$2.5/share) and weak buyback activity, signaling financial strain. BWX Technologies (BWXT) pays a solid 0.87%-1.5% dividend yield, maintains a 31%-34% payout ratio, and delivers robust free cash flow ($2.8/share) supporting consistent buybacks. BWXT’s balanced mix of dividends and buybacks signals sustainable capital return and long-term value creation. In 2026, BWXT clearly offers the superior total shareholder reward with stronger cash flow, healthier margins, and prudent capital allocation.
Comparative Score Analysis: The Strategic Profile
The radar chart reveals the fundamental DNA and trade-offs of The Boeing Company and BWX Technologies, Inc., highlighting their core financial strengths and vulnerabilities:
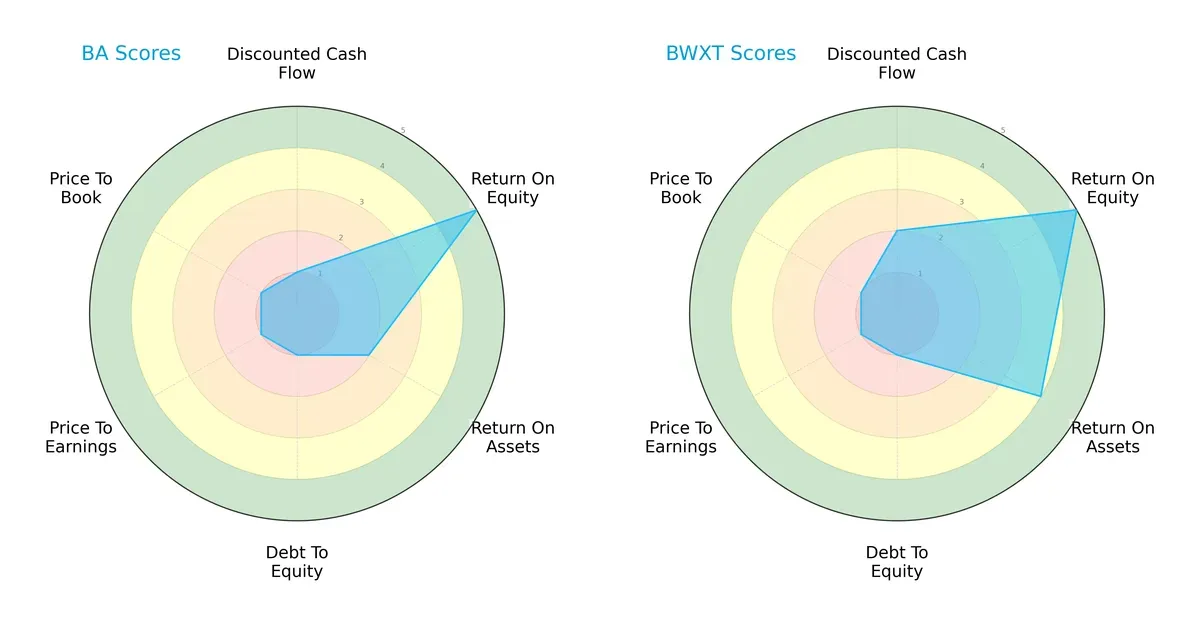
BWXT shows a more balanced profile with moderate DCF (2) and strong ROA (4) scores, whereas BA relies heavily on ROE (5) but suffers from very unfavorable DCF (1) and leverage (debt-to-equity 1) metrics. Both firms face valuation challenges with low P/E and P/B scores, but BWXT’s asset efficiency and cash flow outlook edge it ahead.
Bankruptcy Risk: Solvency Showdown
The Altman Z-Score gap signals divergent survival prospects in this cycle:
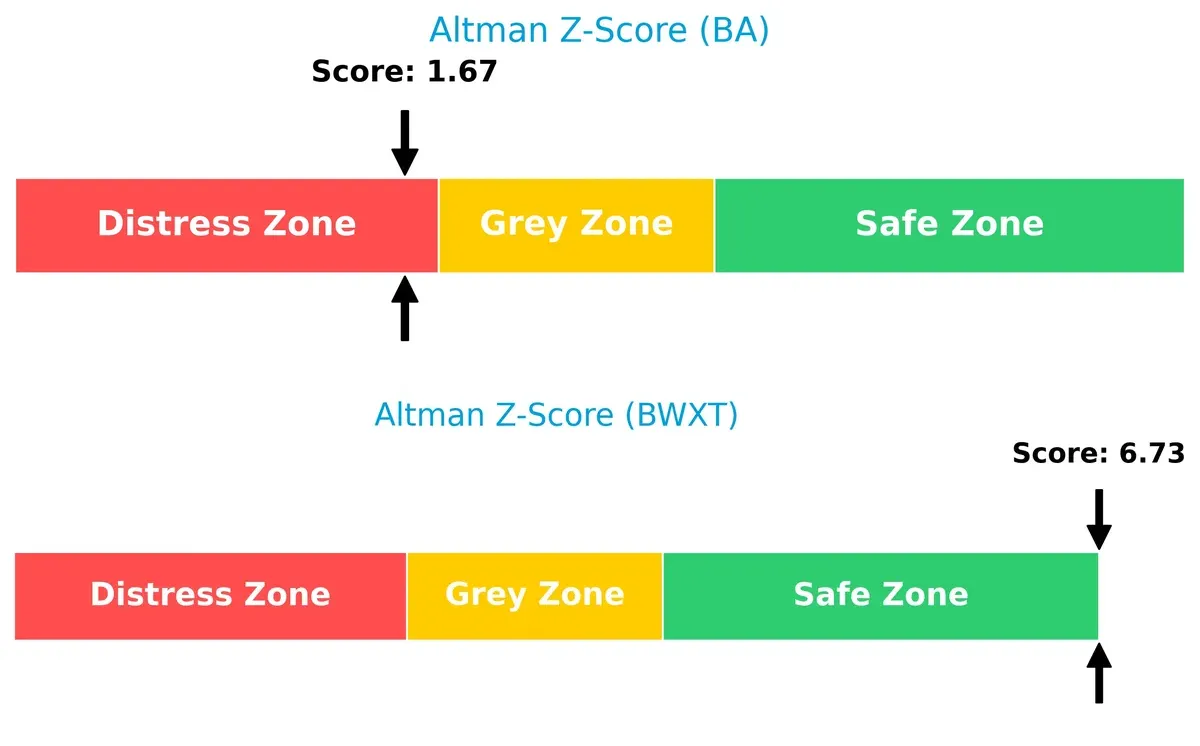
BWXT’s score of 6.7 places it securely in the safe zone, indicating robust financial stability and low bankruptcy risk. In contrast, BA’s 1.7 score lands in the distress zone, raising red flags about its long-term solvency under current market pressures.
Financial Health: Quality of Operations
Piotroski F-Scores indicate operational quality and internal financial health:
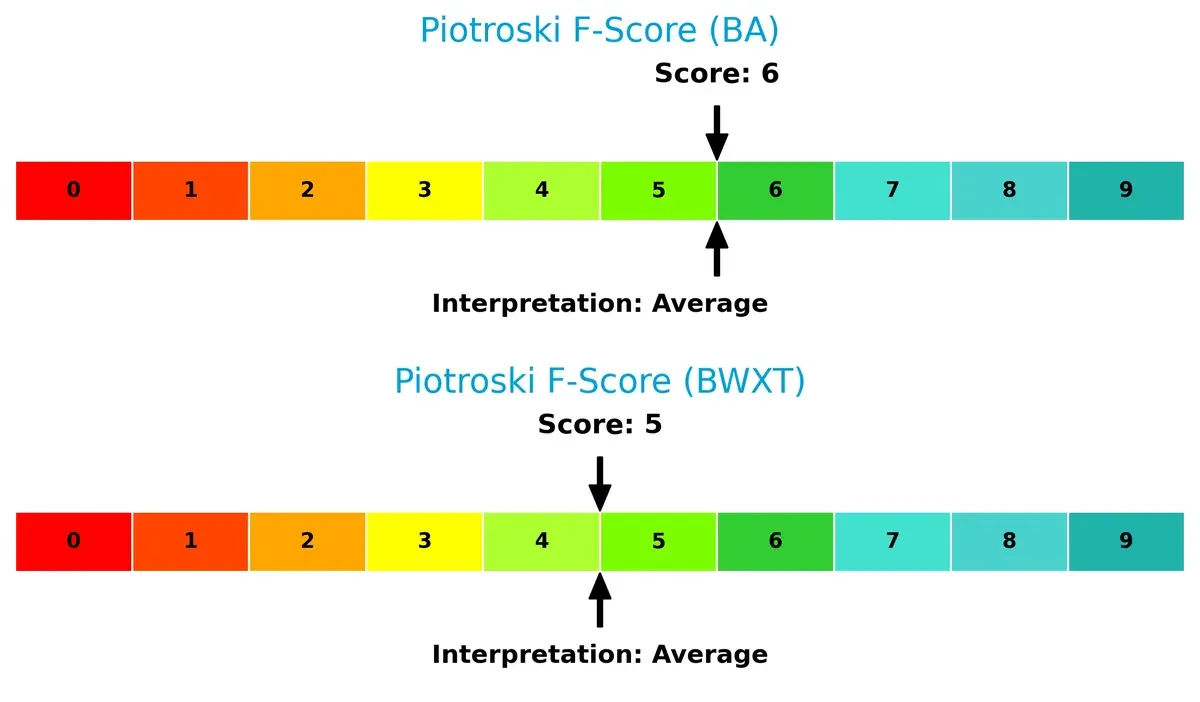
BA and BWXT both hold average scores (6 and 5 respectively), suggesting neither is in peak financial condition. However, BA’s slightly higher score may reflect marginally better internal controls, though neither company demonstrates the strong fundamentals typically preferred for value investing.
How are the two companies positioned?
This section dissects the operational DNA of BA and BWXT by comparing their revenue distribution by segment and internal dynamics. The goal is to confront their economic moats to identify which model offers the most resilient, sustainable competitive advantage today.
Revenue Segmentation: The Strategic Mix
This visual comparison dissects how The Boeing Company and BWX Technologies diversify their income streams and reveals their primary sector bets:
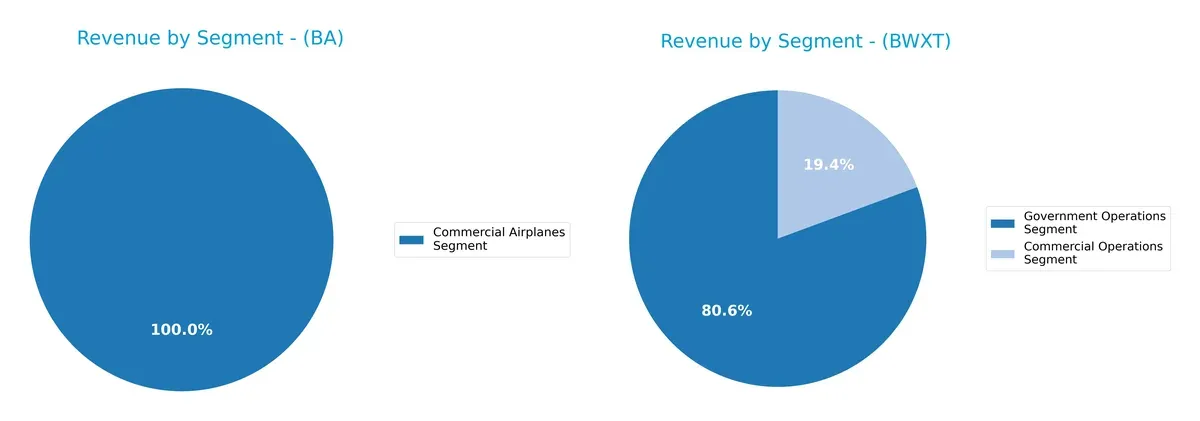
Boeing displays a broad revenue base, anchoring its portfolio in Commercial Airplanes ($41.5B in 2025) and Defense Space Security ($23.9B in 2024). It balances these with sizable Global Services revenues ($19.9B). BWX Technologies relies heavily on its Government Operations segment ($2.18B in 2024), with a smaller Commercial Operations slice ($524M). Boeing’s diversification mitigates concentration risk, while BWXT’s focus signals dependency on stable government contracts but less sector spread.
Strengths and Weaknesses Comparison
This table compares the strengths and weaknesses of The Boeing Company (BA) and BWX Technologies, Inc. (BWXT):
BA Strengths
- Diversified revenue streams across Commercial Airplanes, Defense, and Global Services
- Strong global presence including US, Asia, Europe, Middle East
- High ROE at 41%, indicating efficient equity use
- Favorable fixed asset turnover at 5.73, showing efficient asset use
BWXT Strengths
- Favorable net margin at 10.43% and ROIC at 12.79%, reflecting strong profitability
- Strong liquidity with current ratio 1.96 and quick ratio 1.88
- Favorable interest coverage at 9.83, indicating low financial risk
- Focused operations with Government and Commercial segments, enabling specialized market share
BA Weaknesses
- Low net margin at 2.5% and negative ROIC of -6.71%, indicating poor capital efficiency
- High P/E of 74.05 and P/B of 30.35, suggesting overvaluation risk
- Weak quick ratio at 0.49 and high debt-to-equity of 9.92, raising liquidity and leverage concerns
- Low dividend yield at 0.2% and low interest coverage at 1.95, increasing financial vulnerability
BWXT Weaknesses
- Unfavorable valuation multiples with P/E 36.18 and P/B 9.44
- Dividend yield low at 0.87%, limiting income appeal
- Debt-to-assets ratio neutral at 36.78%, warranting monitoring
- Asset turnover and fixed asset turnover neutral, indicating average asset efficiency
Overall, BA demonstrates broad diversification and global reach but struggles with profitability and leverage issues. BWXT shows stronger profitability and liquidity but faces valuation and income yield challenges. Both companies’ financial health and market positions suggest distinct strategic priorities.
The Moat Duel: Analyzing Competitive Defensibility
A structural moat protects long-term profits from relentless competition erosion. Without it, gains quickly vanish:
The Boeing Company: Scale and Diversification Moat
Boeing’s vast aerospace and defense scale creates a cost and complexity barrier. Margins remain thin, ROIC lags WACC, signaling value erosion. New space initiatives could deepen or dilute this moat by 2026.
BWX Technologies, Inc.: Specialized Nuclear Expertise Moat
BWXT’s niche in nuclear components drives higher margins and ROIC above WACC, reflecting strong value creation. Its focus contrasts Boeing’s scale. Expansion in medical isotopes offers growth but rising costs pose risks.
Verdict: Scale Complexity vs. Specialized Nuclear Edge
Boeing’s broad footprint offers scale but currently destroys value with declining ROIC. BWXT’s narrower, specialized moat yields positive value despite profitability headwinds. BWXT stands better positioned to defend its market share.
Which stock offers better returns?
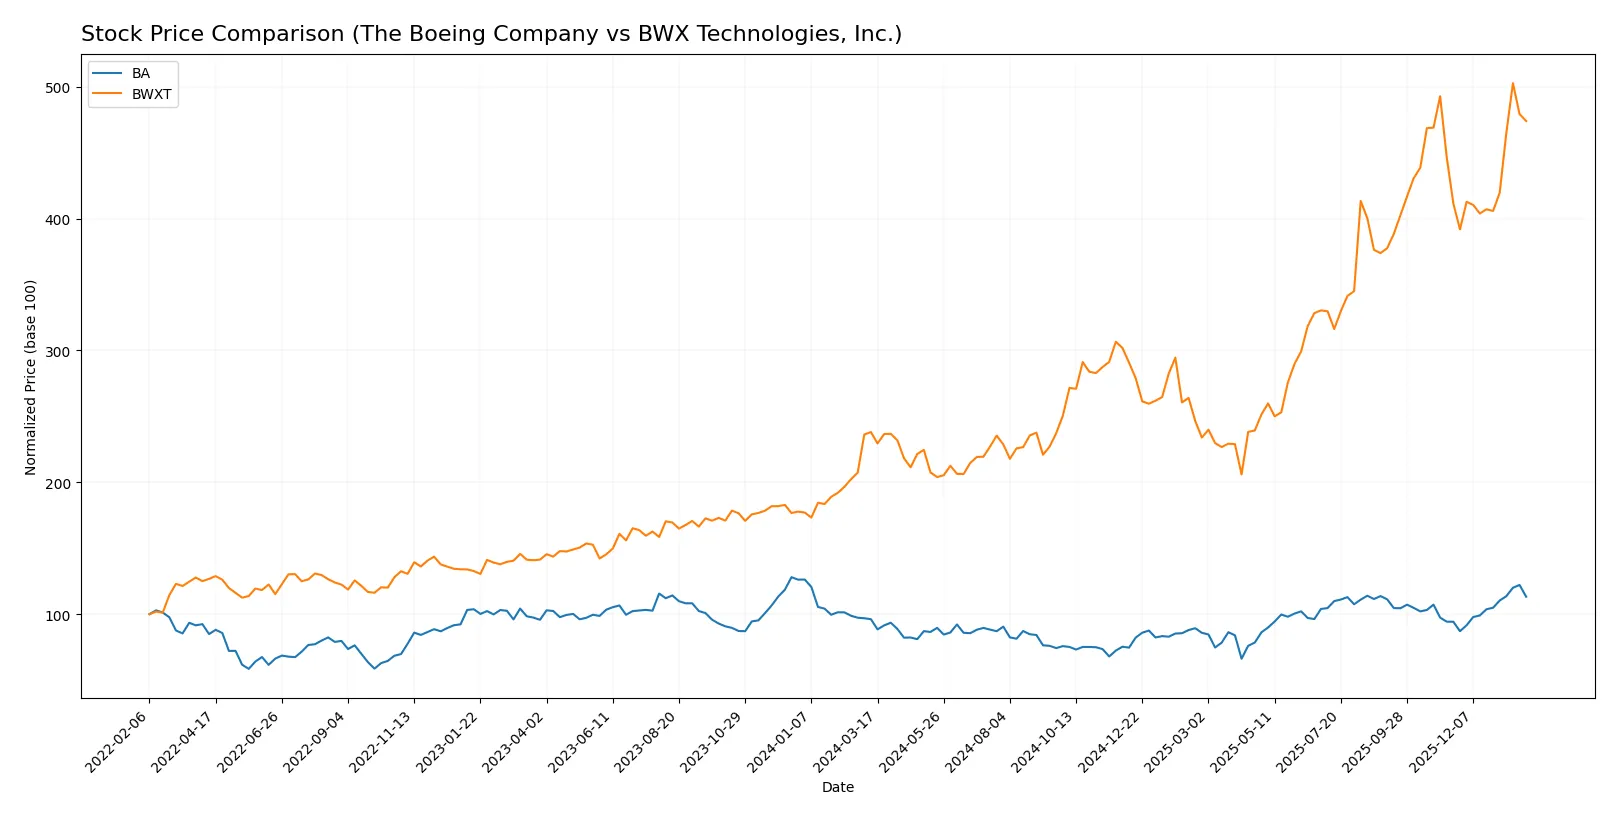
The past year shows distinct bullish trends for both stocks, with BWXT nearly doubling, while BA shows steady gains amid rising trading volumes and shifting buyer-seller dynamics.
Trend Comparison
The Boeing Company’s stock rose 17.75% over 12 months, displaying acceleration and a high volatility of 26.41. It hit a low of 136.59 and peaked at 252.15, signaling a strong upward trend.
BWX Technologies, Inc. surged 99.08% in the same period with acceleration and higher volatility of 36.35. It ranged between 88.41 and 217.89, marking a pronounced bullish momentum.
BWXT outperformed BA by a wide margin, delivering nearly 100% growth versus 18%. BWXT’s stock exhibits the highest market performance over the past year.
Target Prices
Analysts present a confident target price range, reflecting varied but optimistic views for these aerospace and defense stocks.
| Company | Target Low | Target High | Consensus |
|---|---|---|---|
| The Boeing Company | 150 | 298 | 256.73 |
| BWX Technologies, Inc. | 180 | 225 | 204 |
The Boeing Company’s consensus target sits about 10% above its current price of $233.72, implying moderate upside. BWXT trades near its consensus target of $204, suggesting limited near-term price appreciation.

Don’t Let Luck Decide Your Entry Point
Optimize your entry points with our advanced ProRealTime indicators. You’ll get efficient buy signals with precise price targets for maximum performance. Start outperforming now!
How do institutions grade them?
Here is a comparison of recent institutional grades for The Boeing Company and BWX Technologies, Inc.:
The Boeing Company Grades
This table summarizes the latest grades issued by well-known financial institutions for The Boeing Company.
| Grading Company | Action | New Grade | Date |
|---|---|---|---|
| Citigroup | Maintain | Buy | 2026-01-28 |
| UBS | Maintain | Buy | 2026-01-28 |
| RBC Capital | Maintain | Outperform | 2026-01-28 |
| JP Morgan | Maintain | Overweight | 2026-01-28 |
| Bernstein | Maintain | Outperform | 2026-01-15 |
| Citigroup | Maintain | Buy | 2026-01-13 |
| JP Morgan | Maintain | Overweight | 2025-12-19 |
| Susquehanna | Maintain | Positive | 2025-11-12 |
| Freedom Capital Markets | Upgrade | Buy | 2025-11-03 |
| JP Morgan | Maintain | Overweight | 2025-10-30 |
BWX Technologies, Inc. Grades
This table presents the latest grades from recognized financial firms for BWX Technologies, Inc.
| Grading Company | Action | New Grade | Date |
|---|---|---|---|
| Seaport Global | Downgrade | Neutral | 2026-01-20 |
| B of A Securities | Maintain | Buy | 2025-11-13 |
| BTIG | Maintain | Buy | 2025-11-07 |
| Truist Securities | Maintain | Hold | 2025-11-04 |
| Truist Securities | Maintain | Hold | 2025-10-15 |
| Deutsche Bank | Maintain | Hold | 2025-10-08 |
| B of A Securities | Maintain | Buy | 2025-08-13 |
| Deutsche Bank | Maintain | Hold | 2025-08-06 |
| Maxim Group | Downgrade | Hold | 2025-08-06 |
| Truist Securities | Maintain | Hold | 2025-08-05 |
Which company has the best grades?
The Boeing Company consistently earns higher grades, mainly Buy and Outperform, from major institutions. BWX Technologies’ grades are mixed with several Hold ratings and some downgrades. This disparity suggests Boeing may currently receive more institutional confidence, potentially affecting investor sentiment and valuation.
Risks specific to each company
The following categories identify the critical pressure points and systemic threats facing both firms in the 2026 market environment:
1. Market & Competition
The Boeing Company
- Faces intense competition in commercial airplanes and defense sectors with cyclical demand risks.
BWX Technologies, Inc.
- Operates in niche nuclear components market with less direct competition but reliant on government contracts.
2. Capital Structure & Debt
The Boeing Company
- High debt-to-equity ratio (9.92) signals financial risk; interest coverage barely above 1.9 raises red flags.
BWX Technologies, Inc.
- Low debt-to-equity (0.98) and strong interest coverage (9.83) indicate a healthier capital structure.
3. Stock Volatility
The Boeing Company
- Beta of 1.16 suggests higher volatility than the market, increasing investment risk.
BWX Technologies, Inc.
- Beta of 0.85 shows lower volatility, offering more stable price movements.
4. Regulatory & Legal
The Boeing Company
- Subject to strict aerospace and defense regulations; past product issues heighten legal scrutiny risks.
BWX Technologies, Inc.
- Nuclear sector highly regulated; compliance complexity and liability risks remain significant.
5. Supply Chain & Operations
The Boeing Company
- Complex global supply chains vulnerable to disruptions and cost inflation.
BWX Technologies, Inc.
- More specialized supply chain with less exposure but dependent on critical raw materials.
6. ESG & Climate Transition
The Boeing Company
- Pressure to reduce emissions in commercial aviation and defense manufacturing is mounting.
BWX Technologies, Inc.
- Nuclear energy focus ties to clean energy transition, but faces waste disposal and safety concerns.
7. Geopolitical Exposure
The Boeing Company
- Exposed to international trade tensions and defense budget fluctuations worldwide.
BWX Technologies, Inc.
- Mainly US-focused but sensitive to geopolitical shifts in nuclear policy and defense contracts.
Which company shows a better risk-adjusted profile?
BWX Technologies exhibits a stronger risk-adjusted profile thanks to its robust capital structure and lower stock volatility. Boeing’s most pressing risk is its heavy debt load combined with weak profitability and liquidity metrics. BWX’s chief risk lies in regulatory and geopolitical uncertainties intrinsic to nuclear operations. Boeing’s Altman Z-Score in the distress zone and weak interest coverage highlight serious financial distress, unlike BWX, which resides safely above distress thresholds. This contrast underscores BWX’s superior resilience in 2026’s challenging aerospace and defense landscape.
Final Verdict: Which stock to choose?
The Boeing Company’s superpower lies in its impressive return on equity and robust revenue growth, signaling a potential rebound in operational efficiency. However, its declining ROIC and high leverage remain points of vigilance. This stock might suit aggressive growth investors willing to weather volatility for possible long-term payoffs.
BWX Technologies benefits from a clear strategic moat with consistent value creation and strong profitability metrics. Its healthier balance sheet and stable cash flows offer better financial safety relative to Boeing. BWXT appears more aligned with investors seeking growth at a reasonable price with moderate risk exposure.
If you prioritize dynamic growth and can tolerate financial risk, Boeing outshines with its rebound potential and scale. However, if you seek better stability and consistent value creation, BWXT offers a compelling profile despite a slightly declining ROIC trend. Each stock fits distinct investor avatars balancing growth ambition against financial prudence.
Disclaimer: Investment carries a risk of loss of initial capital. The past performance is not a reliable indicator of future results. Be sure to understand risks before making an investment decision.
Go Further
I encourage you to read the complete analyses of The Boeing Company and BWX Technologies, Inc. to enhance your investment decisions: