Home > Comparison > Industrials > RTX vs BWXT
The strategic rivalry between RTX Corporation and BWX Technologies defines the current trajectory of the Industrials sector. RTX dominates aerospace and defense with a diversified, capital-intensive model spanning aircraft systems and engines. BWX focuses on specialized nuclear components and services, leveraging niche expertise in nuclear propulsion and power. This analysis pits broad industrial scale against focused innovation to identify which path delivers superior risk-adjusted returns for a balanced portfolio.
Table of contents
Companies Overview
RTX Corporation and BWX Technologies stand as pivotal players in the aerospace and defense sector with distinct market roles.
RTX Corporation: Aerospace & Defense Powerhouse
RTX dominates aerospace and defense by delivering systems and services to commercial, military, and government clients globally. Its revenue engines include Collins Aerospace, Pratt & Whitney aircraft engines, and Raytheon defense systems. In 2026, RTX focuses on integrating advanced aerospace technologies while expanding aftermarket support and defense capabilities.
BWX Technologies, Inc.: Nuclear Component Specialist
BWX Technologies specializes in manufacturing nuclear components and reactors for defense and commercial use. Core revenues come from its Nuclear Operations, Power, and Services segments supplying naval propulsion, nuclear power plants, and medical isotopes. BWXT’s 2026 strategy emphasizes innovation in nuclear fuel and reactor technology alongside expanding services for government and commercial clients.
Strategic Collision: Similarities & Divergences
Both companies serve defense and energy sectors yet diverge sharply in focus—RTX pursues a broad aerospace and defense ecosystem, while BWXT zeroes in on nuclear technology specialization. Their competitive battleground lies in government contracts and advanced technology solutions. Investors face different profiles: RTX offers scale and diversification; BWXT presents niche technological depth with concentrated market exposure.
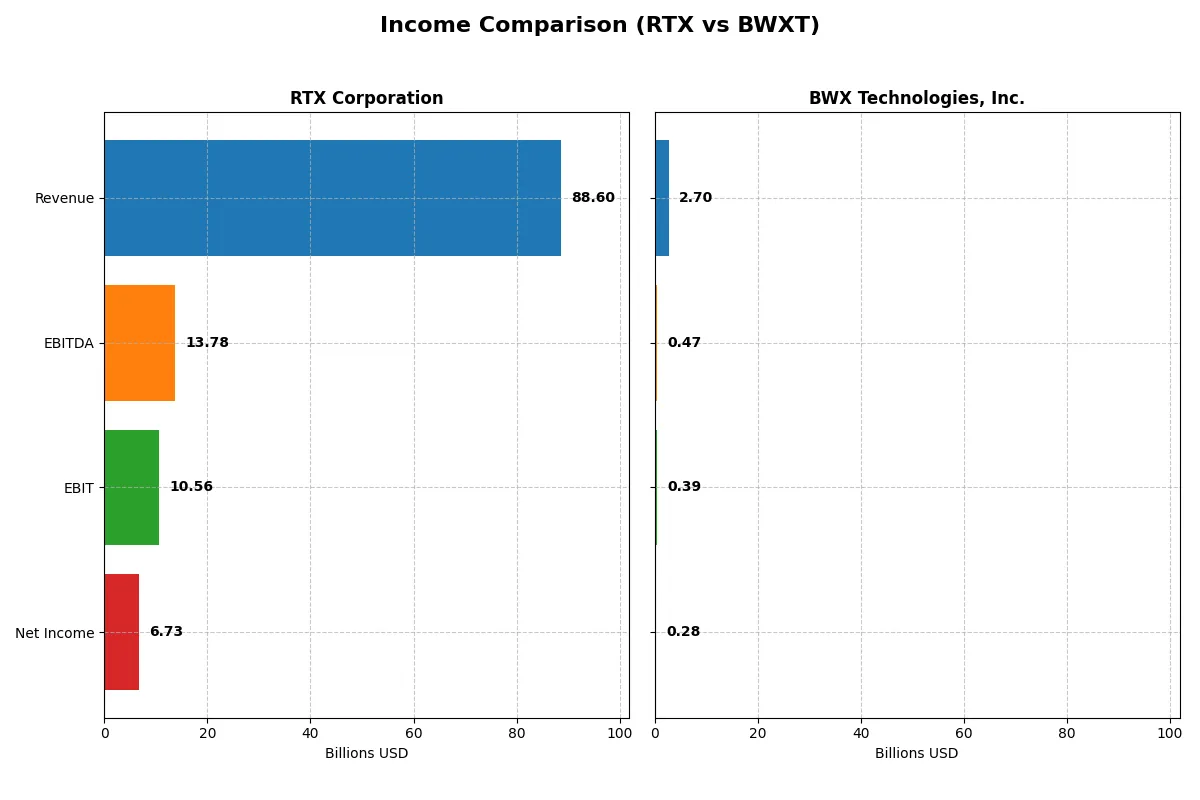
Income Statement Comparison
This data dissects the core profitability and scalability of both corporate engines to reveal who dominates the bottom line:
| Metric | RTX Corporation (RTX) | BWX Technologies, Inc. (BWXT) |
|---|---|---|
| Revenue | 88.6B | 2.7B |
| Cost of Revenue | 70.8B | 2.0B |
| Operating Expenses | 8.9B | 275M |
| Gross Profit | 17.8B | 655M |
| EBITDA | 13.8B | 474M |
| EBIT | 10.6B | 388M |
| Interest Expense | 1.8B | 39M |
| Net Income | 6.7B | 282M |
| EPS | 5.03 | 3.08 |
| Fiscal Year | 2025 | 2024 |
Income Statement Analysis: The Bottom-Line Duel
This income statement comparison reveals which company converts sales into profits with greater efficiency and long-term growth.
RTX Corporation Analysis
RTX’s revenue rose steadily from $64B in 2021 to $88.6B in 2025, with net income surging from $3.9B to $6.7B. Its gross margin of 20.1% and net margin of 7.6% in 2025 show robust profitability. The sharp 29.4% EBIT growth in the latest year signals strong operational momentum and disciplined cost control.
BWX Technologies, Inc. Analysis
BWXT’s revenue climbed from $2.12B in 2020 to $2.7B in 2024, with net income growing modestly to $282M. Its 2024 gross margin of 24.2% and net margin of 10.4% demonstrate solid margin strength. However, slower net income growth and an unfavorable rise in operating expenses relative to revenue suggest limited efficiency gains recently.
Verdict: Scale and Momentum vs. Margin Resilience
RTX dominates in revenue scale and rapid profit expansion, delivering impressive margin improvements and EPS growth. BWXT boasts stronger margins but slower overall profit growth. For investors, RTX’s dynamic earnings momentum offers a compelling profile, while BWXT’s margin resilience appeals to those favoring stability over rapid scaling.
Financial Ratios Comparison
These vital ratios act as a diagnostic tool to expose the underlying fiscal health, valuation premiums, and capital efficiency of the companies compared below:
| Ratios | RTX Corporation (RTX) | BWX Technologies, Inc. (BWXT) |
|---|---|---|
| ROE | 10.3% | 26.1% |
| ROIC | 6.2% | 12.8% |
| P/E | 36.6x | 36.2x |
| P/B | 3.78x | 9.44x |
| Current Ratio | 1.03 | 1.96 |
| Quick Ratio | 0.80 | 1.88 |
| D/E | 0.63 | 0.98 |
| Debt-to-Assets | 24.0% | 36.8% |
| Interest Coverage | 4.86x | 9.64x |
| Asset Turnover | 0.52 | 0.94 |
| Fixed Asset Turnover | 4.72 | 2.12 |
| Payout Ratio | 53.1% | 31.3% |
| Dividend Yield | 1.45% | 0.87% |
| Fiscal Year | 2025 | 2024 |
Efficiency & Valuation Duel: The Vital Signs
Financial ratios act as the company’s DNA, exposing hidden risks and operational strengths that shape investor decisions.
RTX Corporation
RTX delivers moderate profitability with a 10.3% ROE and a 7.6% net margin, reflecting neutral efficiency. Its valuation appears stretched, with a high P/E of 36.6 and P/B of 3.78, signaling premium pricing. RTX offers a 1.45% dividend yield, balancing shareholder returns with steady reinvestment in R&D at 3.2% of revenue.
BWX Technologies, Inc.
BWXT boasts strong profitability, marked by a 26.1% ROE and a 10.4% net margin, indicating operational excellence. The stock trades at a similarly high P/E of 36.2 but a notably rich P/B of 9.44, suggesting overvaluation. BWXT’s dividend yield is lower at 0.87%, reflecting a focus on growth over immediate income.
Premium Valuation vs. Operational Safety
BWXT offers superior profitability and balance sheet strength but carries a stretched valuation and lower dividend yield. RTX shows moderate returns with a more balanced dividend and reasonable operational metrics. Investors seeking growth may prefer BWXT’s profile, while those favoring income and stability might lean toward RTX.
Which one offers the Superior Shareholder Reward?
I observe RTX Corporation pays a higher dividend yield (~1.45% in 2025) with a payout ratio near 53%, well covered by free cash flow at 75%. RTX also deploys capital via buybacks, boosting total returns sustainably. BWX Technologies yields less (~0.87% in 2024) with a lower payout ratio (~31%), favoring reinvestment and moderate buybacks. BWXT’s higher operating margins and robust cash flow coverage signal growth focus but at the cost of immediate income. Comparing both, RTX’s balanced dividend and buyback approach offers a more attractive, sustainable total shareholder return profile for 2026 investors.
Comparative Score Analysis: The Strategic Profile
The radar chart reveals the fundamental DNA and trade-offs of RTX Corporation and BWX Technologies, Inc., highlighting their financial strengths and vulnerabilities:
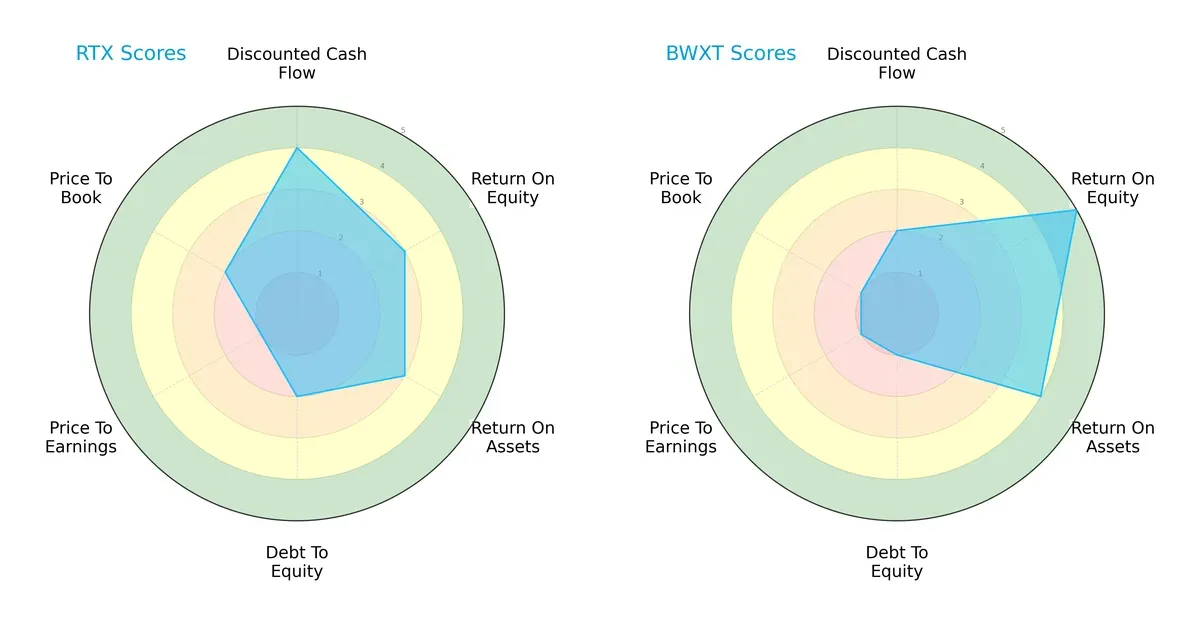
RTX shows a more balanced profile with moderate scores in ROE and ROA and a favorable DCF score. BWXT excels in profitability metrics (ROE 5, ROA 4) but suffers from high leverage risk and poor valuation scores. RTX’s broader stability contrasts with BWXT’s reliance on operational efficiency.
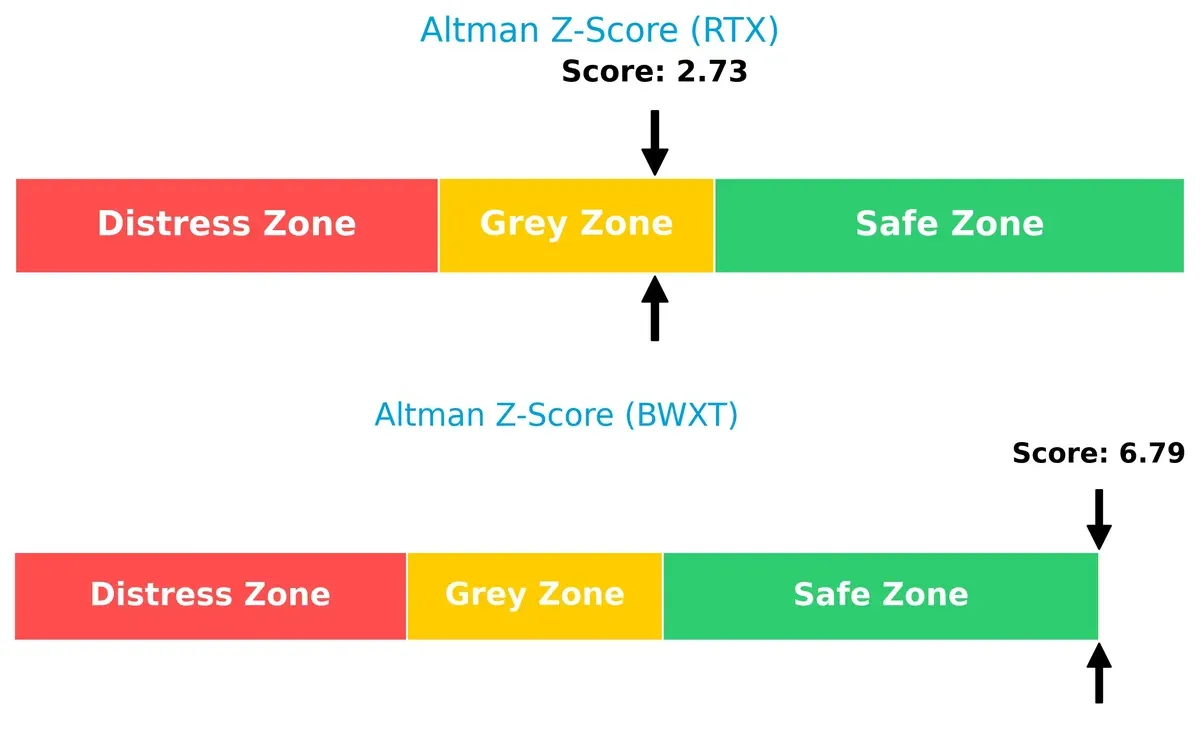
Bankruptcy Risk: Solvency Showdown
The Altman Z-Score gap signals differing risk profiles: BWXT’s 6.79 safely distances it from bankruptcy, while RTX’s 2.73 places it in a grey zone with moderate financial distress risk:
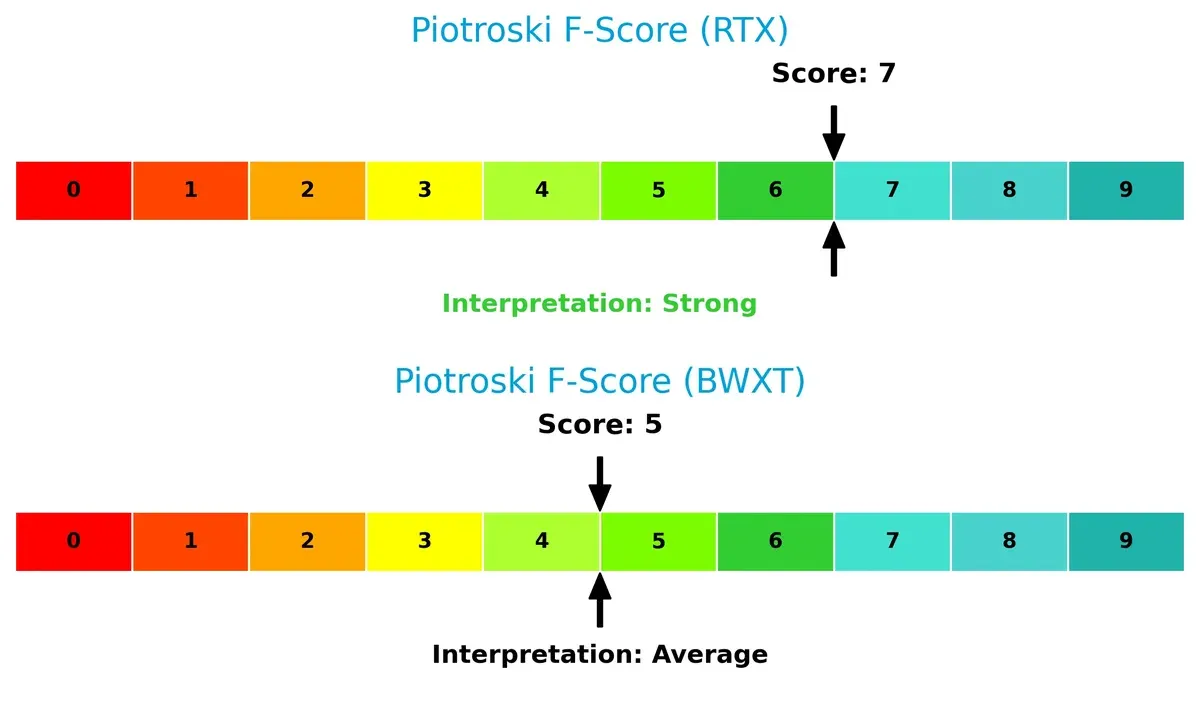
Financial Health: Quality of Operations
RTX’s Piotroski F-Score of 7 indicates strong financial health and operational quality, outperforming BWXT’s average score of 5, which suggests some internal red flags and weaker financial robustness:
How are the two companies positioned?
This section dissects the operational DNA of RTX and BWXT by comparing their revenue distribution by segment alongside their internal strengths and weaknesses. The final objective is to confront their economic moats to identify which business model offers the most resilient and sustainable competitive advantage in today’s market landscape.
Revenue Segmentation: The Strategic Mix
This comparison dissects how RTX Corporation and BWX Technologies diversify their income streams and highlights where their primary sector bets lie:
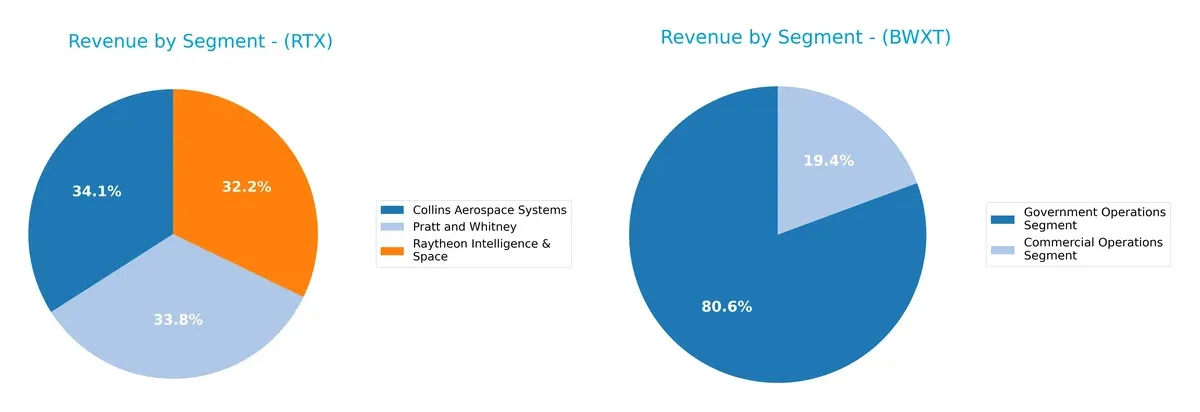
RTX dominates with three massive segments near $28B each, showing a balanced aerospace and defense portfolio. BWXT pivots on its Government Operations segment at $2.18B, dwarfing its Commercial Operations at $524M. RTX’s diversification reduces concentration risk, leveraging aerospace systems and defense intelligence. BWXT’s heavy reliance on government contracts signals infrastructure dominance but exposes it to sector-specific policy shifts. This contrast defines their strategic risk profiles sharply.
Strengths and Weaknesses Comparison
This table compares the Strengths and Weaknesses of RTX and BWXT based on diversification, profitability, financials, innovation, global presence, and market share:
RTX Strengths
- Highly diversified across aerospace and defense segments
- Strong global presence in US, Europe, Asia Pacific
- Favorable debt-to-assets and interest coverage ratios
- Solid fixed asset turnover indicating efficient asset use
BWXT Strengths
- Higher profitability metrics including ROE and net margin
- Strong liquidity with favorable current and quick ratios
- Favorable WACC supports capital efficiency
- Concentrated but growing presence in US and Canada markets
RTX Weaknesses
- Unfavorable valuation multiples (PE, PB) indicating high market expectations
- Quick ratio below 1 signals liquidity risk
- Moderate profitability with neutral ROE and net margin
- Less concentrated geographic revenue, possibly diluting focus
BWXT Weaknesses
- High P/B ratio suggests expensive valuation
- Higher debt-to-assets ratio than RTX
- Lower dividend yield may deter income investors
- Less diversified revenue streams focused on nuclear operations
RTX demonstrates broad diversification and stable financial structure but faces valuation and liquidity challenges. BWXT shows superior profitability and liquidity but contends with valuation premiums and narrower business scope, affecting strategic flexibility.
The Moat Duel: Analyzing Competitive Defensibility
A structural moat is the only reliable shield against competition eroding long-term profits. Let’s break down the competitive advantages of these two aerospace and defense firms:
RTX Corporation: Diversified Defense and Aerospace Integration
RTX’s moat stems from its vast portfolio combining aerospace systems, military engines, and defense tech. This diversification maintains stable margins and rising ROIC, signaling efficient capital use. In 2026, expansion into space and advanced defense systems could deepen its moat despite fierce competition.
BWX Technologies, Inc.: Specialized Nuclear Components Expertise
BWXT’s moat lies in its niche focus on nuclear propulsion and components, creating high switching costs for defense clients. Its ROIC exceeds WACC, confirming value creation, yet profitability trends down. Growth opportunities exist in commercial nuclear markets, but declining ROIC warns of emerging challenges.
Moat Strength: Diversification vs. Niche Specialization
RTX’s broader, growing profitability and expanding aerospace-defense integration offer a wider moat. BWXT’s niche expertise yields strong value but risks from shrinking returns. I see RTX better positioned to defend and grow its market share through diversified innovation.
Which stock offers better returns?
The past year shows strong bullish momentum for both RTX Corporation and BWX Technologies, Inc., with notable price accelerations and distinct trading volume dynamics shaping their trajectories.
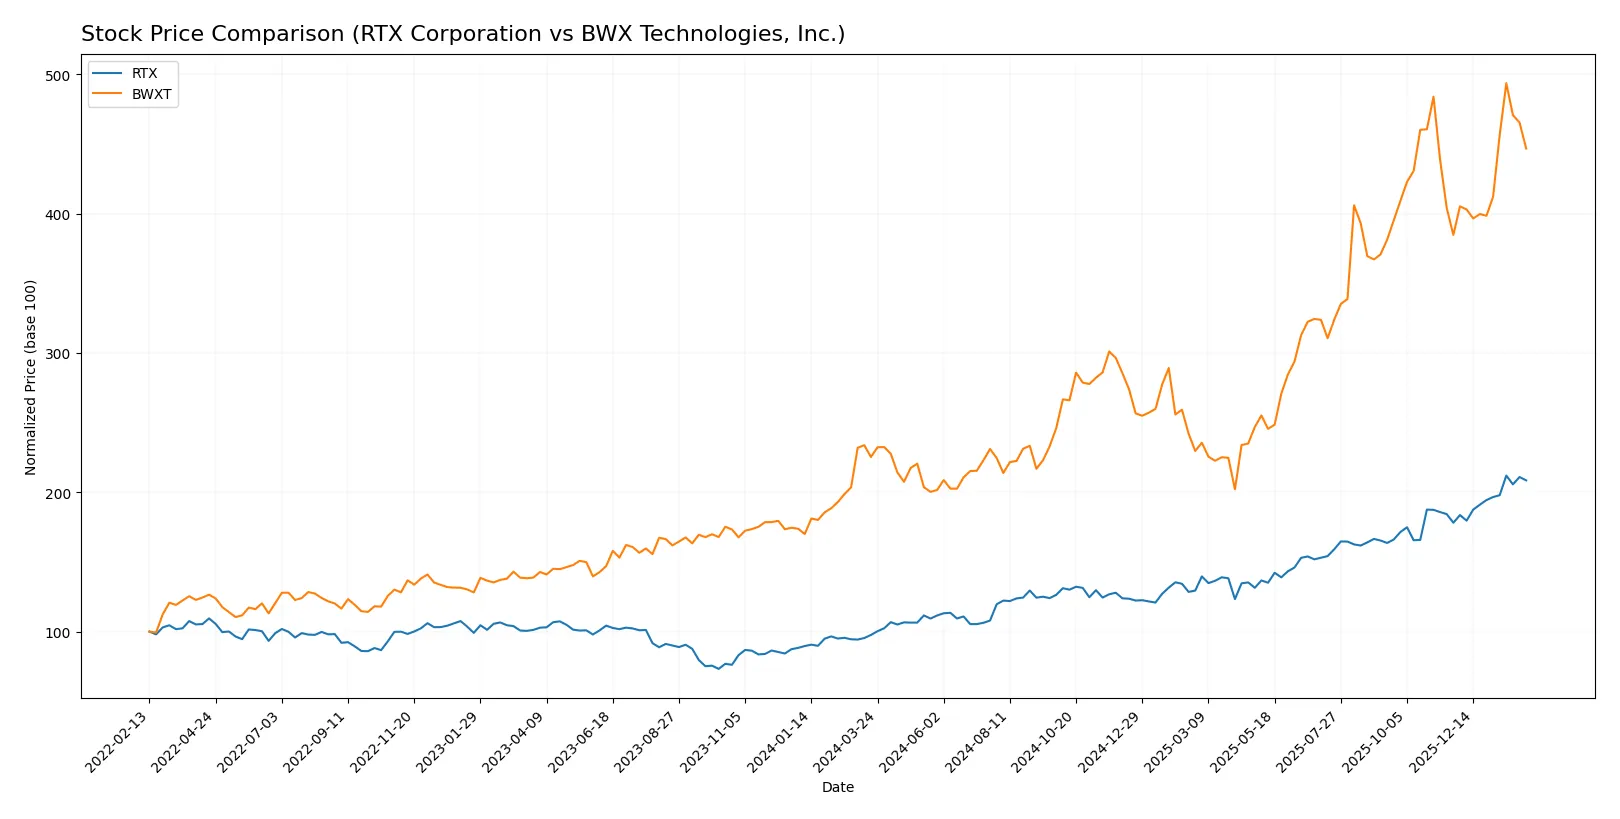
Trend Comparison
RTX Corporation’s stock rose 113.77% over 12 months, confirming a bullish trend with accelerating gains. The price ranged between 92.93 and 201.92, supported by a 27.67 standard deviation.
BWX Technologies, Inc. gained 98.28% in the same period, also bullish with acceleration. Its price fluctuated from 88.41 to 217.89, exhibiting higher volatility at a 36.87 standard deviation.
RTX outperformed BWXT by 15.49 percentage points over the past year, delivering the highest market return despite BWXT’s greater volatility.
Target Prices
Analysts provide a confident target consensus for RTX Corporation and BWX Technologies, reflecting positive sector momentum.
| Company | Target Low | Target High | Consensus |
|---|---|---|---|
| RTX Corporation | 168 | 235 | 214.7 |
| BWX Technologies, Inc. | 180 | 225 | 204 |
The target consensus for RTX exceeds its current price of $198.66, implying upside potential. BWXT’s consensus of $204 also suggests modest appreciation from its $197.19 market price.

Don’t Let Luck Decide Your Entry Point
Optimize your entry points with our advanced ProRealTime indicators. You’ll get efficient buy signals with precise price targets for maximum performance. Start outperforming now!
How do institutions grade them?
RTX Corporation Grades
The following table summarizes recent grades for RTX Corporation from key financial institutions.
| Grading Company | Action | New Grade | Date |
|---|---|---|---|
| Citigroup | Maintain | Buy | 2026-02-05 |
| UBS | Maintain | Neutral | 2026-01-28 |
| JP Morgan | Maintain | Overweight | 2026-01-28 |
| RBC Capital | Maintain | Outperform | 2026-01-28 |
| Citigroup | Maintain | Buy | 2026-01-13 |
| UBS | Downgrade | Neutral | 2026-01-05 |
| JP Morgan | Maintain | Overweight | 2025-12-19 |
| B of A Securities | Maintain | Buy | 2025-10-27 |
| UBS | Maintain | Buy | 2025-10-22 |
| Goldman Sachs | Maintain | Neutral | 2025-10-22 |
BWX Technologies, Inc. Grades
The following table summarizes recent grades for BWX Technologies, Inc. from key financial institutions.
| Grading Company | Action | New Grade | Date |
|---|---|---|---|
| Seaport Global | Downgrade | Neutral | 2026-01-20 |
| B of A Securities | Maintain | Buy | 2025-11-13 |
| BTIG | Maintain | Buy | 2025-11-07 |
| Truist Securities | Maintain | Hold | 2025-11-04 |
| Truist Securities | Maintain | Hold | 2025-10-15 |
| Deutsche Bank | Maintain | Hold | 2025-10-08 |
| B of A Securities | Maintain | Buy | 2025-08-13 |
| Deutsche Bank | Maintain | Hold | 2025-08-06 |
| Maxim Group | Downgrade | Hold | 2025-08-06 |
| Truist Securities | Maintain | Hold | 2025-08-05 |
Which company has the best grades?
RTX Corporation consistently receives buy and outperform ratings from major firms, while BWX Technologies shows a mix of hold and buy grades with some recent downgrades. RTX’s stronger grades suggest greater institutional confidence, potentially influencing investor sentiment positively.
Risks specific to each company
The following categories highlight the critical pressure points and systemic threats facing RTX Corporation and BWX Technologies in the 2026 market environment:
1. Market & Competition
RTX Corporation
- Faces intense competition across aerospace and defense sectors, balancing commercial and military demand cycles.
BWX Technologies, Inc.
- Operates in a niche nuclear components market with fewer direct competitors but high specialization risk.
2. Capital Structure & Debt
RTX Corporation
- Moderate debt with a debt-to-assets ratio of 24%, manageable interest coverage of 5.77x.
BWX Technologies, Inc.
- Higher leverage with debt-to-assets near 37%, but strong interest coverage of 9.83x.
3. Stock Volatility
RTX Corporation
- Low beta at 0.42 suggests defensive characteristics and lower volatility.
BWX Technologies, Inc.
- Higher beta at 0.83 indicates greater stock price sensitivity and risk.
4. Regulatory & Legal
RTX Corporation
- Faces broad aerospace and defense regulatory scrutiny domestically and internationally.
BWX Technologies, Inc.
- Nuclear focus subjects BWXT to stringent and evolving regulatory and safety standards.
5. Supply Chain & Operations
RTX Corporation
- Complex global supply chains vulnerable to geopolitical and logistic disruptions.
BWX Technologies, Inc.
- Specialized supply chains with critical nuclear materials pose operational continuity risks.
6. ESG & Climate Transition
RTX Corporation
- Transitioning toward sustainable aerospace solutions, but large carbon footprint remains a challenge.
BWX Technologies, Inc.
- Nuclear energy alignment offers potential ESG benefits but faces public perception hurdles.
7. Geopolitical Exposure
RTX Corporation
- Exposure to U.S. and allied defense contracts; sensitive to geopolitical tensions affecting defense budgets.
BWX Technologies, Inc.
- Dependent on U.S. government nuclear programs; geopolitical shifts could impact contract stability.
Which company shows a better risk-adjusted profile?
BWX Technologies’ most impactful risk is its elevated leverage, reflected in a very unfavorable debt-to-equity score despite strong interest coverage. RTX faces fierce competition and operational complexity, with a moderate leverage profile but lower stock volatility. BWXT’s Altman Z-Score in the safe zone contrasts with RTX’s grey zone, indicating better financial distress resilience. However, RTX’s defensive beta and diversified segments offer a more balanced risk profile. Recent data showing BWXT’s higher beta and leverage justify caution despite its strong profitability metrics. Overall, RTX displays a better risk-adjusted profile in this 2026 environment.
Final Verdict: Which stock to choose?
RTX Corporation’s superpower lies in its growing profitability and solid operational execution. Its expanding returns signal improving efficiency, though its modest liquidity ratio remains a point of vigilance. RTX suits investors aiming for aggressive growth with a tolerance for moderate balance sheet risks.
BWX Technologies commands a strategic moat through its robust capital efficiency and strong return metrics, reflecting disciplined capital allocation. It offers better liquidity and financial safety than RTX, fitting well in a GARP portfolio focused on stable growth without excessive risk.
If you prioritize accelerating profitability and market momentum, RTX stands out due to its improving ROIC and income growth. However, if you seek stronger financial stability and efficient capital use, BWXT offers better safety despite a slightly declining profitability trend. Both present compelling but distinct analytical scenarios for different investor profiles.
Disclaimer: Investment carries a risk of loss of initial capital. The past performance is not a reliable indicator of future results. Be sure to understand risks before making an investment decision.
Go Further
I encourage you to read the complete analyses of RTX Corporation and BWX Technologies, Inc. to enhance your investment decisions: