Home > Comparison > Industrials > NOC vs BWXT
The strategic rivalry between Northrop Grumman Corporation and BWX Technologies shapes the aerospace and defense landscape. Northrop Grumman, a diversified industrial giant, excels in advanced aircraft and mission systems. BWX Technologies focuses on niche nuclear components and services with precision specialization. This analysis contrasts their operational models to identify which company’s trajectory offers superior risk-adjusted returns for a diversified portfolio in this vital sector.
Table of contents
Companies Overview
Northrop Grumman and BWX Technologies anchor critical niches within the aerospace and defense sector.
Northrop Grumman Corporation: Aerospace and Defense Powerhouse
Northrop Grumman dominates as a global aerospace and defense leader with a diverse portfolio spanning aeronautics, defense systems, mission systems, and space systems. Its core revenue stems from cutting-edge aircraft, missile defense, and cyber capabilities. In 2026, the company focuses on advancing integrated battle management and hypersonic propulsion technologies to maintain its competitive edge.
BWX Technologies, Inc.: Nuclear Components Specialist
BWX Technologies specializes in nuclear components and services for defense and commercial nuclear power markets. It generates revenue through naval reactors, nuclear fuel, and specialized services like environmental site restoration. The 2026 strategy emphasizes expanding nuclear propulsion solutions and enhancing reactor manufacturing capabilities to serve government and commercial clients.
Strategic Collision: Similarities & Divergences
Both firms address aerospace and defense but diverge sharply: Northrop Grumman pursues a broad, integrated systems approach, while BWX focuses narrowly on nuclear propulsion and components. Their battleground lies in defense technology innovation, with Northrop leading in aerospace systems and BWX in nuclear expertise. This contrast defines distinct investment profiles, from diversified resilience to specialized niche dominance.
Income Statement Comparison
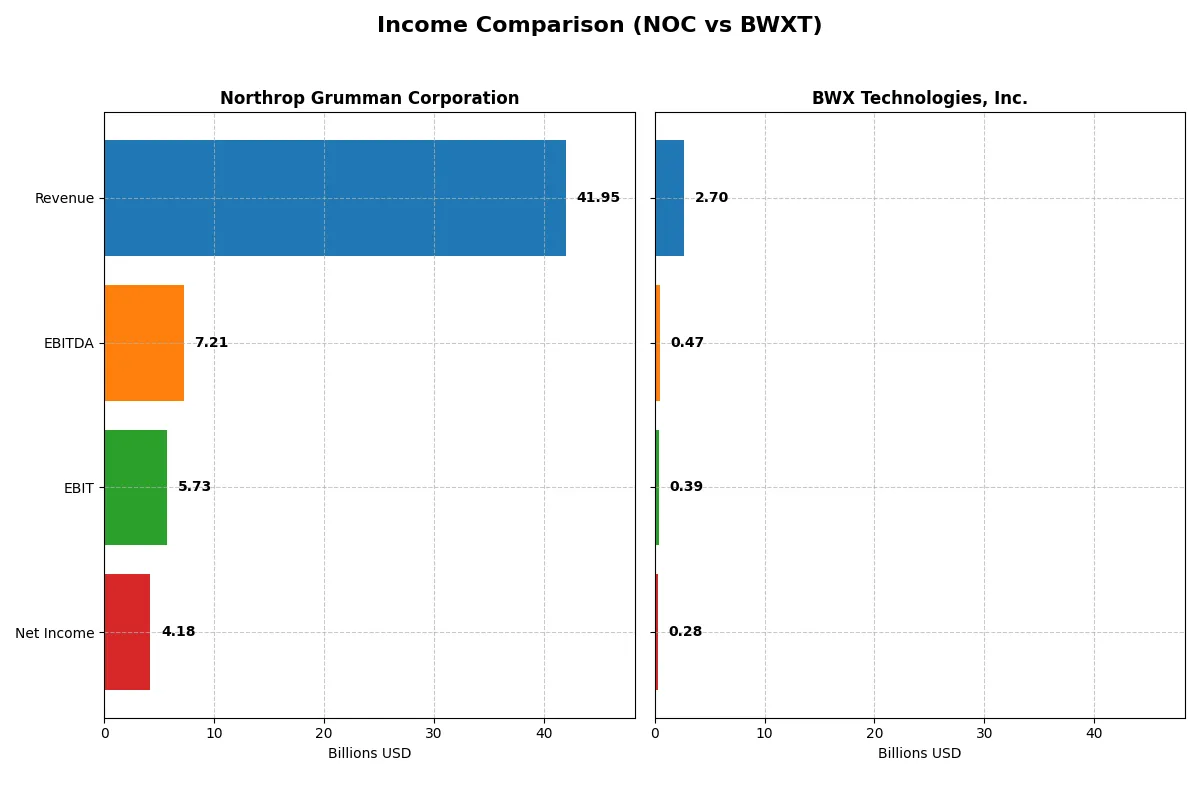
This data dissects the core profitability and scalability of both corporate engines to reveal who dominates the bottom line:
| Metric | Northrop Grumman Corporation (NOC) | BWX Technologies, Inc. (BWXT) |
|---|---|---|
| Revenue | 41.95B | 2.70B |
| Cost of Revenue | 33.64B | 2.05B |
| Operating Expenses | 4.03B | 275M |
| Gross Profit | 8.31B | 655M |
| EBITDA | 7.21B | 474M |
| EBIT | 5.73B | 388M |
| Interest Expense | 665M | 39M |
| Net Income | 4.18B | 282M |
| EPS | 29.14 | 3.08 |
| Fiscal Year | 2025 | 2024 |
Income Statement Analysis: The Bottom-Line Duel
This income statement comparison exposes which company operates with superior efficiency and profitability in their respective markets.
Northrop Grumman Corporation Analysis
Northrop Grumman’s revenue climbed steadily from $35.7B in 2021 to $41.95B in 2025, reflecting a 17.6% growth over five years. Net income fluctuated, peaking at $7B in 2021 but falling to $4.18B by 2025. The company maintains solid gross margins near 19.8%, while net margin holds favorably at 9.97% in 2025, indicating a resilient but pressured profitability profile. Despite a slight revenue growth slowdown, operating efficiency improved with EBIT margin expanding to 13.66%.
BWX Technologies, Inc. Analysis
BWXT demonstrates consistent revenue growth, rising from $2.12B in 2020 to $2.7B in 2024, an overall gain of 27.3%. Net income modestly increased to $282M in 2024 from $279M in 2020, showing steady bottom-line stability. The company outperforms on margin health, boasting a 24.2% gross margin and a 10.4% net margin in its latest fiscal year. BWXT’s EBIT margin of 14.36% and a favorable 8.3% revenue growth in 2024 underscore improving operational momentum despite rising operating expenses.
Margin Power vs. Revenue Scale
Northrop Grumman commands larger revenue scale but faces net income erosion and margin compression over five years. BWXT, smaller in size, exhibits superior margin expansion and consistent net income growth. Fundamentally, BWXT leads in margin efficiency and momentum, making it attractive for investors prioritizing profitability trends over sheer revenue size.
Financial Ratios Comparison
These vital ratios act as a diagnostic tool to expose the underlying fiscal health, valuation premiums, and capital efficiency of the companies compared below:
| Ratios | Northrop Grumman Corporation (NOC) | BWX Technologies, Inc. (BWXT) |
|---|---|---|
| ROE | 25.1% | 26.1% |
| ROIC | 9.9% | 12.8% |
| P/E | 19.6 | 36.2 |
| P/B | 4.91 | 9.44 |
| Current Ratio | 1.10 | 1.96 |
| Quick Ratio | 1.10 | 1.88 |
| D/E (Debt-to-Equity) | 0.11 | 0.98 |
| Debt-to-Assets | 3.6% | 36.8% |
| Interest Coverage | -6.8 | 9.64 |
| Asset Turnover | 0.82 | 0.94 |
| Fixed Asset Turnover | 3.27 | 2.12 |
| Payout ratio | 31% | 31% |
| Dividend yield | 1.58% | 0.87% |
| Fiscal Year | 2025 | 2024 |
Efficiency & Valuation Duel: The Vital Signs
Financial ratios act as the company’s DNA, revealing hidden risks and operational excellence that define investment potential.
Northrop Grumman Corporation
Northrop Grumman shows strong profitability with a 25.08% ROE and a solid 9.97% net margin, signaling efficient operations. Its P/E ratio of 19.57 positions the stock as fairly valued, while a 1.58% dividend yield supports shareholder returns. The firm maintains a balanced capital structure with favorable debt metrics, enhancing its risk profile.
BWX Technologies, Inc.
BWXT posts a robust 26.09% ROE and a slightly higher 10.43% net margin, reflecting operational strength. However, its valuation appears stretched, with a high P/E of 36.18 and a steep P/B of 9.44. Dividend yield at 0.87% is modest, suggesting growth reinvestment, but leverage metrics are neutral, adding caution around financial risk.
Premium Valuation vs. Operational Safety
Both companies exhibit strong profitability and favorable overall ratios, but BWXT’s valuation is significantly stretched compared to Northrop Grumman’s more moderate multiples. Northrop Grumman offers a better risk-reward balance with steady dividends and conservative leverage. Investors seeking stability may prefer Northrop’s conservative profile, while growth-oriented investors might tolerate BWXT’s premium pricing.
Which one offers the Superior Shareholder Reward?
Northrop Grumman (NOC) offers a superior shareholder reward compared to BWX Technologies (BWXT). NOC boasts a higher dividend yield (~1.58% vs. BWXT’s ~0.87%) with a sustainable payout ratio near 31%, supported by robust free cash flow coverage (~70%). BWXT’s lower dividend yield and payout ratio (~31%) come with weaker free cash flow conversion (~62%). Both companies deploy share buybacks, but NOC’s stronger cash generation and moderate leverage indicate a more balanced capital return approach. I see NOC’s distribution model as more sustainable and value-creating in 2026, offering investors a more attractive total return profile.
Comparative Score Analysis: The Strategic Profile
The radar chart reveals the core financial DNA and trade-offs of Northrop Grumman Corporation and BWX Technologies, Inc.:
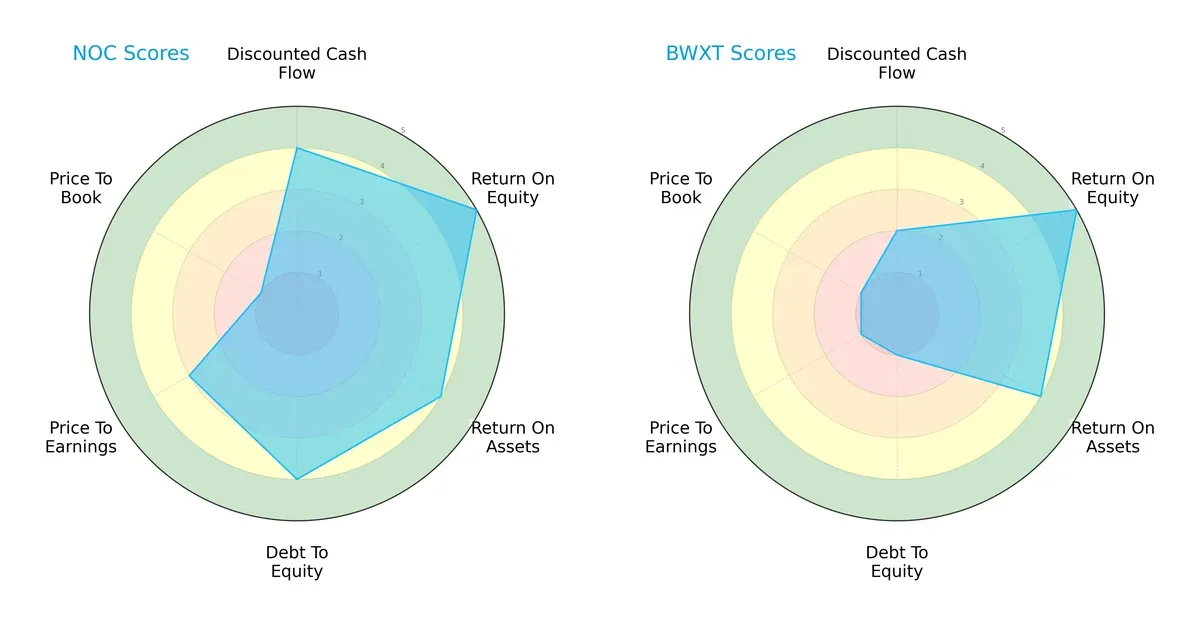
Northrop Grumman shows a balanced profile with strong DCF (4), ROE (5), ROA (4), and debt management (4). BWX matches Northrop’s ROE (5) and ROA (4) but falls short on DCF (2) and debt-to-equity (1), signaling higher leverage risk. Northrop’s moderate valuation scores (PE 3, PB 1) contrast with BWX’s uniformly low valuation marks, highlighting Northrop’s more stable financial footing.
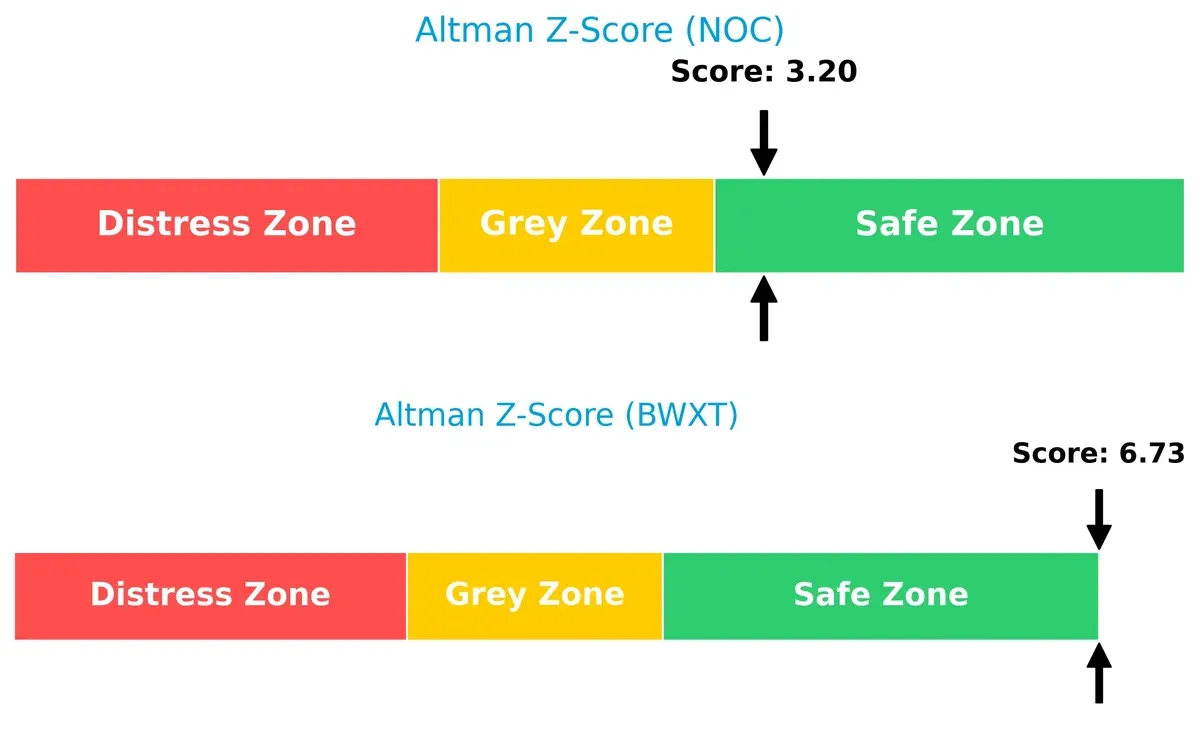
Bankruptcy Risk: Solvency Showdown
The Altman Z-Score gap favors BWX (6.7) over Northrop Grumman (3.2), both in the safe zone but BWX clearly more shielded from bankruptcy risk in this cycle:
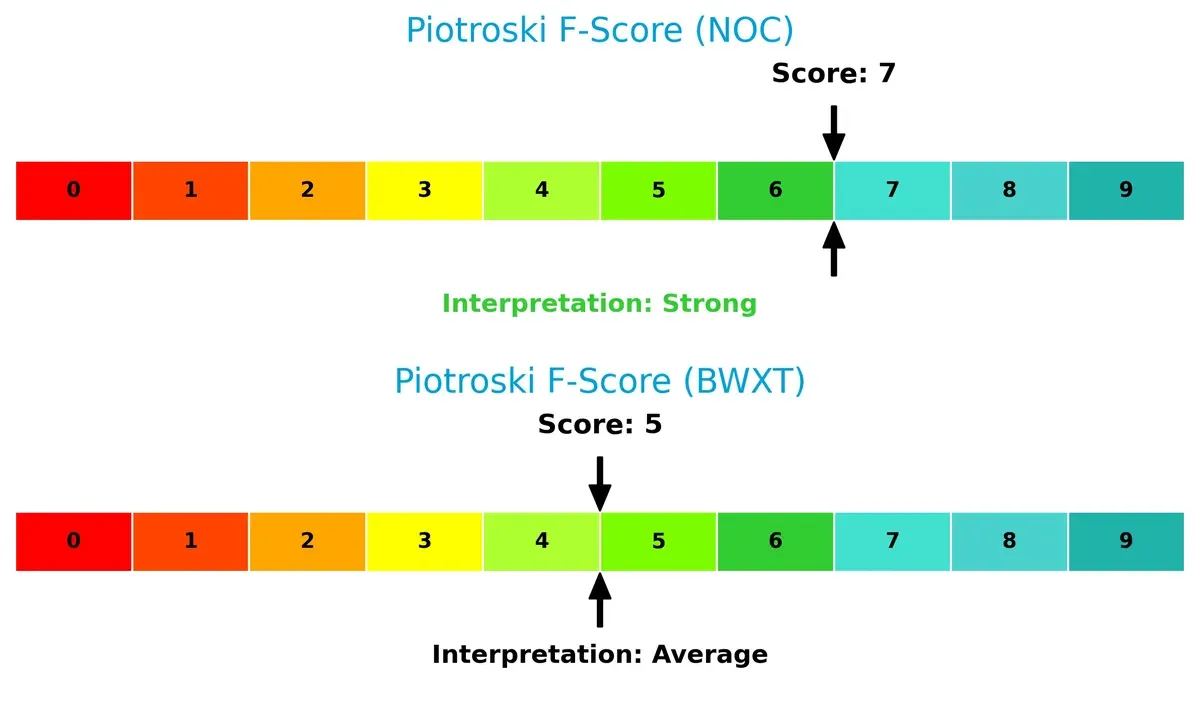
Financial Health: Quality of Operations
Northrop Grumman’s Piotroski F-Score of 7 signals strong financial health, outperforming BWX’s average 5. BWX’s lower score reveals potential internal weaknesses compared to Northrop’s robust operational quality:
How are the two companies positioned?
This section dissects the operational DNA of Northrop Grumman and BWX Technologies by comparing revenue distribution and internal dynamics. The goal is to confront their economic moats to identify the more resilient, sustainable competitive advantage today.
Revenue Segmentation: The Strategic Mix
The following visual comparison dissects how Northrop Grumman Corporation and BWX Technologies, Inc. diversify their income streams and where their primary sector bets lie:
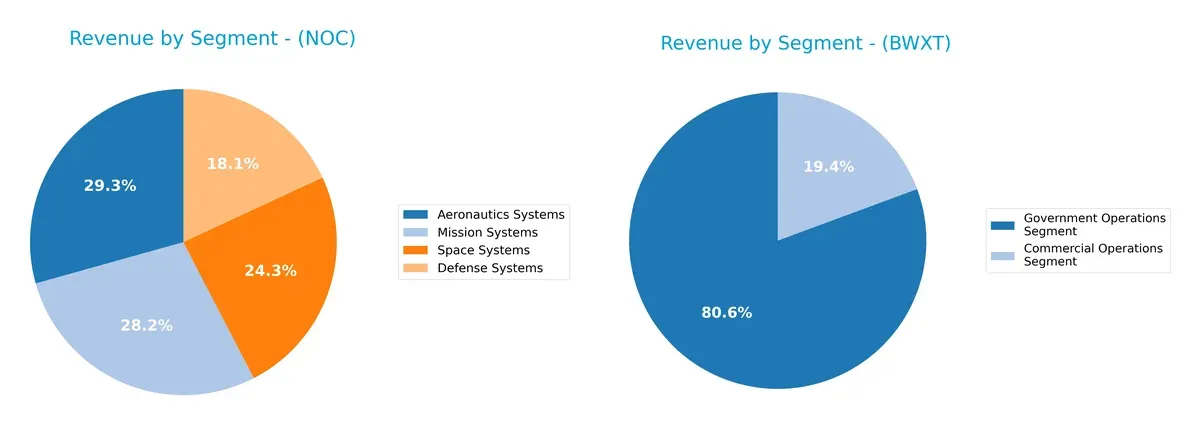
Northrop Grumman’s 2025 revenue spans Aeronautics Systems at $13B, Mission Systems $12.5B, Space Systems $10.8B, and Defense Systems $8B, reflecting a diversified aerospace and defense portfolio. BWX Technologies leans heavily on its Government Operations Segment at $2.18B, dwarfing its Commercial Operations at $524M, signaling concentration risk but strong government ecosystem lock-in. Northrop’s multi-segment spread anchors resilience; BWXT pivots on nuclear government contracts for stability.
Strengths and Weaknesses Comparison
This table compares the strengths and weaknesses of Northrop Grumman Corporation (NOC) and BWX Technologies, Inc. (BWXT):
NOC Strengths
- Diversified revenue across Aeronautics, Mission, Space, and Defense segments
- Strong profitability with 25.08% ROE and favorable WACC at 4.47%
- Low debt-to-equity at 0.11 and solid interest coverage at 8.62
- Global presence including significant US, Europe, and Asia Pacific sales
BWXT Strengths
- Favorable profitability metrics including 26.09% ROE and 12.79% ROIC
- Strong liquidity with current ratio 1.96 and quick ratio 1.88
- Solid interest coverage at 9.83 and favorable WACC at 7.55%
- Focused operations in government and commercial nuclear segments with growing US and Canada markets
NOC Weaknesses
- Price-to-book ratio is unfavorable at 4.91 indicating potential overvaluation
- Neutral net margin at 9.97% with room for improvement
- Moderate current ratio at 1.1 may limit short-term flexibility
- Heavy US market concentration with less diversification outside North America
BWXT Weaknesses
- High price-to-earnings ratio at 36.18 and price-to-book at 9.44 signal valuation risk
- Higher debt-to-equity at 0.98 and debt-to-assets at 36.78% may increase financial risk
- Lower dividend yield at 0.87%
- Less diversified product and geographic segments compared to NOC
NOC benefits from broad diversification and conservative leverage, supporting stability through market cycles. BWXT shows superior profitability and liquidity but faces valuation and leverage concerns. Both companies must balance growth ambitions with prudent capital management to sustain competitive advantages.
The Moat Duel: Analyzing Competitive Defensibility
A structural moat protects long-term profits from relentless competition erosion. Without it, sustainable value simply vanishes:
Northrop Grumman Corporation: Diversified Aerospace & Defense Moat
Northrop Grumman’s moat stems from extensive intangible assets and integrated defense systems. It sustains high ROIC above WACC, though ROIC shows a downward trend. Expansion into space and cyber warfare may deepen its moat in 2026.
BWX Technologies, Inc.: Specialized Nuclear Component Moat
BWXT relies on specialized nuclear technologies and government contracts, creating high switching costs unlike Northrop’s broad aerospace portfolio. It delivers solid ROIC above cost of capital with a milder ROIC decline. Growth in nuclear power and naval propulsion could bolster its moat.
Integrated Systems vs. Nuclear Specialization: Which Moat Holds Stronger?
Both companies create value with ROIC well above WACC but face declining profitability trends. Northrop’s broader product ecosystem offers a wider moat, while BWXT’s niche focus ensures deeper specialization. Northrop is better equipped to defend diverse market share across defense sectors.
Which stock offers better returns?
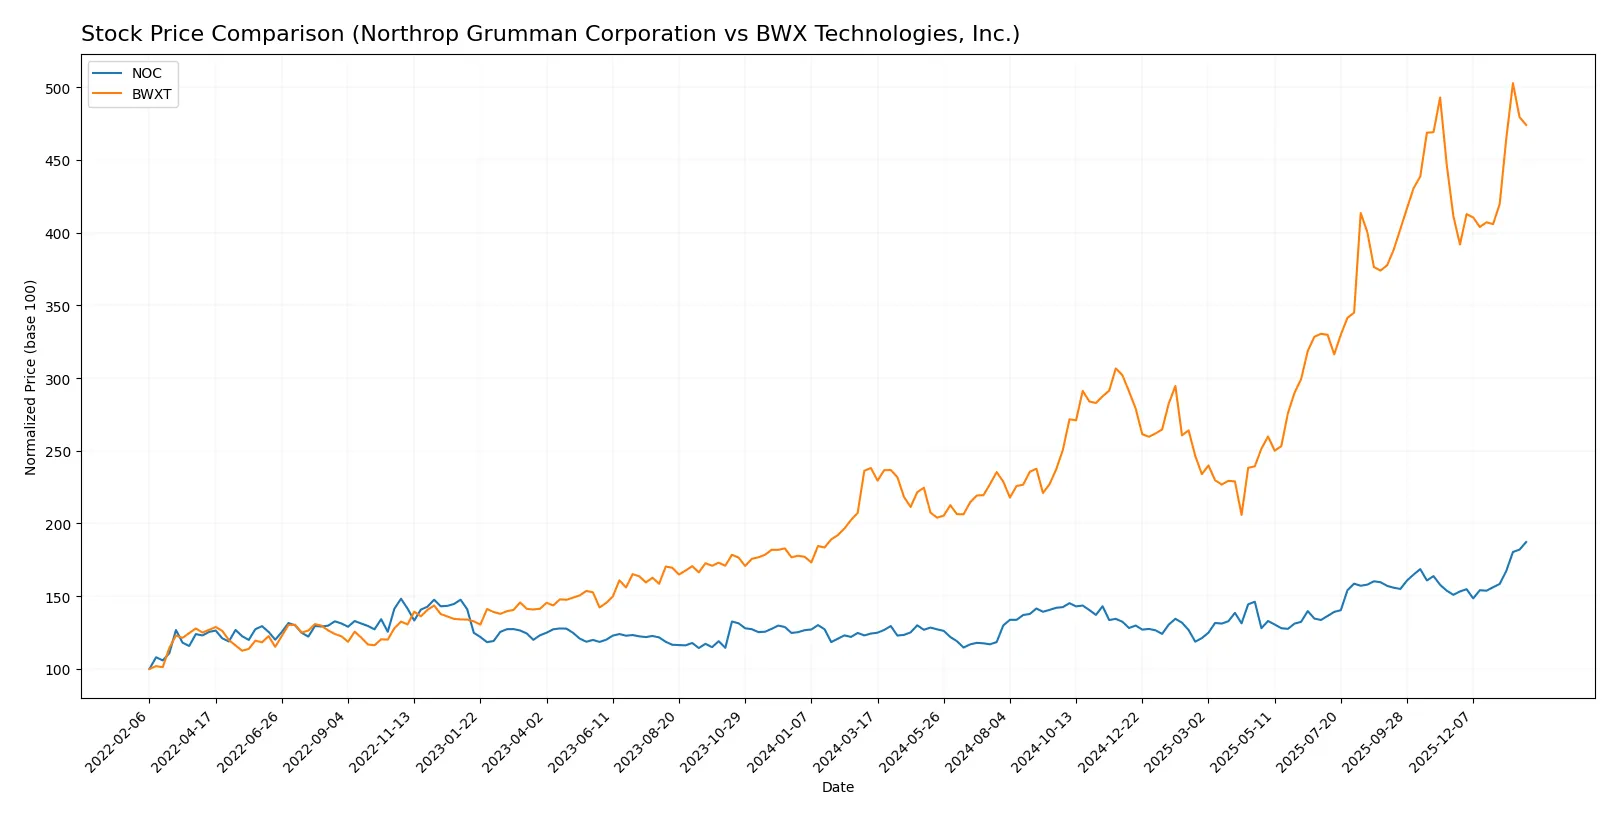
The past year shows strong bullish momentum for both stocks, with Northrop Grumman accelerating after a sharp rise, while BWX Technologies delivers even higher gains amid increasing volume.
Trend Comparison
Northrop Grumman’s stock gained 50.66% over the past year, showing a bullish trend with accelerating price increases and high volatility. The highest price reached 692.26, with a low of 424.09.
BWX Technologies surged 99.08% in the same period, also bullish with accelerating momentum. Volatility is lower than Northrop Grumman’s. The stock hit a high of 217.89 and a low of 88.41.
BWX Technologies outperformed Northrop Grumman, delivering nearly double the return over the past year despite weaker recent buyer dominance.
Target Prices
Analyst consensus reveals bullish expectations for Northrop Grumman and BWX Technologies.
| Company | Target Low | Target High | Consensus |
|---|---|---|---|
| Northrop Grumman Corporation | 623 | 815 | 736.09 |
| BWX Technologies, Inc. | 180 | 225 | 204 |
Northrop Grumman’s consensus target of $736 exceeds its current $692 stock price, signaling upside potential. BWX Technologies’ $204 target aligns closely with its $205 market price, suggesting a balanced outlook.

Don’t Let Luck Decide Your Entry Point
Optimize your entry points with our advanced ProRealTime indicators. You’ll get efficient buy signals with precise price targets for maximum performance. Start outperforming now!
How do institutions grade them?
The following tables summarize recent institutional grades for Northrop Grumman Corporation and BWX Technologies, Inc.:
Northrop Grumman Corporation Grades
Here are the latest grades from reputable grading companies for Northrop Grumman Corporation.
| Grading Company | Action | New Grade | Date |
|---|---|---|---|
| B of A Securities | maintain | Buy | 2026-01-28 |
| BTIG | maintain | Buy | 2026-01-28 |
| UBS | maintain | Buy | 2026-01-28 |
| RBC Capital | maintain | Outperform | 2026-01-28 |
| Citigroup | maintain | Buy | 2026-01-28 |
| UBS | maintain | Buy | 2026-01-15 |
| Citigroup | maintain | Buy | 2026-01-13 |
| Truist Securities | downgrade | Hold | 2026-01-09 |
| Morgan Stanley | maintain | Overweight | 2025-12-16 |
| Alembic Global | upgrade | Overweight | 2025-12-15 |
BWX Technologies, Inc. Grades
Below are the recent grades from recognized grading firms for BWX Technologies, Inc.
| Grading Company | Action | New Grade | Date |
|---|---|---|---|
| Seaport Global | downgrade | Neutral | 2026-01-20 |
| B of A Securities | maintain | Buy | 2025-11-13 |
| BTIG | maintain | Buy | 2025-11-07 |
| Truist Securities | maintain | Hold | 2025-11-04 |
| Truist Securities | maintain | Hold | 2025-10-15 |
| Deutsche Bank | maintain | Hold | 2025-10-08 |
| B of A Securities | maintain | Buy | 2025-08-13 |
| Deutsche Bank | maintain | Hold | 2025-08-06 |
| Maxim Group | downgrade | Hold | 2025-08-06 |
| Truist Securities | maintain | Hold | 2025-08-05 |
Which company has the best grades?
Northrop Grumman maintains stronger consensus grades, mostly Buy and Outperform, with few downgrades. BWX Technologies shows more Hold and Neutral ratings with recent downgrades. This contrast could influence investor confidence and portfolio allocation decisions.
Risks specific to each company
The following categories identify the critical pressure points and systemic threats facing both firms in the 2026 market environment:
1. Market & Competition
Northrop Grumman Corporation
- Dominates aerospace & defense with broad product portfolio, but faces intense competition from diversified defense contractors.
BWX Technologies, Inc.
- Focuses on nuclear components niche with specialized products, but smaller scale limits competitive reach.
2. Capital Structure & Debt
Northrop Grumman Corporation
- Maintains low debt levels (D/E 0.11), strong interest coverage (8.62), and favorable capital allocation.
BWX Technologies, Inc.
- Carries high leverage (D/E 0.98) with moderate debt-to-assets (36.78%), raising financial risk despite good interest coverage (9.83).
3. Stock Volatility
Northrop Grumman Corporation
- Exhibits minimal volatility with beta of 0.049, indicating defensive stock behavior.
BWX Technologies, Inc.
- Shows higher beta of 0.852, reflecting sensitivity to market swings and elevated volatility risk.
4. Regulatory & Legal
Northrop Grumman Corporation
- Operates under strict defense contracts and export controls; regulatory risks tied to government budget changes.
BWX Technologies, Inc.
- Faces regulatory oversight in nuclear materials and safety, adding complexity and potential compliance costs.
5. Supply Chain & Operations
Northrop Grumman Corporation
- Global supply chain complexity with multiple aerospace systems; vulnerable to geopolitical disruptions.
BWX Technologies, Inc.
- Specialized nuclear supply chain with fewer suppliers but critical reliance on government programs.
6. ESG & Climate Transition
Northrop Grumman Corporation
- Increasing scrutiny on emissions and sustainability in aerospace; adapts with technology upgrades.
BWX Technologies, Inc.
- Faces challenges in nuclear waste management and environmental regulations, impacting long-term ESG profile.
7. Geopolitical Exposure
Northrop Grumman Corporation
- High exposure due to global defense contracts and geopolitical tensions affecting demand and operations.
BWX Technologies, Inc.
- Moderate exposure focused on U.S. and allied nuclear programs; less diversified internationally.
Which company shows a better risk-adjusted profile?
Northrop Grumman’s most impactful risk is geopolitical exposure combined with complex global supply chains. BWX’s greatest risk lies in its high leverage and regulatory burden in nuclear operations. Despite BWX’s strong niche focus, Northrop Grumman shows a superior risk-adjusted profile due to lower financial leverage, minimal stock volatility, and diversified operations. Northrop’s low beta of 0.049 versus BWX’s 0.852 highlights this stability advantage clearly in 2026.
Final Verdict: Which stock to choose?
Northrop Grumman’s superpower lies in its strong capital efficiency and robust return on equity, signaling disciplined management and value creation. Its main point of vigilance is the recent decline in profitability trends, which could pressure future margins. It fits well within an Aggressive Growth portfolio seeking exposure to defense industry resilience.
BWX Technologies commands a strategic moat through its specialized niche in nuclear components and a solid recurring revenue base. Compared to Northrop, BWXT offers better liquidity and a safer balance sheet but trades at a higher valuation premium. It suits a GARP (Growth at a Reasonable Price) investor prioritizing consistent income and moderate growth.
If you prioritize disciplined capital allocation and a proven track record of generating shareholder value, Northrop Grumman is the compelling choice due to its superior ROE and scale advantages. However, if you seek better balance sheet safety combined with niche market positioning, BWX Technologies offers better stability and steady growth, albeit at a more demanding price. Both show slightly favorable moats but require monitoring of declining ROIC trends.
Disclaimer: Investment carries a risk of loss of initial capital. The past performance is not a reliable indicator of future results. Be sure to understand risks before making an investment decision.
Go Further
I encourage you to read the complete analyses of Northrop Grumman Corporation and BWX Technologies, Inc. to enhance your investment decisions: