Home > Comparison > Industrials > LHX vs BWXT
The strategic rivalry between L3Harris Technologies, Inc. and BWX Technologies, Inc. shapes the aerospace and defense industry’s evolution. L3Harris operates as a diversified defense technology leader with integrated mission systems and advanced communication solutions. BWX Technologies focuses on specialized nuclear components and reactor manufacturing, serving critical government and commercial sectors. This analysis examines their contrasting business models to identify which company presents the superior risk-adjusted return for a diversified industrial portfolio.
Table of contents
Companies Overview
L3Harris Technologies and BWX Technologies dominate distinct niches within the aerospace and defense sector.
L3Harris Technologies, Inc.: Aerospace & Defense Technology Leader
L3Harris Technologies specializes in mission-critical aerospace and defense systems. Its core revenue derives from integrated mission systems, space payloads, and tactical communications. In 2026, the company emphasizes innovation in intelligence, surveillance, reconnaissance (ISR), and airborne communication solutions, reinforcing its competitive edge in multi-domain defense technologies.
BWX Technologies, Inc.: Nuclear Components Specialist
BWX Technologies focuses on nuclear components and services for defense and commercial markets. It generates revenue through naval nuclear propulsion reactors, commercial nuclear power equipment, and nuclear services. The firm’s 2026 strategy centers on expanding nuclear operations and enhancing research reactor fuel supplies, underpinning its role as a critical supplier in nuclear propulsion and power generation.
Strategic Collision: Similarities & Divergences
Both companies serve the aerospace and defense industry but diverge sharply in focus. L3Harris pursues a technology-driven, integrated systems approach, while BWX relies on specialized nuclear manufacturing and services. Their primary battleground lies in defense contracts, yet their distinct core businesses offer varied risk and growth profiles. Investors face contrasting plays on advanced electronics versus nuclear infrastructure.
Income Statement Comparison
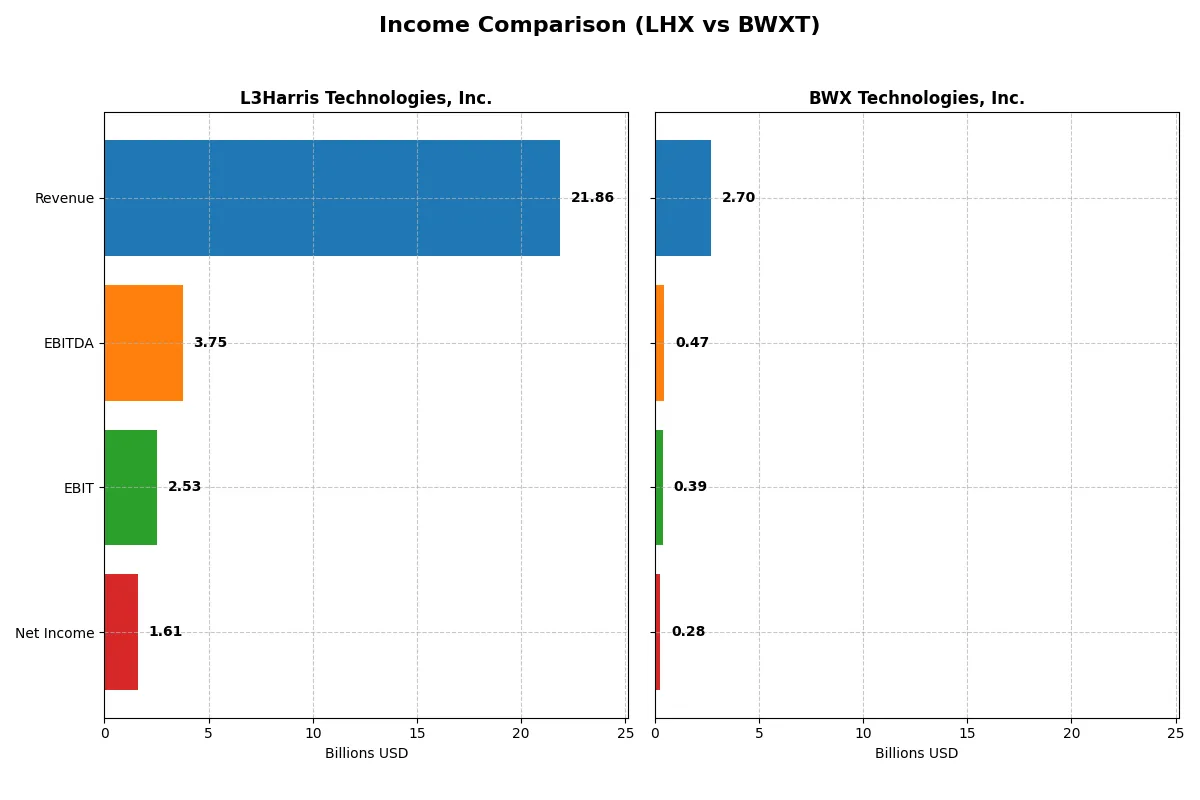
This data dissects the core profitability and scalability of both corporate engines to reveal who dominates the bottom line:
| Metric | L3Harris Technologies, Inc. (LHX) | BWX Technologies, Inc. (BWXT) |
|---|---|---|
| Revenue | 21.9B | 2.7B |
| Cost of Revenue | 16.2B | 2.0B |
| Operating Expenses | 3.4B | 275M |
| Gross Profit | 5.6B | 655M |
| EBITDA | 3.8B | 474M |
| EBIT | 2.5B | 388M |
| Interest Expense | 597M | 39M |
| Net Income | 1.6B | 282M |
| EPS | 8.57 | 3.08 |
| Fiscal Year | 2025 | 2024 |
Income Statement Analysis: The Bottom-Line Duel
This income statement comparison will reveal which company runs a more efficient and profitable corporate engine through recent financial performance.
L3Harris Technologies, Inc. Analysis
L3Harris Technologies posted steady revenue growth, reaching $21.9B in 2025, up 2.5% from 2024. Gross margins improved to 25.7%, supporting a solid net margin of 7.35%. The company’s operating efficiency gained momentum with an 11.6% EBIT margin, while net income rose to $1.6B, reflecting favorable earnings-per-share growth despite some overall net income pressure since 2021.
BWX Technologies, Inc. Analysis
BWX Technologies delivered stronger revenue growth, climbing 8.3% to $2.7B in 2024. Gross margin held firm at 24.2% with an impressive 14.4% EBIT margin, demonstrating operational discipline. Net income improved to $282M with a 10.4% net margin, supported by robust EPS growth of 14.6% over the year, marking consistent profitability expansion without compromising margin health.
Margin Strength vs. Revenue Scale
BWX Technologies outperforms L3Harris on margin efficiency, boasting higher EBIT and net margins despite smaller scale. L3Harris’s revenue scale dwarfs BWX’s but with thinner margins and slower net income growth. Investors favoring lean profitability and margin expansion may find BWX’s profile more attractive, while those prioritizing large-scale revenue growth might lean toward L3Harris.
Financial Ratios Comparison
These vital ratios act as a diagnostic tool to expose the underlying fiscal health, valuation premiums, and capital efficiency of the companies compared:
| Ratios | L3Harris Technologies, Inc. (LHX) | BWX Technologies, Inc. (BWXT) |
|---|---|---|
| ROE | 8.18% | 26.09% |
| ROIC | 5.37% | 12.79% |
| P/E | 34.26 | 36.18 |
| P/B | 2.80 | 9.44 |
| Current Ratio | 1.19 | 1.96 |
| Quick Ratio | 1.02 | 1.88 |
| D/E (Debt to Equity) | 0.53 | 0.98 |
| Debt-to-Assets | 25.35% | 36.78% |
| Interest Coverage | 3.68 | 9.64 |
| Asset Turnover | 0.53 | 0.94 |
| Fixed Asset Turnover | 8.20 | 2.12 |
| Payout Ratio | 56.23% | 31.34% |
| Dividend Yield | 1.64% | 0.87% |
| Fiscal Year | 2025 | 2024 |
Efficiency & Valuation Duel: The Vital Signs
Financial ratios serve as a company’s DNA, unveiling operational strengths and hidden risks essential for investment decisions.
L3Harris Technologies, Inc.
LHX posts a modest 8.18% ROE, signaling muted profitability relative to its 7.35% net margin. The stock trades at a stretched P/E of 34.3 and a neutral P/S ratio. Shareholders receive a 1.64% dividend yield, reflecting moderate returns amid a reinvestment focus on intangible assets and steady capital allocation.
BWX Technologies, Inc.
BWXT impresses with a robust 26.1% ROE and a healthy 10.4% net margin, demonstrating operational efficiency. However, its valuation appears expensive, marked by a high P/E of 36.2 and a steep P/B near 9.4. Dividend yield is lower at 0.87%, suggesting more capital reinvestment to sustain growth and strong returns.
Premium Valuation vs. Operational Strength
BWXT offers superior profitability but at a premium valuation and lower yield. LHX maintains balanced metrics with moderate profitability and stable dividends. Investors seeking growth might favor BWXT’s efficiency, while those prioritizing income and valuation stability could lean towards LHX.
Which one offers the Superior Shareholder Reward?
I compare L3Harris Technologies, Inc. (LHX) and BWX Technologies, Inc. (BWXT) based on their dividend yields, payout ratios, and share buybacks. LHX pays a 1.64% dividend yield with a high 56% payout ratio, backed by strong free cash flow coverage (86%). It also maintains substantial buybacks, boosting total returns sustainably. BWXT offers a lower 0.87% yield with a 31% payout ratio but shows weaker free cash flow coverage (62%) and a smaller buyback footprint. BWXT’s reinvestment focuses more on growth, but its higher leverage and valuation multiples raise risk. I find LHX’s balanced, cash-backed distribution model more sustainable and rewarding for 2026 investors.
Comparative Score Analysis: The Strategic Profile
The radar chart reveals the fundamental DNA and trade-offs of L3Harris Technologies and BWX Technologies, Inc., highlighting their core financial strengths and valuation nuances:
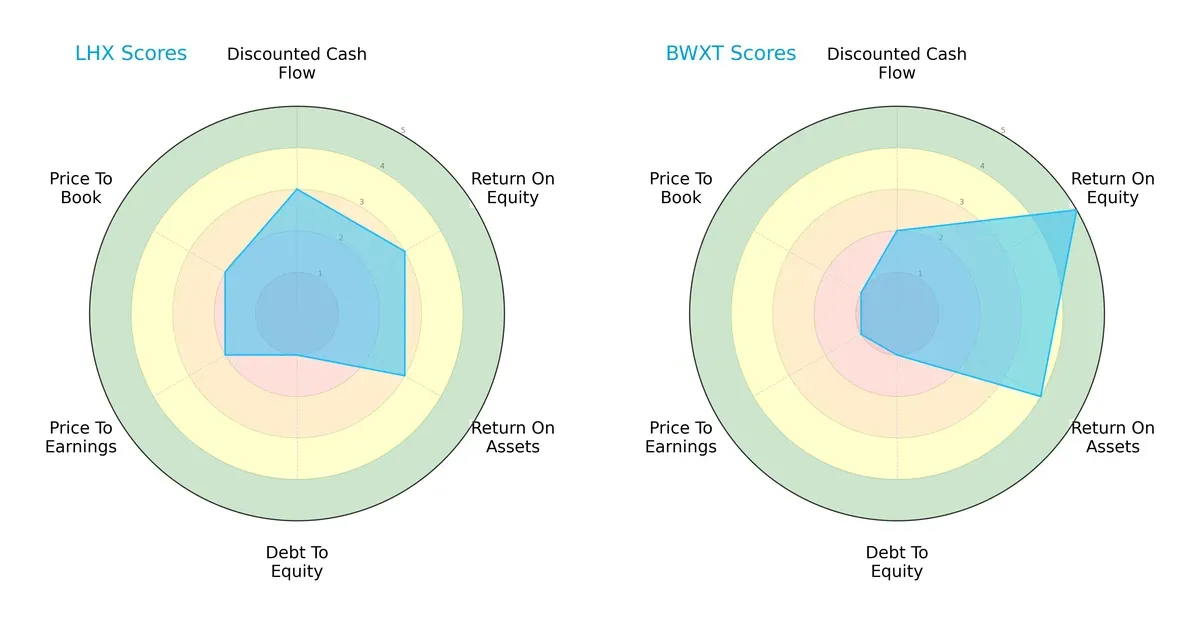
L3Harris maintains a balanced profile with moderate scores in DCF, ROE, and ROA, but struggles with leverage (debt-to-equity) and valuation multiples. BWX excels in profitability metrics, posting very favorable ROE and ROA scores, yet faces valuation and leverage challenges. L3Harris presents a more evenly distributed risk-return trade-off, while BWX relies heavily on operational efficiency to justify its valuation risks.
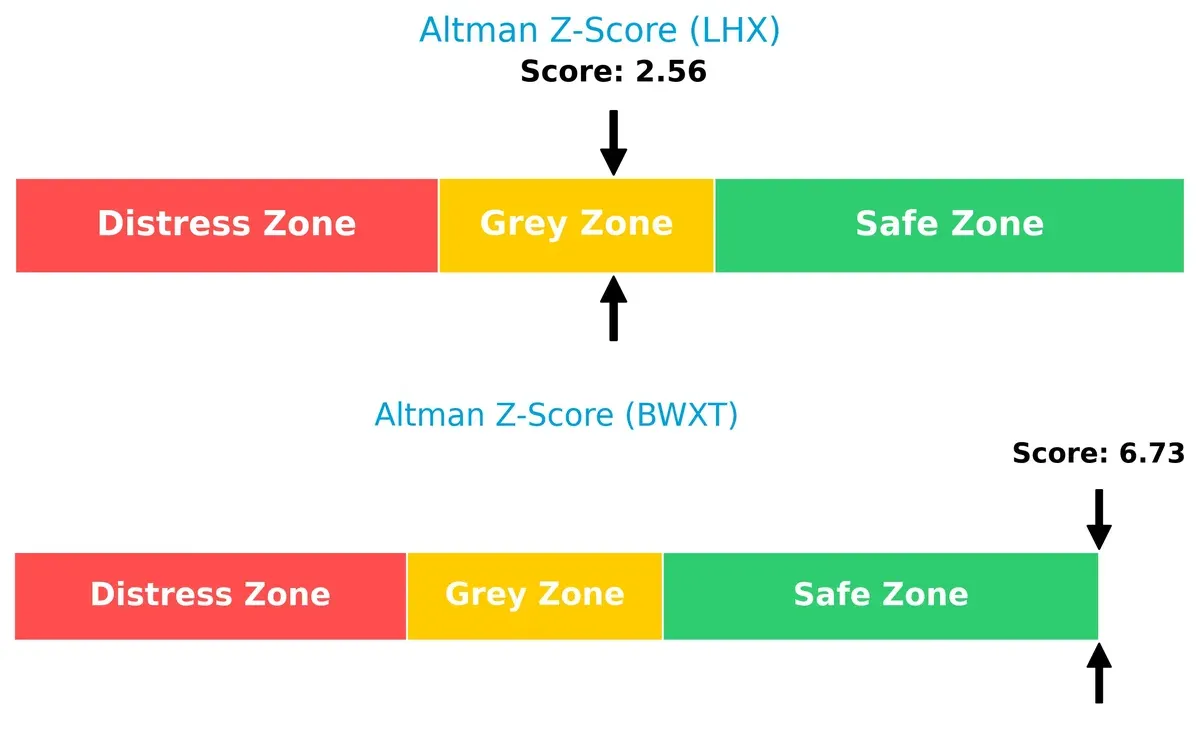
Bankruptcy Risk: Solvency Showdown
The Altman Z-Score gap shows BWX firmly in the safe zone (6.73), while L3Harris lingers in the grey zone (2.56), implying BWX has a stronger buffer against bankruptcy risk in this cycle:
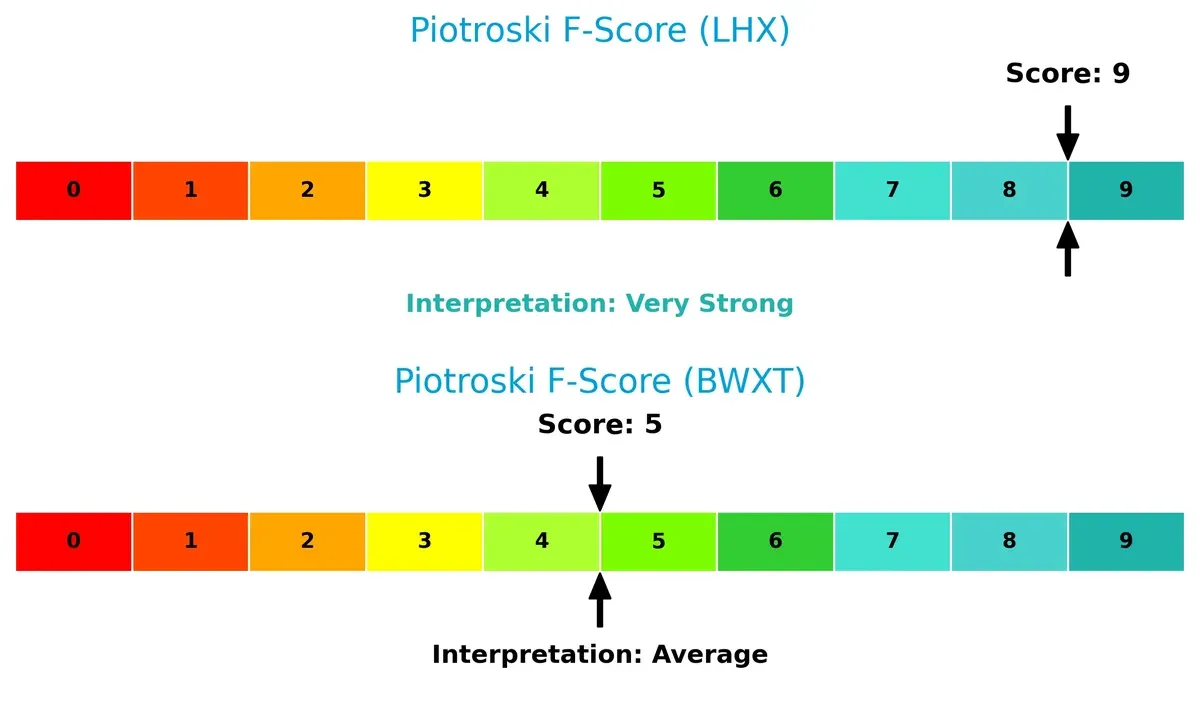
Financial Health: Quality of Operations
L3Harris scores a perfect 9 on the Piotroski F-Score, signaling peak financial health and operational robustness. BWX’s 5 indicates average health with some internal red flags worth monitoring:
How are the two companies positioned?
This section dissects LHX and BWXT’s operational DNA by comparing revenue distribution and internal dynamics. The goal is to confront their economic moats to identify the most resilient competitive advantage.
Revenue Segmentation: The Strategic Mix
This visual comparison dissects how L3Harris Technologies, Inc. and BWX Technologies, Inc. diversify their income streams and where their primary sector bets lie:
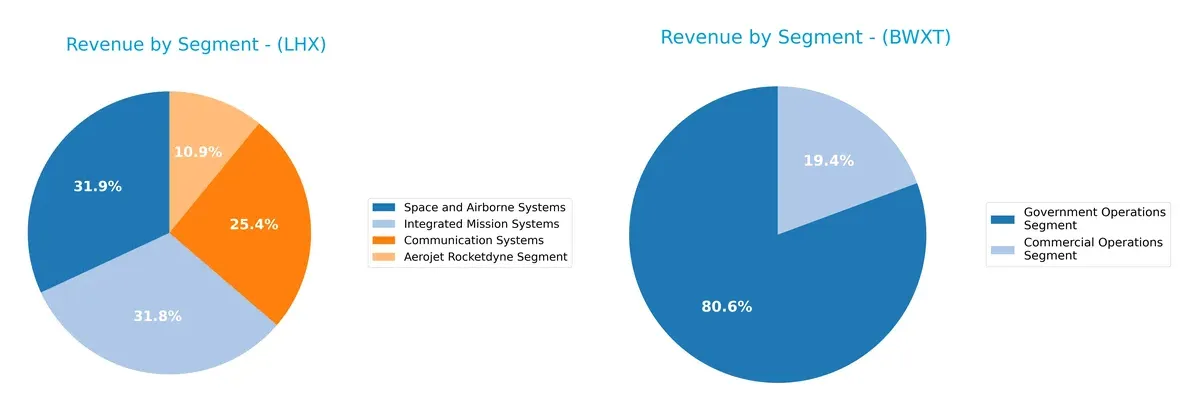
L3Harris anchors its revenue in three strong segments: Space and Airborne Systems ($6.87B), Integrated Mission Systems ($6.84B), and Communication Systems ($5.46B), showing a balanced portfolio. BWX Technologies pivots mainly on Government Operations ($2.18B), dwarfing its Commercial Operations ($524M) segment. L3Harris’s diversified mix reduces concentration risk, while BWX’s reliance on government contracts underscores infrastructure dominance but heightens dependency risk.
Strengths and Weaknesses Comparison
This table compares the strengths and weaknesses of L3Harris Technologies, Inc. (LHX) and BWX Technologies, Inc. (BWXT):
LHX Strengths
- Diversified revenue across four major segments
- Favorable fixed asset turnover at 8.2
- Low debt-to-assets ratio at 25.35%
- Quick ratio above 1.0 indicates liquidity
BWXT Strengths
- Higher profitability with net margin 10.43% and ROE 26.09%
- Favorable current and quick ratios above 1.8
- Strong interest coverage at 9.83
- Global revenue presence including US and Canada
LHX Weaknesses
- ROE at 8.18% is unfavorable versus WACC
- PE ratio high at 34.26, considered unfavorable
- Moderate net margin at 7.35%
- Neutral current ratio at 1.19 may limit flexibility
BWXT Weaknesses
- High PE at 36.18 and PB at 9.44, unfavorable valuation metrics
- Lower dividend yield at 0.87%
- Higher debt-to-assets ratio at 36.78%
- Asset turnover moderate at 0.94 and fixed asset turnover at 2.12
Both companies show slightly favorable overall financial profiles. LHX benefits from a diversified business model and solid asset efficiency, while BWXT excels in profitability and liquidity. However, valuation concerns and leverage levels present risks that should inform their strategic financial management.
The Moat Duel: Analyzing Competitive Defensibility
A structural moat is the only true barrier protecting long-term profits from relentless competition erosion. Here’s how L3Harris and BWX Technologies defend their turf:
L3Harris Technologies, Inc.: Intangible Assets Powering Mission-Critical Defense
L3Harris leverages deep government contracts and advanced ISR technologies as its moat. Despite favorable margins, its ROIC trails WACC, signaling shrinking value. New product launches in space and cyber defense could either extend or strain this moat in 2026.
BWX Technologies, Inc.: Cost Advantage in Nuclear Components
BWXT’s moat rests on cost efficiency and specialized nuclear manufacturing for defense and energy sectors. It consistently generates ROIC above WACC, creating value despite a declining trend. Expansion in nuclear power and naval propulsion offers upside potential.
Nuclear Precision vs. Defense Innovation: Which Moat Holds Deeper?
BWXT wields a wider moat with positive ROIC spread over WACC, signaling efficient capital use. L3Harris’s intangible assets are strong but currently eroding value. BWXT appears better equipped to defend and grow its market share in the evolving aerospace and defense landscape.
Which stock offers better returns?
The past year shows strong price appreciation for both stocks, with L3Harris Technologies and BWX Technologies exhibiting marked bullish momentum and accelerating gains.
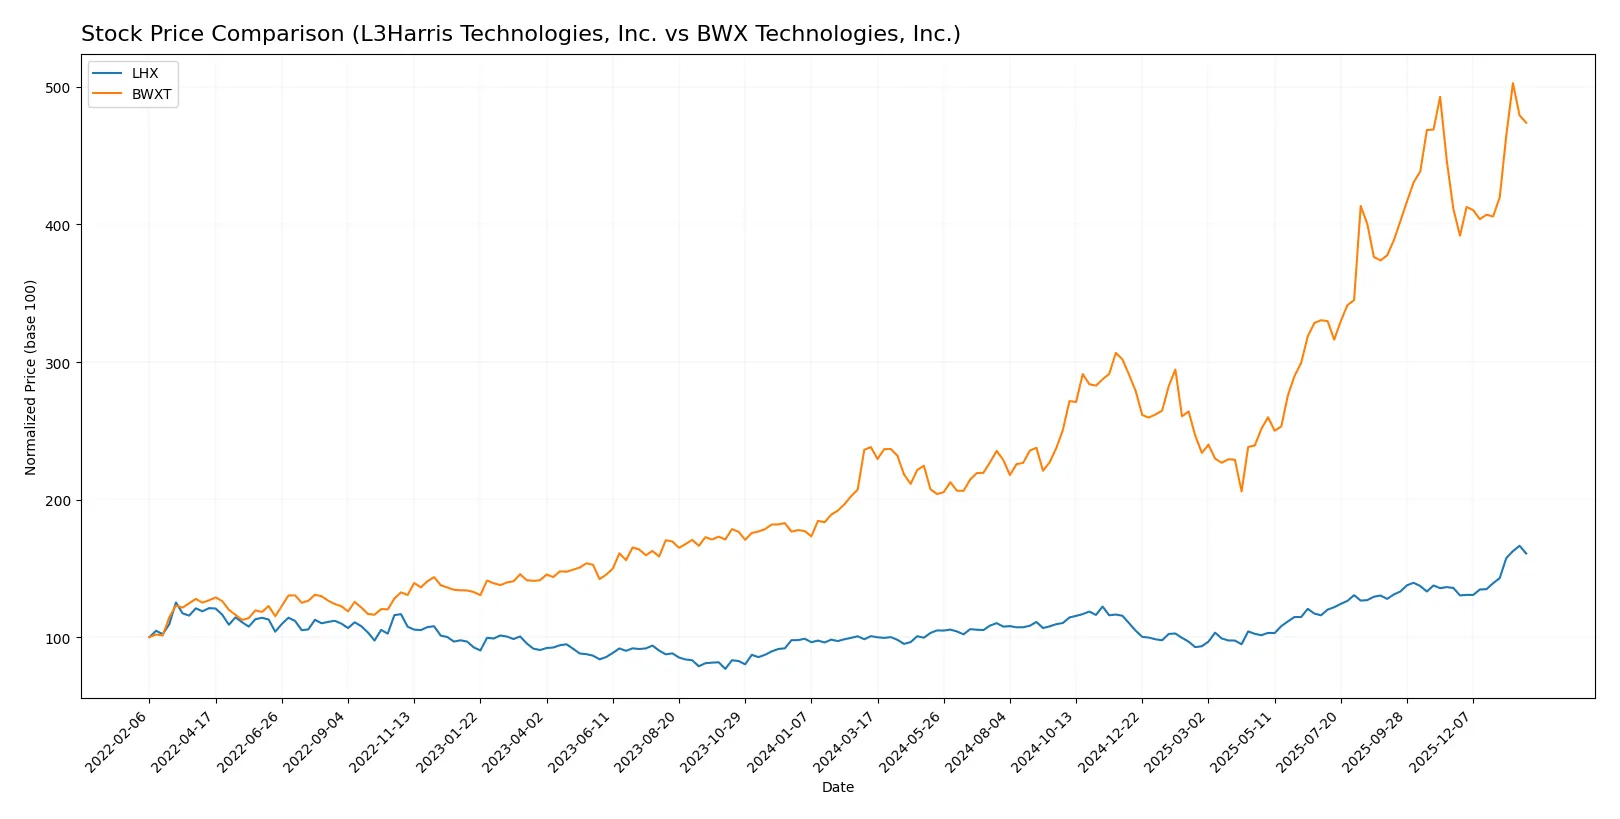
Trend Comparison
L3Harris Technologies (LHX) gained 59.76% over the past 12 months, showing a bullish trend with accelerating momentum and a high volatility level (std dev 35.05). The price ranged from 198 to 355.
BWX Technologies (BWXT) posted a 99.08% increase over the same period, also bullish with acceleration and slightly higher volatility (std dev 36.35). The price moved between 88 and 218.
BWXT outperformed LHX by nearly 40 percentage points, delivering the highest market returns while both stocks displayed strong upward trends with acceleration.
Target Prices
Analysts present a bullish consensus for L3Harris Technologies and BWX Technologies, reflecting confidence in their aerospace and defense growth prospects.
| Company | Target Low | Target High | Consensus |
|---|---|---|---|
| L3Harris Technologies, Inc. | 323 | 367 | 352.25 |
| BWX Technologies, Inc. | 180 | 225 | 204 |
The target consensus for LHX stands about 3% above its current price of 342.85, signaling moderate upside. BWXT’s consensus target closely aligns with its current price of 205.43, suggesting a fairly valued stock with limited near-term upside.

Don’t Let Luck Decide Your Entry Point
Optimize your entry points with our advanced ProRealTime indicators. You’ll get efficient buy signals with precise price targets for maximum performance. Start outperforming now!
How do institutions grade them?
L3Harris Technologies, Inc. Grades
The following table shows recent institutional grades for L3Harris Technologies:
| Grading Company | Action | New Grade | Date |
|---|---|---|---|
| RBC Capital | maintain | Sector Perform | 2026-01-30 |
| UBS | maintain | Neutral | 2026-01-15 |
| RBC Capital | maintain | Sector Perform | 2026-01-14 |
| Citigroup | maintain | Buy | 2026-01-13 |
| Morgan Stanley | upgrade | Overweight | 2025-12-16 |
| JP Morgan | maintain | Overweight | 2025-11-04 |
| UBS | maintain | Neutral | 2025-10-31 |
| Truist Securities | maintain | Buy | 2025-10-15 |
| Morgan Stanley | maintain | Equal Weight | 2025-10-15 |
| Barclays | maintain | Overweight | 2025-07-29 |
BWX Technologies, Inc. Grades
Below are the latest institutional grades issued for BWX Technologies:
| Grading Company | Action | New Grade | Date |
|---|---|---|---|
| Seaport Global | downgrade | Neutral | 2026-01-20 |
| B of A Securities | maintain | Buy | 2025-11-13 |
| BTIG | maintain | Buy | 2025-11-07 |
| Truist Securities | maintain | Hold | 2025-11-04 |
| Truist Securities | maintain | Hold | 2025-10-15 |
| Deutsche Bank | maintain | Hold | 2025-10-08 |
| B of A Securities | maintain | Buy | 2025-08-13 |
| Deutsche Bank | maintain | Hold | 2025-08-06 |
| Maxim Group | downgrade | Hold | 2025-08-06 |
| Truist Securities | maintain | Hold | 2025-08-05 |
Which company has the best grades?
L3Harris Technologies consistently receives higher grades, including multiple “Buy” and “Overweight” ratings. BWX Technologies has more “Hold” and recent downgrades, signaling cautious sentiment. Investors may interpret L3Harris’s stronger grades as greater confidence in its outlook.
Risks specific to each company
The following categories identify the critical pressure points and systemic threats facing both firms in the 2026 market environment:
1. Market & Competition
L3Harris Technologies, Inc. (LHX)
- Faces intense competition in aerospace & defense with technology innovation as a key driver.
BWX Technologies, Inc. (BWXT)
- Operates in a niche nuclear components market but faces regulatory and technological competition.
2. Capital Structure & Debt
LHX
- Moderate debt-to-equity (0.53) with favorable debt-to-assets (25.35%) supports financial flexibility.
BWXT
- Higher leverage (D/E ~0.98) and neutral debt-to-assets (36.78%) increase financial risk.
3. Stock Volatility
LHX
- Beta 0.66 implies lower volatility and less market sensitivity.
BWXT
- Beta 0.85 indicates moderate volatility and higher sensitivity to market swings.
4. Regulatory & Legal
LHX
- Aerospace & defense sector exposed to changing government contracts and export controls.
BWXT
- Nuclear manufacturing subject to strict regulations and potential liabilities.
5. Supply Chain & Operations
LHX
- Complex global supply chain with some exposure to component shortages and geopolitical risk.
BWXT
- Specialized supply chain for nuclear components with high operational safety standards required.
6. ESG & Climate Transition
LHX
- Increasing pressure to reduce emissions and enhance sustainable defense technologies.
BWXT
- Nuclear focus offers low-carbon energy benefits but faces public perception challenges.
7. Geopolitical Exposure
LHX
- Global operations expose it to geopolitical tensions impacting contracts and supply chains.
BWXT
- Primarily US and Canada focused but sensitive to international nuclear policy shifts.
Which company shows a better risk-adjusted profile?
BWXT’s superior profitability and Altman Z-Score in the safe zone contrast with LHX’s moderate credit metrics and grey zone distress score. However, BWXT’s higher leverage and valuation multiples present risks. LHX offers lower stock volatility and more balanced capital structure, cushioning against market shocks. I see BWXT’s operational specialization as an advantage but with elevated financial risk. LHX’s diverse portfolio and solid liquidity provide steadier risk mitigation. Overall, BWXT carries higher return potential but with greater risk; LHX is the more conservative pick under current market pressures.
Final Verdict: Which stock to choose?
L3Harris Technologies, Inc. (LHX) shines as a cash generator with solid operational efficiency and favorable income statement metrics. Its main point of vigilance is a declining return on invested capital, signaling potential value erosion. This stock might suit investors targeting aggressive growth with tolerance for cyclical challenges.
BWX Technologies, Inc. (BWXT) boasts a strategic moat grounded in high returns on equity and invested capital, reflecting strong capital allocation. Its balance sheet and safety profile appear more robust than LHX’s. BWXT could appeal to investors seeking growth at a reasonable price with a preference for stability.
If you prioritize dynamic cash flow and operational efficiency, LHX is the compelling choice due to its income strength and market momentum. However, if you seek durable value creation and financial safety, BWXT offers better stability despite its premium valuation. Each presents distinct profiles for different investor strategies.
Disclaimer: Investment carries a risk of loss of initial capital. The past performance is not a reliable indicator of future results. Be sure to understand risks before making an investment decision.
Go Further
I encourage you to read the complete analyses of L3Harris Technologies, Inc. and BWX Technologies, Inc. to enhance your investment decisions: