Home > Comparison > Industrials > BWXT vs HII
The strategic rivalry between BWX Technologies, Inc. and Huntington Ingalls Industries, Inc. shapes the aerospace and defense sector’s evolution. BWX Technologies focuses on nuclear components and services, emphasizing precision and innovation. Huntington Ingalls operates as a market-leading shipbuilder, specializing in military vessels and lifecycle sustainment. This analysis will evaluate their distinct operational models to determine which offers a superior risk-adjusted return for diversified investors in 2026.
Table of contents
Companies Overview
BWX Technologies and Huntington Ingalls Industries anchor critical segments of the U.S. defense industrial base.
BWX Technologies, Inc.: Nuclear Component Specialist
BWX Technologies commands a leading position in manufacturing nuclear components and fuel, serving the U.S. Department of Energy and Navy. Its revenue hinges on precision naval reactors, nuclear fuel, and medical isotopes. In 2026, BWXT prioritizes advanced nuclear propulsion and fuel cycle technologies, reinforcing its niche in nuclear operations and services.
Huntington Ingalls Industries, Inc.: Military Shipbuilder and Naval Services Provider
Huntington Ingalls Industries dominates U.S. military shipbuilding and repair, focusing on surface combatants and nuclear-powered vessels. Its core revenue comes from designing and maintaining ships for the Navy and Coast Guard. The company’s 2026 strategy emphasizes lifecycle sustainment and nuclear support services, extending its footprint across shipbuilding and defense technology solutions.
Strategic Collision: Similarities & Divergences
Both firms thrive in aerospace and defense, but BWXT centers on nuclear propulsion and fuel while HII leads in naval ship construction and sustainment. They compete indirectly in naval defense markets, with BWXT’s closed nuclear technology contrasting HII’s broader maritime platform services. Their investment profiles diverge: BWXT offers specialized nuclear tech exposure, while HII provides diversified shipbuilding and defense services.
Income Statement Comparison
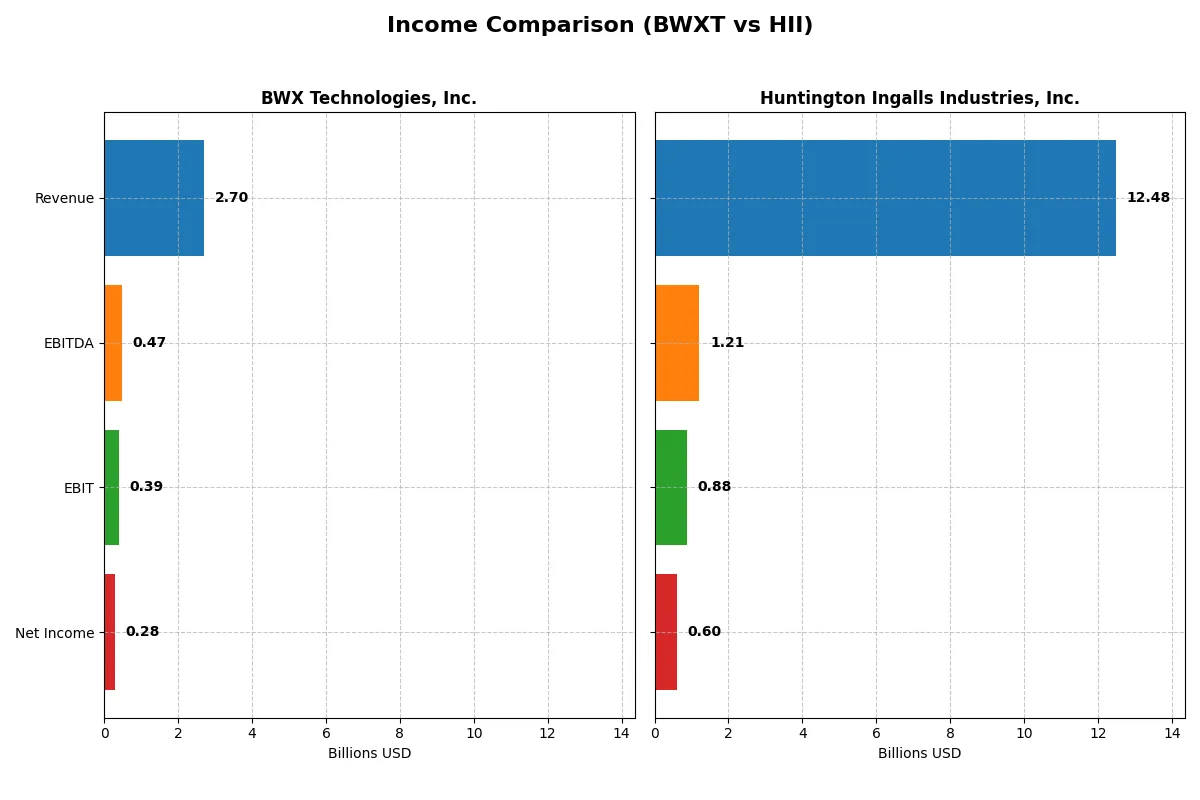
This data dissects the core profitability and scalability of both corporate engines to reveal who dominates the bottom line:
| Metric | BWX Technologies, Inc. (BWXT) | Huntington Ingalls Industries, Inc. (HII) |
|---|---|---|
| Revenue | 2.7B | 12.5B |
| Cost of Revenue | 2.0B | 10.9B |
| Operating Expenses | 275M | 977M |
| Gross Profit | 655M | 1.6B |
| EBITDA | 474M | 1.2B |
| EBIT | 388M | 882M |
| Interest Expense | 39M | 105M |
| Net Income | 282M | 605M |
| EPS | 3.08 | 15.39 |
| Fiscal Year | 2024 | 2025 |
Income Statement Analysis: The Bottom-Line Duel
This income statement comparison reveals which company delivers superior operational efficiency and bottom-line strength in their respective markets.
BWX Technologies, Inc. Analysis
BWXT’s revenue grew steadily from 2.12B in 2020 to 2.7B in 2024, showing consistent top-line expansion. Net income oscillated, peaking at 306M in 2021 before settling at 282M in 2024. Gross and net margins remain healthy at 24.2% and 10.4%, respectively, indicating solid cost control and operational discipline. The 2024 earnings per share rose 14.5% year-over-year, signaling improving profitability momentum.
Huntington Ingalls Industries, Inc. Analysis
HII expanded revenue from 9.52B in 2021 to 12.48B in 2025, a robust growth trajectory. Net income climbed from 544M to 605M, although margins are thinner, with a gross margin around 12.7% and net margin at 4.9%, reflecting the capital-intensive nature of its business. The company improved EBIT by nearly 20% in the latest year, showing accelerating operating efficiency despite modest net margin gains.
Margin Strength vs. Scale Growth
BWXT exhibits stronger margins and steady net income growth, highlighting operational efficiency. HII boasts higher revenue scale and faster EBIT growth but operates with slimmer margins. BWXT’s profile suits investors prioritizing profitability and margin resilience. HII appeals to those valuing top-line expansion and improving operating leverage in a large industrial player.
Financial Ratios Comparison
These vital ratios act as a diagnostic tool to expose the underlying fiscal health, valuation premiums, and capital efficiency of the companies analyzed below:
| Ratios | BWX Technologies, Inc. (BWXT) | Huntington Ingalls Industries, Inc. (HII) |
|---|---|---|
| ROE | 26.1% | 11.9% |
| ROIC | 12.8% | 9.0% |
| P/E | 36.2 | 22.1 |
| P/B | 9.44 | 2.63 |
| Current Ratio | 1.96 | 1.13 |
| Quick Ratio | 1.88 | 1.06 |
| D/E (Debt to Equity) | 0.98 | 0.62 |
| Debt-to-Assets | 36.8% | 24.7% |
| Interest Coverage | 9.64 | 5.79 |
| Asset Turnover | 0.94 | 0.98 |
| Fixed Asset Turnover | 2.12 | 3.35 |
| Payout ratio | 31.3% | 35.2% |
| Dividend yield | 0.87% | 1.59% |
| Fiscal Year | 2024 | 2025 |
Efficiency & Valuation Duel: The Vital Signs
Ratios serve as a company’s DNA, exposing hidden risks and operational strengths fundamental to investment decisions.
BWX Technologies, Inc.
BWXT displays robust profitability with a 26.1% ROE and a strong 10.4% net margin, signaling operational efficiency. However, its valuation appears stretched at a 36.2 P/E and 9.4 P/B, suggesting high market expectations. Shareholders see a modest 0.87% dividend yield, reflecting a blend of income and reinvestment in growth.
Huntington Ingalls Industries, Inc.
HII posts a moderate 11.9% ROE and a weaker 4.9% net margin, indicating less profitability than BWXT. Its valuation is more reasonable with a 22.1 P/E and 2.6 P/B, implying less price pressure. The company offers a 1.59% dividend yield, balancing cash returns with steady operational performance.
Premium Valuation vs. Operational Safety
BWXT commands a premium valuation on superior profitability but at higher risk due to stretched multiples. HII offers a safer valuation with moderate returns and better dividend income. Investors seeking growth may prefer BWXT’s profile; those prioritizing income and valuation stability may lean toward HII.
Which one offers the Superior Shareholder Reward?
I compare BWX Technologies and Huntington Ingalls Industries on dividends and buybacks. BWXT yields 0.87% with a payout ratio near 31%, supported by solid free cash flow of 2.8B. Its buybacks are moderate but consistent. HII offers a higher dividend yield near 2.8%, but with a payout ratio above 35%, pressuring cash flow. HII’s buyback program is less aggressive, focusing more on dividends. BWXT’s balanced approach of paying dividends while retaining capital for growth appears more sustainable. For 2026, I favor BWXT for a superior total return profile, blending steady income with growth potential.
Comparative Score Analysis: The Strategic Profile
The radar chart reveals the fundamental DNA and trade-offs of BWX Technologies and Huntington Ingalls Industries, highlighting their strategic strengths and vulnerabilities:
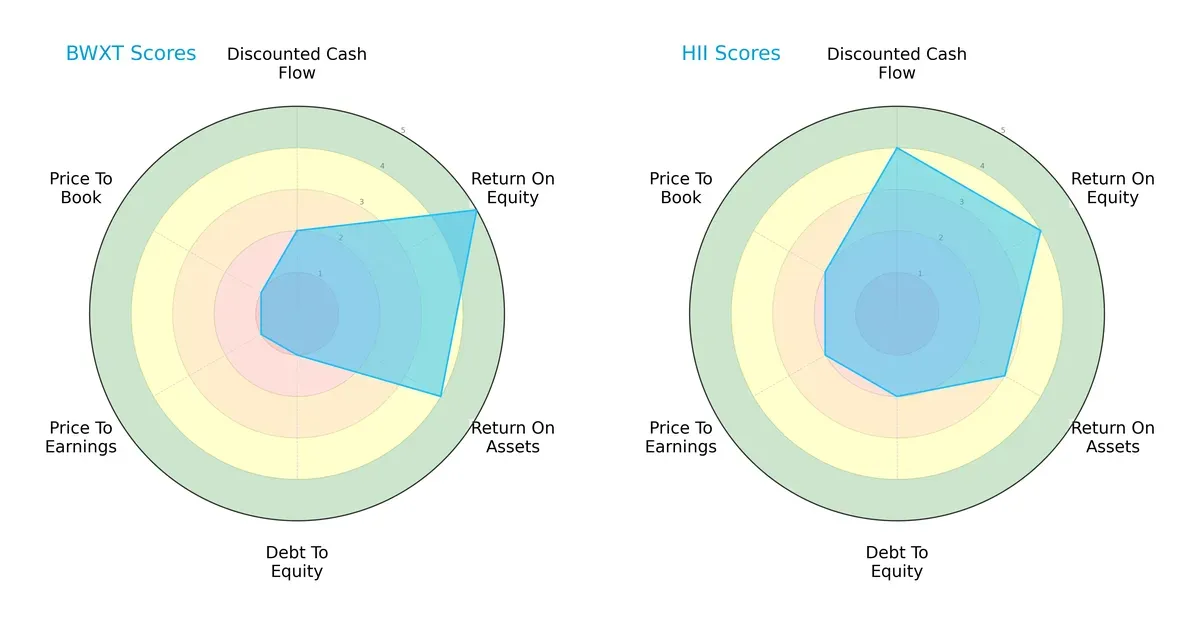
BWXT excels in profitability with a very favorable ROE (5) and strong ROA (4), but struggles with valuation and leverage, scoring very unfavorable in debt-to-equity (1), P/E (1), and P/B (1). HII presents a more balanced profile with moderate to favorable scores across DCF (4), ROE (4), ROA (3), and slightly better debt management (2). BWXT relies heavily on operational efficiency, while HII maintains steadier valuation and financial stability.
Bankruptcy Risk: Solvency Showdown
BWXT’s Altman Z-Score (6.79) significantly exceeds HII’s (3.07), indicating a stronger buffer against bankruptcy risk in this cycle:
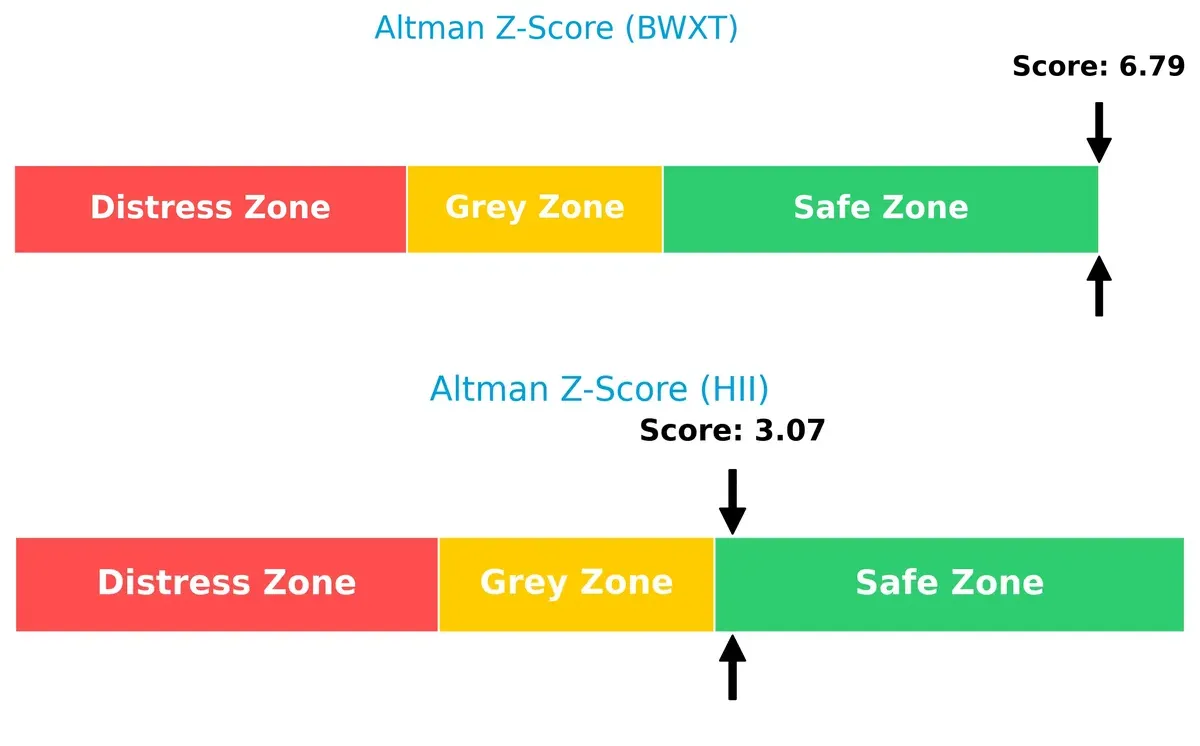
Both companies sit comfortably in the safe zone, but BWXT’s higher score suggests superior solvency resilience and lower default risk, an important consideration in volatile market conditions.
Financial Health: Quality of Operations
HII’s Piotroski F-Score (7) surpasses BWXT’s (5), reflecting stronger internal financial health and operational quality:
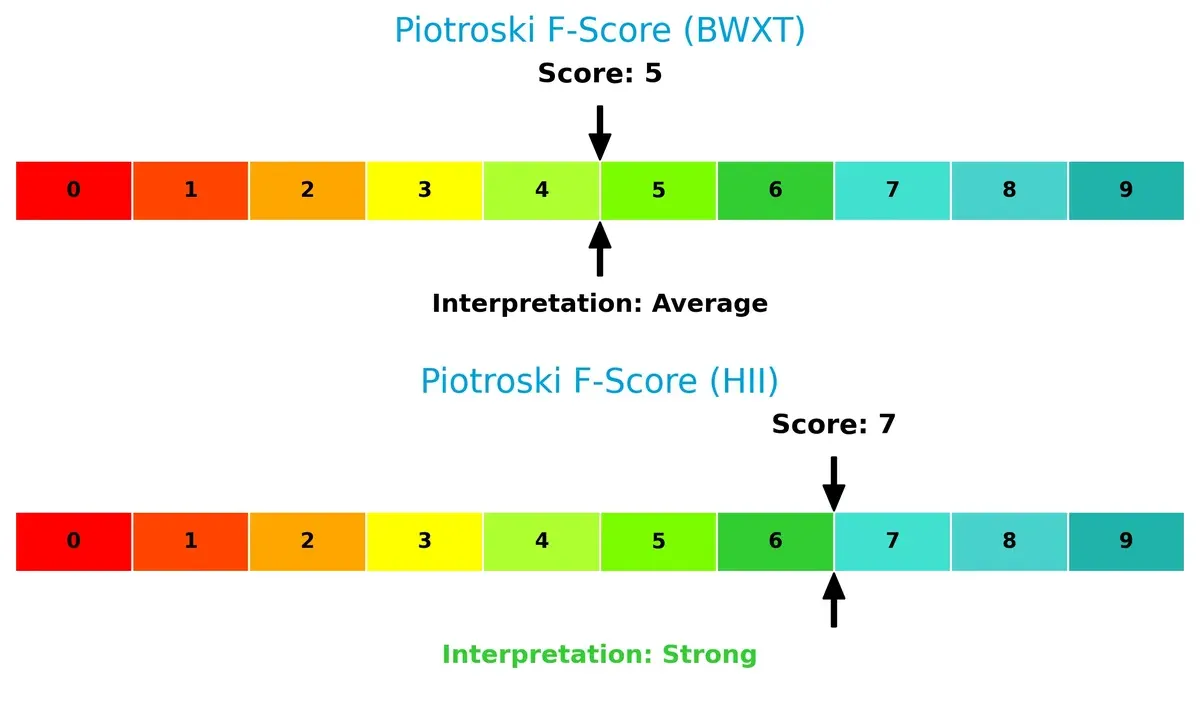
HII’s score signals robust profitability, liquidity, and efficiency metrics, whereas BWXT’s middling score raises mild red flags about its internal financial consistency. Investors should monitor BWXT’s operational improvements closely.
How are the two companies positioned?
This section dissects BWXT and HII’s operational DNA by comparing revenue distribution and internal strengths and weaknesses. The aim is to confront their economic moats to identify which model offers the most resilient, sustainable competitive advantage today.
Revenue Segmentation: The Strategic Mix
This visual comparison dissects how BWX Technologies, Inc. and Huntington Ingalls Industries, Inc. diversify their income streams and where their primary sector bets lie:
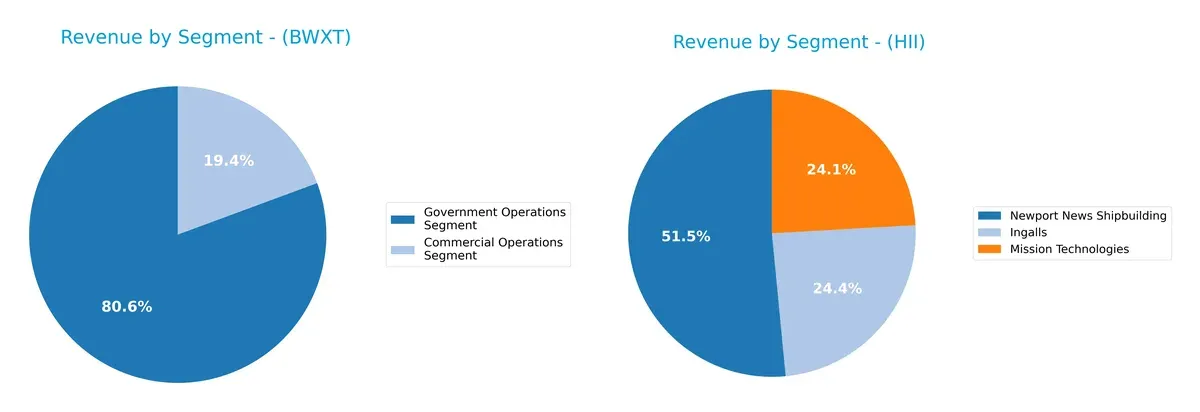
BWXT anchors its revenue in Government Operations at $2.18B, with Commercial Operations contributing $524M, showing moderate concentration but some diversification. In contrast, HII’s revenue pivots around Newport News Shipbuilding at $6.51B, with Ingalls and Mission Technologies both near $3B. HII’s broader segment spread suggests a balanced defense-industrial ecosystem, while BWXT’s focus signals reliance on government contracts, posing concentration risk yet offering stable government lock-in.
Strengths and Weaknesses Comparison
This table compares the strengths and weaknesses of BWX Technologies and Huntington Ingalls Industries:
BWX Technologies Strengths
- Higher net margin (10.43%) and ROE (26.09%) indicating strong profitability
- Favorable liquidity ratios near 2
Huntington Ingalls Industries Strengths
- Lower debt-to-assets ratio (24.68%) and favorable interest coverage support financial stability
- Higher fixed asset turnover (3.35) showing efficient asset use
BWX Technologies Weaknesses
- High P/E (36.18) and P/B (9.44) ratios suggest overvaluation risk
- Low dividend yield (0.87%)
Huntington Ingalls Industries Weaknesses
- Lower net margin (4.85%) reflects weaker profitability
- Current ratio (1.13) is only neutral, limiting liquidity cushion
BWXT demonstrates stronger profitability and liquidity but carries valuation risks. HII shows financial stability with better asset efficiency but suffers weaker profit margins and less liquidity. These contrasts highlight differing strategic focuses and financial profiles.
The Moat Duel: Analyzing Competitive Defensibility
A structural moat is the only true shield protecting long-term profits from relentless competitive erosion. Let’s dissect the moats of two aerospace & defense giants:
BWX Technologies, Inc.: Precision Nuclear Components with Cost Advantage
BWXT’s moat stems from its specialized nuclear components and fuel supply. This manifests in steady 14% EBIT margins and a 5.4% ROIC premium over WACC. However, declining ROIC signals emerging margin pressure in 2026.
Huntington Ingalls Industries, Inc.: Integrated Shipbuilding and Nuclear Services
HII’s moat relies on scale and lifecycle naval services, contrasting BWXT’s niche focus. Its ROIC grows strongly, now 4.1% above WACC, reflecting expanding profitability and operational leverage into new defense contracts.
Verdict: Specialized Precision vs. Broad Naval Integration
BWXT’s moat is deeper in nuclear specialization, but HII’s expanding ROIC and broad defense footprint signal a wider moat. HII appears better positioned to defend and grow market share through diversified government contracts.
Which stock offers better returns?
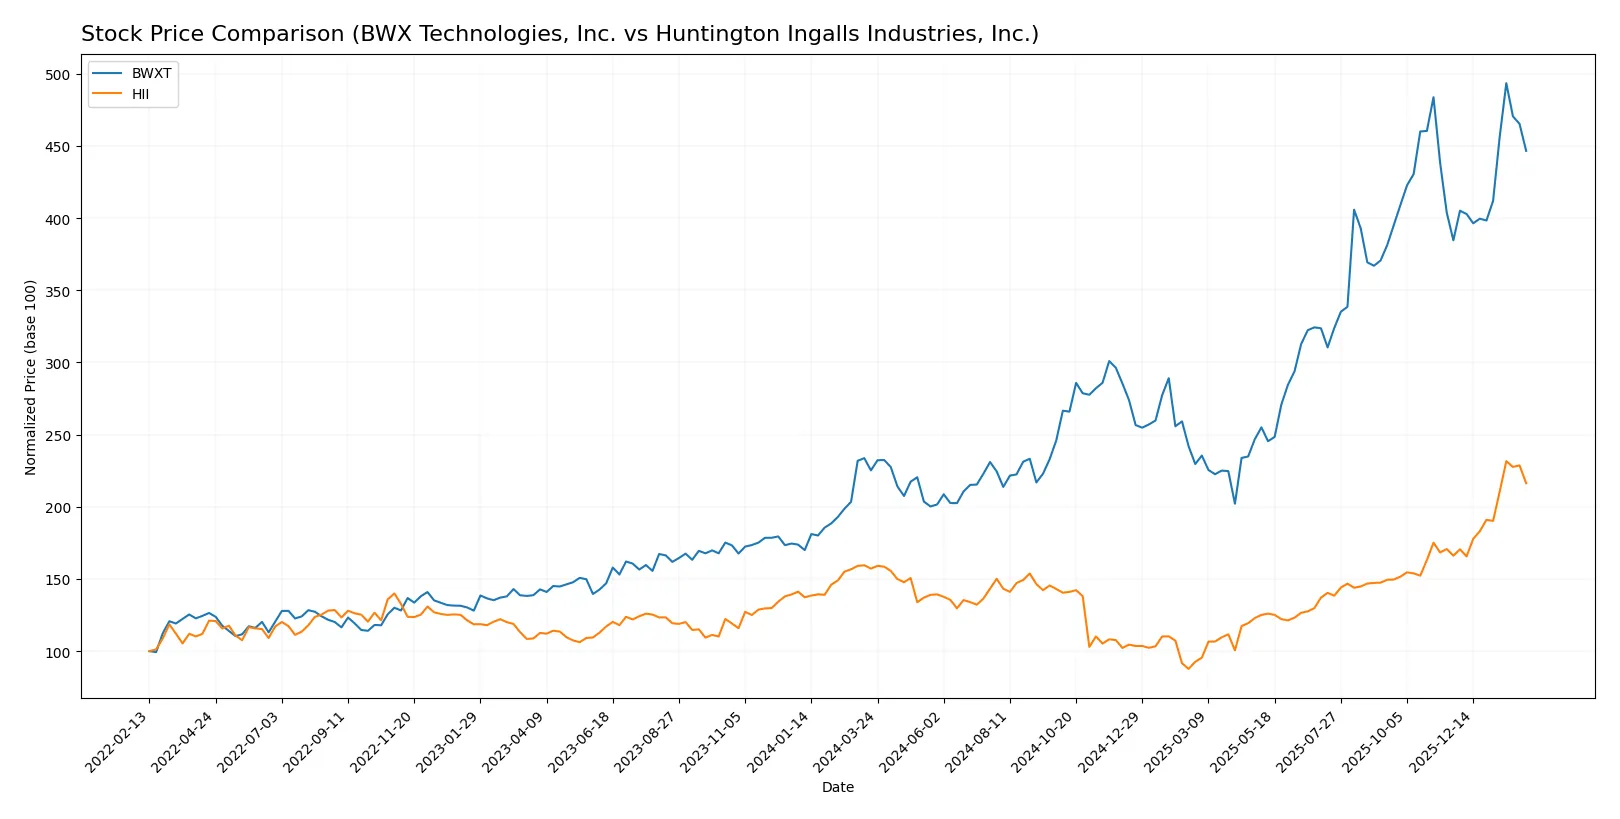
Over the past year, BWX Technologies, Inc. and Huntington Ingalls Industries, Inc. both showed strong upward price movements with accelerating trends and distinct trading volume dynamics.
Trend Comparison
BWXT’s stock price soared 98.28% over the past 12 months, marking a bullish trend with acceleration. It hit a high of 217.89 and a low of 88.41, showing moderate volatility (std dev 36.87).
HII’s price rose 37.63% in the same period, also bullish with acceleration. It reached a peak of 425.9 and a low of 161.27, but displayed higher volatility (std dev 54.23).
BWXT outperformed HII with a near 100% gain versus 38%, delivering the stronger market performance over the past year.
Target Prices
Analysts present a robust target consensus for BWX Technologies, Inc. and Huntington Ingalls Industries, Inc.
| Company | Target Low | Target High | Consensus |
|---|---|---|---|
| BWX Technologies, Inc. | 180 | 225 | 204 |
| Huntington Ingalls Industries, Inc. | 264 | 419 | 365 |
The target consensus for BWXT suggests upside potential from its current price of 197.19 USD. HII’s consensus at 365 USD sits below its current price of 397.77 USD, hinting at mixed analyst sentiment.

Don’t Let Luck Decide Your Entry Point
Optimize your entry points with our advanced ProRealTime indicators. You’ll get efficient buy signals with precise price targets for maximum performance. Start outperforming now!
How do institutions grade them?
BWX Technologies, Inc. Grades
This table summarizes recent institutional grading actions for BWX Technologies, Inc.:
| Grading Company | Action | New Grade | Date |
|---|---|---|---|
| Seaport Global | Downgrade | Neutral | 2026-01-20 |
| B of A Securities | Maintain | Buy | 2025-11-13 |
| BTIG | Maintain | Buy | 2025-11-07 |
| Truist Securities | Maintain | Hold | 2025-11-04 |
| Truist Securities | Maintain | Hold | 2025-10-15 |
| Deutsche Bank | Maintain | Hold | 2025-10-08 |
| B of A Securities | Maintain | Buy | 2025-08-13 |
| Deutsche Bank | Maintain | Hold | 2025-08-06 |
| Maxim Group | Downgrade | Hold | 2025-08-06 |
| Truist Securities | Maintain | Hold | 2025-08-05 |
Huntington Ingalls Industries, Inc. Grades
This table summarizes recent institutional grading actions for Huntington Ingalls Industries, Inc.:
| Grading Company | Action | New Grade | Date |
|---|---|---|---|
| Goldman Sachs | Maintain | Buy | 2026-01-20 |
| Citigroup | Maintain | Buy | 2026-01-13 |
| JP Morgan | Maintain | Neutral | 2025-11-03 |
| Goldman Sachs | Maintain | Buy | 2025-10-31 |
| TD Cowen | Maintain | Buy | 2025-10-31 |
| B of A Securities | Maintain | Underperform | 2025-08-13 |
| Barclays | Maintain | Equal Weight | 2025-08-04 |
| TD Cowen | Upgrade | Buy | 2025-07-10 |
| Barclays | Maintain | Equal Weight | 2025-05-05 |
| Goldman Sachs | Maintain | Buy | 2025-05-02 |
Which company has the best grades?
Huntington Ingalls Industries, Inc. consistently receives Buy ratings from top firms, while BWX Technologies, Inc. has mixed Buy and Hold grades with a recent downgrade. Investors may view Huntington Ingalls as having stronger institutional confidence.
Risks specific to each company
The following categories identify the critical pressure points and systemic threats facing both firms in the 2026 market environment:
1. Market & Competition
BWX Technologies, Inc.
- Operates in niche nuclear components market with high barriers but faces pricing pressure and innovation risks.
Huntington Ingalls Industries, Inc.
- Focuses on military shipbuilding with long-term contracts but exposed to defense budget fluctuations and competitive bidding.
2. Capital Structure & Debt
BWX Technologies, Inc.
- Debt-to-equity ratio near 1.0 signals moderate leverage; interest coverage strong at 9.83x, but debt level warrants careful monitoring.
Huntington Ingalls Industries, Inc.
- Lower debt-to-equity ratio of 0.62 reduces financial risk; interest coverage solid at 8.4x, supporting stable capital structure.
3. Stock Volatility
BWX Technologies, Inc.
- Beta of 0.83 indicates moderate sensitivity to market swings; price range wide, reflecting cyclical exposure.
Huntington Ingalls Industries, Inc.
- Very low beta of 0.33 shows defensive stock characteristics with less price volatility amid market uncertainties.
4. Regulatory & Legal
BWX Technologies, Inc.
- Subject to stringent nuclear regulatory oversight and compliance risks impacting project timelines and costs.
Huntington Ingalls Industries, Inc.
- Faces complex regulations in shipbuilding and defense contracts, with potential legal challenges linked to government procurement.
5. Supply Chain & Operations
BWX Technologies, Inc.
- Relies on specialized suppliers for nuclear materials; supply disruption risks could affect production continuity.
Huntington Ingalls Industries, Inc.
- Extensive operations with large workforce; supply chain complexity poses risks but benefits from diversified sourcing strategies.
6. ESG & Climate Transition
BWX Technologies, Inc.
- Nuclear focus aligns with low-carbon energy trends but faces scrutiny over radioactive waste management and environmental impact.
Huntington Ingalls Industries, Inc.
- Increasing pressure to decarbonize shipbuilding processes; ESG compliance costs may rise amid evolving climate regulations.
7. Geopolitical Exposure
BWX Technologies, Inc.
- International sales expose BWXT to geopolitical tensions and export control risks in nuclear technology.
Huntington Ingalls Industries, Inc.
- Primarily US-focused contracts reduce foreign geopolitical risks but remain sensitive to US defense policy shifts.
Which company shows a better risk-adjusted profile?
BWXT’s most impactful risk lies in its high valuation multiples combined with moderate leverage, raising concerns about financial stability under market stress. HII faces its biggest risk from lower profitability margins amid heavy reliance on fluctuating defense budgets. Despite BWXT’s leverage risk, its strong profitability and higher Altman Z-score suggest better financial resilience. HII’s superior Piotroski score indicates operational strength, but its lower net margin and higher regulatory complexity weigh on risk-adjusted appeal. Recent BWXT stock volatility and valuation premiums justify caution despite favorable fundamentals.
Final Verdict: Which stock to choose?
BWX Technologies, Inc. shines as a cash machine with a robust ability to generate high returns on capital. Its declining ROIC signals a point of vigilance, suggesting the need to monitor profitability trends closely. BWXT suits aggressive growth portfolios willing to embrace cyclical swings for long-term value creation.
Huntington Ingalls Industries, Inc. boasts a durable moat supported by steadily growing ROIC and a strong competitive position in defense contracting. Its financial stability and moderate valuation provide a safer profile compared to BWXT. HII fits portfolios seeking growth at a reasonable price with a tilt toward stability.
If you prioritize high-return potential and can tolerate profitability fluctuations, BWXT is the compelling choice due to its superior capital efficiency. However, if you seek a more stable, steadily improving moat with less volatility, HII offers better stability and a more balanced risk-reward profile. Both companies create value but appeal to distinct investor avatars.
Disclaimer: Investment carries a risk of loss of initial capital. The past performance is not a reliable indicator of future results. Be sure to understand risks before making an investment decision.
Go Further
I encourage you to read the complete analyses of BWX Technologies, Inc. and Huntington Ingalls Industries, Inc. to enhance your investment decisions: