Home > Comparison > Industrials > GD vs BWXT
The strategic rivalry between General Dynamics Corporation and BWX Technologies, Inc. defines the aerospace and defense sector’s evolution. General Dynamics operates as a diversified industrial powerhouse spanning aerospace, marine, and combat systems. In contrast, BWX Technologies specializes in nuclear components and services with a precision manufacturing focus. This analysis pits broad industrial scale against niche nuclear expertise to identify which trajectory offers superior risk-adjusted returns for a diversified portfolio.
Table of contents
Companies Overview
General Dynamics and BWX Technologies stand as pivotal players in the aerospace and defense sector with distinct market footprints and capabilities.
General Dynamics Corporation: Aerospace & Defense Powerhouse
General Dynamics dominates as a diversified aerospace and defense company. It generates revenue through four segments: aerospace business jets, marine systems including nuclear submarines, land combat vehicles, and advanced technologies like AI and cloud services. Its 2026 strategy emphasizes integrated defense solutions and modernization programs, leveraging a broad portfolio to capture government and commercial contracts.
BWX Technologies, Inc.: Nuclear Components Specialist
BWX Technologies focuses on manufacturing nuclear components critical for naval propulsion and commercial power. Revenue stems from nuclear reactors, fuel assemblies, and specialized nuclear services supporting defense and energy sectors. In 2026, BWX prioritizes expanding nuclear fuel innovations and enhancing nuclear power plant services, underpinning its niche leadership in nuclear technology and safety.
Strategic Collision: Similarities & Divergences
Both companies serve the defense sector but differ fundamentally: General Dynamics operates a broad multi-segment platform, while BWX specializes in nuclear technology. Their primary battleground is government defense contracts, with General Dynamics competing across multiple domains and BWX concentrating on nuclear propulsion and energy. Investors face contrasting profiles—General Dynamics offers diversified exposure, whereas BWX delivers focused nuclear expertise.
Income Statement Comparison
This data dissects the core profitability and scalability of both corporate engines to reveal who dominates the bottom line:
| Metric | General Dynamics Corporation (GD) | BWX Technologies, Inc. (BWXT) |
|---|---|---|
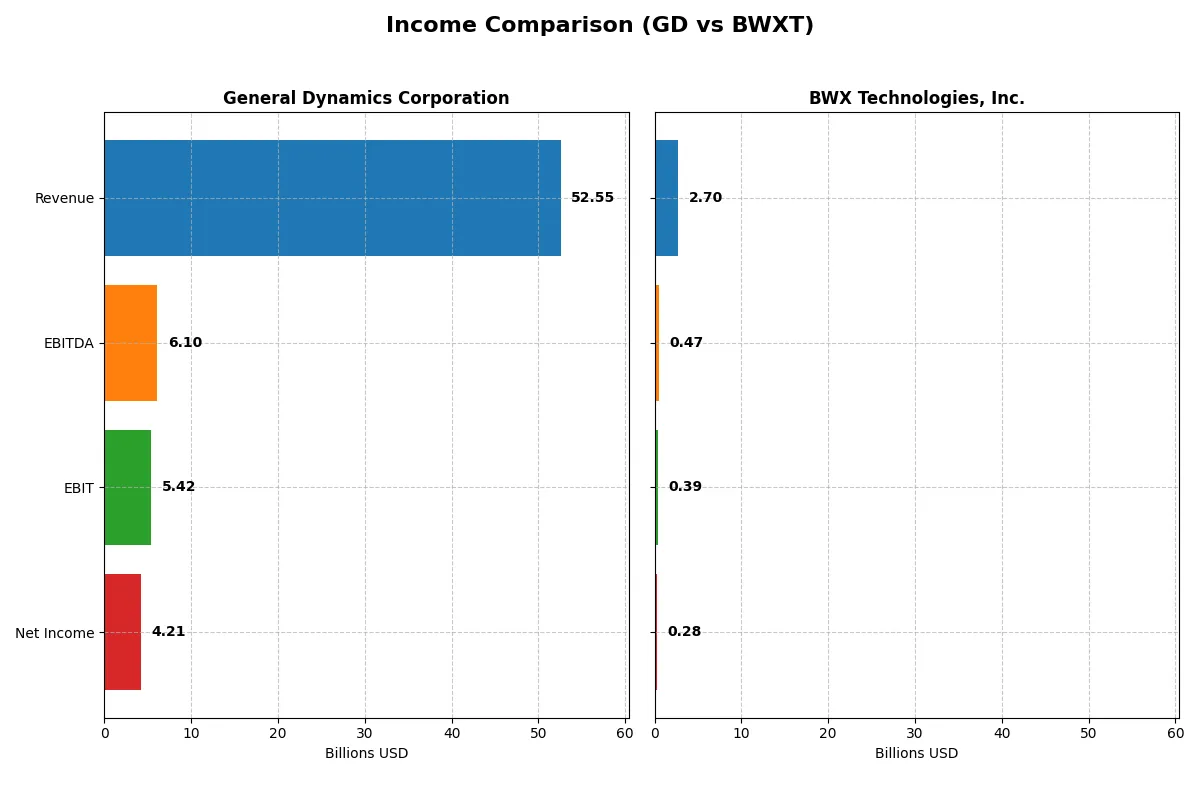
| Revenue | 52.6B | 2.7B |
| Cost of Revenue | 44.6B | 2.0B |
| Operating Expenses | 2.6B | 275M |
| Gross Profit | 7.9B | 655M |
| EBITDA | 6.1B | 474M |
| EBIT | 5.4B | 388M |
| Interest Expense | 314M | 39M |
| Net Income | 4.2B | 282M |
| EPS | 15.64 | 3.08 |
| Fiscal Year | 2025 | 2024 |
Income Statement Analysis: The Bottom-Line Duel
This income statement comparison reveals which company drives superior earnings efficiency and growth through their core operations.
General Dynamics Corporation Analysis
General Dynamics grew revenue from $38.5B in 2021 to $52.6B in 2025, boosting net income from $3.3B to $4.2B. Its gross margin remains stable at 15.1%, while the net margin improved to 8.0%. The 2025 year shows strong momentum with 10% revenue growth and nearly 13.5% EPS growth, reflecting efficient cost control and expanding profitability.
BWX Technologies, Inc. Analysis
BWXT increased revenue from $2.1B in 2020 to $2.7B in 2024, with net income rising modestly from $279M to $282M. The company commands a higher gross margin of 24.2% and a net margin of 10.4%, signaling stronger pricing power. However, revenue and net income growth slowed over the period, with 2024 showing steady but less dynamic improvements compared to General Dynamics.
Scale and Margin: Growth Muscle vs. Margin Strength
General Dynamics outpaces BWXT in revenue and net income growth, showcasing robust scale expansion and rising profitability. BWXT holds a clear margin advantage, reflecting superior operational efficiency. For investors, General Dynamics offers a growth profile with improving margins, while BWXT appeals as a high-margin specialist with steadier earnings.
Financial Ratios Comparison
These vital ratios act as a diagnostic tool to expose the underlying fiscal health, valuation premiums, and capital efficiency of the companies compared below:
| Ratios | General Dynamics Corporation (GD) | BWX Technologies, Inc. (BWXT) |
|---|---|---|
| ROE | 16.4% | 26.1% |
| ROIC | 10.7% | 12.8% |
| P/E | 21.6 | 36.2 |
| P/B | 3.55 | 9.44 |
| Current Ratio | 1.44 | 1.96 |
| Quick Ratio | 0.89 | 1.88 |
| D/E | 0.31 | 0.98 |
| Debt-to-Assets | 14.0% | 36.8% |
| Interest Coverage | 17.1 | 9.64 |
| Asset Turnover | 0.92 | 0.94 |
| Fixed Asset Turnover | 6.98 | 2.12 |
| Payout ratio | 37.8% | 31.3% |
| Dividend yield | 1.75% | 0.87% |
| Fiscal Year | 2025 | 2024 |
Efficiency & Valuation Duel: The Vital Signs
Financial ratios serve as a company’s DNA, exposing hidden risks and highlighting operational excellence that raw numbers alone cannot reveal.
General Dynamics Corporation
General Dynamics shows a favorable ROE of 16.43% and ROIC of 10.66%, indicating efficient capital use. Its P/E of 21.58 is neutral, suggesting a fairly valued stock. The dividend yield of 1.75% provides steady shareholder returns, while a moderate P/B ratio of 3.55 flags some valuation caution.
BWX Technologies, Inc.
BWXT delivers a stronger ROE of 26.09% and ROIC of 12.79%, reflecting superior profitability. However, its P/E of 36.18 and P/B of 9.44 paint an expensive valuation picture. A low dividend yield of 0.87% signals limited immediate returns, with reinvestment likely fueling growth.
Premium Valuation vs. Operational Efficiency
BWXT commands a premium valuation driven by higher profitability but carries valuation risks. General Dynamics balances solid returns with a more reasonable price and modest dividends. Investors seeking growth may prefer BWXT’s profile, while those valuing income and valuation discipline might lean toward General Dynamics.
Which one offers the Superior Shareholder Reward?
I compare General Dynamics Corporation (GD) and BWX Technologies, Inc. (BWXT) by focusing on their dividend yields, payout ratios, and buyback intensity for 2025. GD yields a robust 1.75% with a 38% payout ratio, well-covered by free cash flow at 77%. BWXT’s yield lags at 0.87%, with a lower 31% payout ratio but a higher price-to-earnings ratio of 36. BWXT reinvests heavily, reflected in its lower free cash flow per share of 2.78 vs. GD’s 14.67. Both buy back shares, but GD’s mature payout and stronger free cash flow support a more sustainable model. I judge GD offers the superior total return profile in 2026 thanks to balanced dividends and disciplined capital allocation.
Comparative Score Analysis: The Strategic Profile
The radar chart reveals the fundamental DNA and trade-offs of General Dynamics Corporation and BWX Technologies, Inc., highlighting their financial strengths and vulnerabilities:
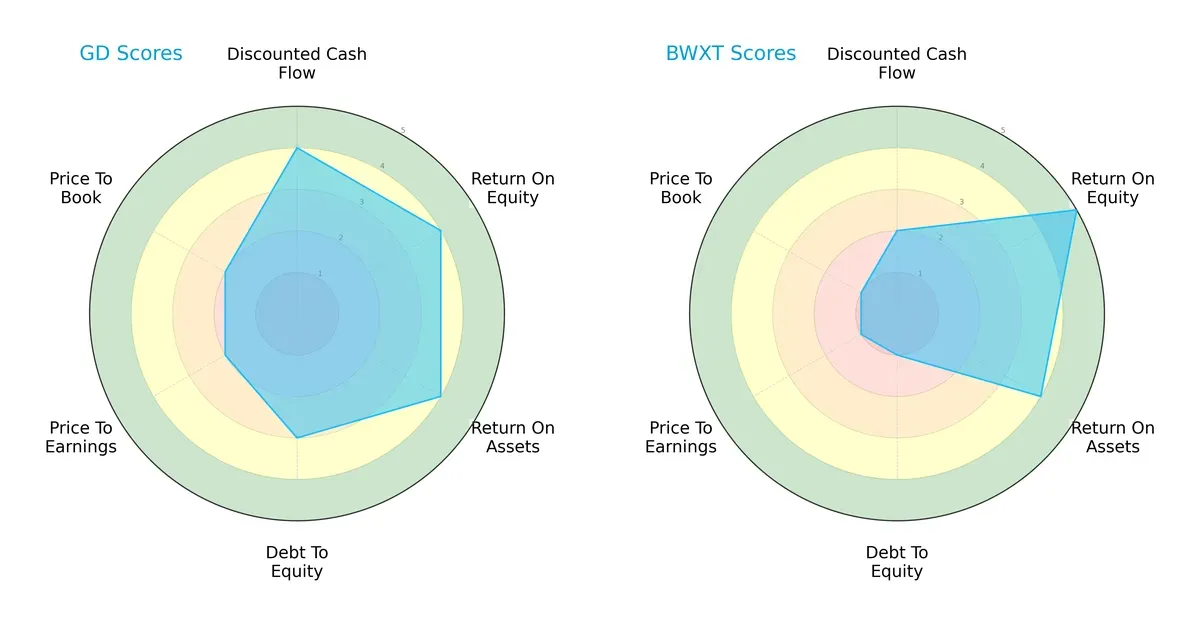
General Dynamics presents a balanced profile with favorable scores in DCF (4), ROE (4), ROA (4), and moderate debt-to-equity (3). BWX excels in ROE (5) and matches GD on ROA (4) but suffers from a weak debt-to-equity score (1) and poor valuation metrics (PE and PB at 1), indicating reliance on operational efficiency while bearing higher financial risk.
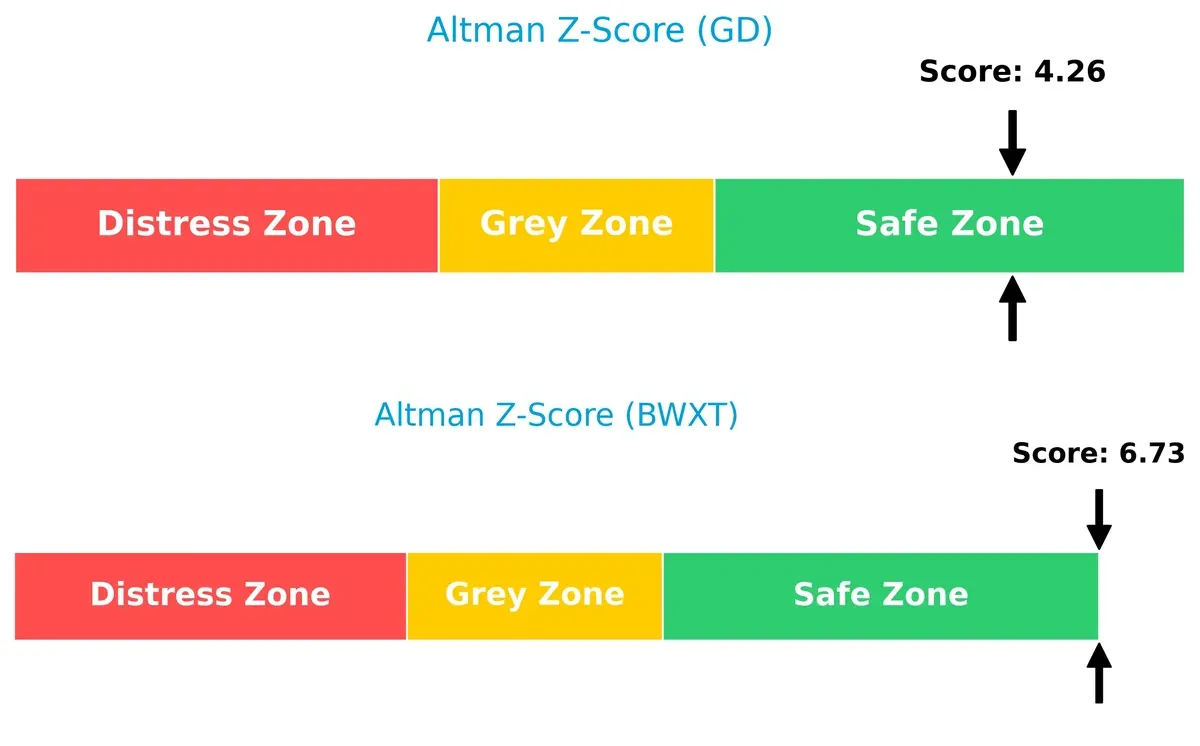
Bankruptcy Risk: Solvency Showdown
General Dynamics posts an Altman Z-Score of 4.26 versus BWX’s 6.73, both firmly in the safe zone, signaling robust solvency and low bankruptcy risk through this cycle:
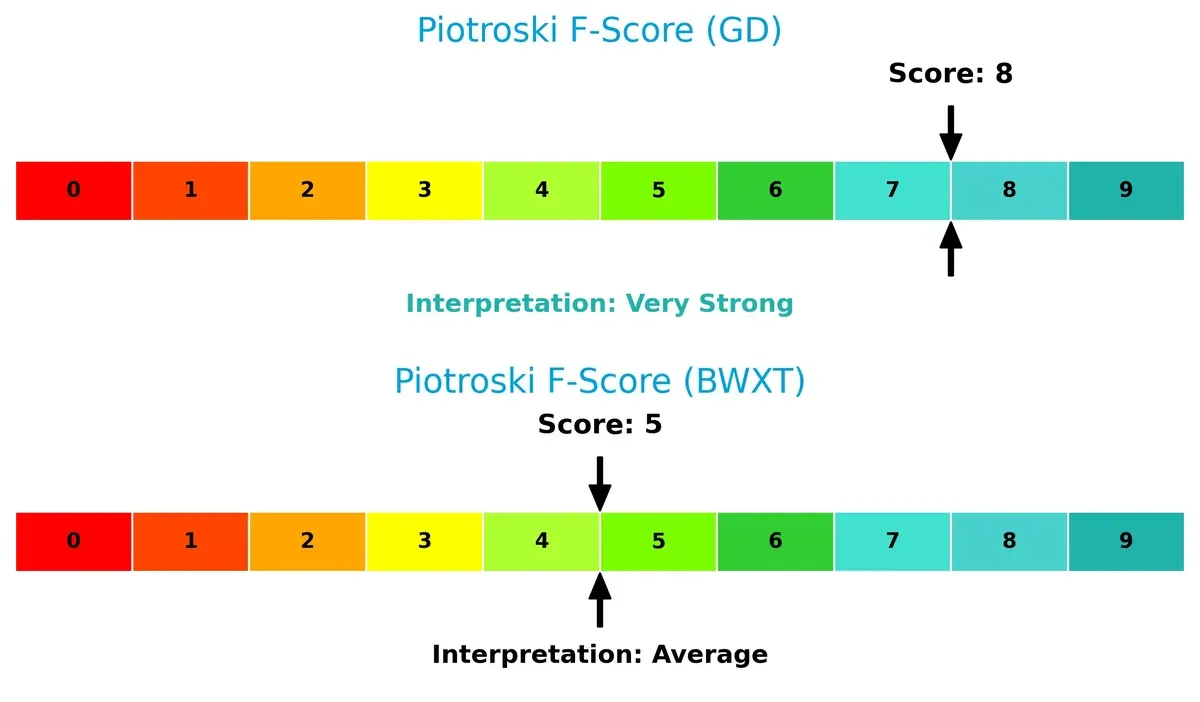
Financial Health: Quality of Operations
General Dynamics scores an 8 on the Piotroski F-Score, signaling very strong financial health. BWX’s score of 5 indicates average health with potential internal red flags relative to GD:
How are the two companies positioned?
This section dissects the operational DNA of GD and BWXT by comparing their revenue distribution by segment and analyzing their internal strengths and weaknesses. The ultimate goal is to confront their economic moats to identify which model offers the most resilient, sustainable competitive advantage today.
Revenue Segmentation: The Strategic Mix
The following visual comparison dissects how General Dynamics Corporation and BWX Technologies diversify their income streams and where their primary sector bets lie:
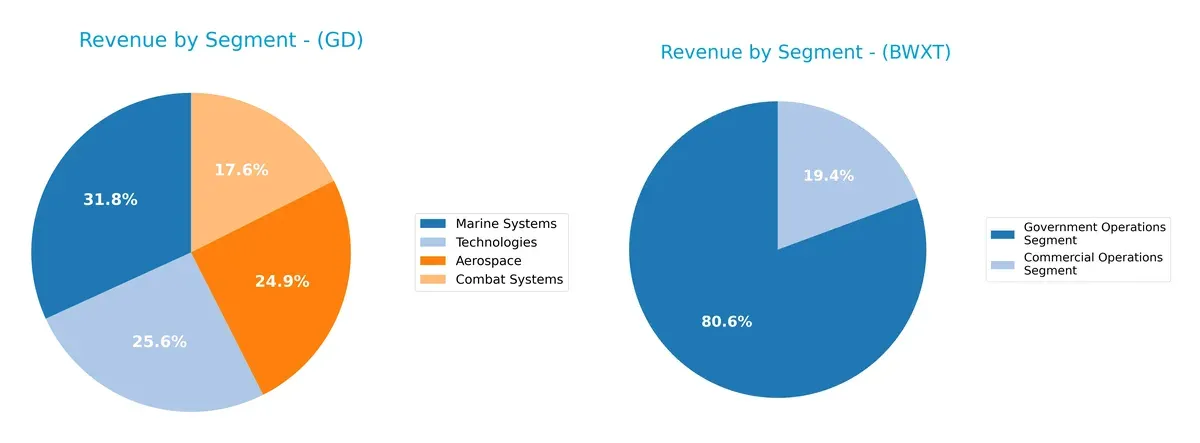
General Dynamics anchors its revenue with a balanced portfolio: Marine Systems leads at $16.7B, followed by Technologies at $13.5B, Aerospace at $13.1B, and Combat Systems at $9.2B. BWXT pivots heavily on its Government Operations Segment with $2.18B, while its Commercial Operations segment contributes just $524M. GD’s diversified mix reduces concentration risk; BWXT’s reliance on government contracts implies strong ecosystem lock-in but higher sector sensitivity.
Strengths and Weaknesses Comparison
This table compares the Strengths and Weaknesses of General Dynamics Corporation (GD) and BWX Technologies, Inc. (BWXT):
GD Strengths
- Diversified revenue across Aerospace, Combat, Marine, and Technologies
- Favorable ROE (16.43%) and ROIC (10.66%) above WACC (5.55%)
- Strong interest coverage (17.25) and low debt-to-assets (14%)
- Large global presence with significant North America and Europe sales
BWXT Strengths
- Higher profitability with net margin (10.43%) and ROE (26.09%) exceeding GD
- Favorable ROIC (12.79%) and interest coverage (9.83)
- Strong liquidity ratios (current 1.96, quick 1.88)
- Focused niche with solid government and commercial segments
GD Weaknesses
- Moderate net margin (8.01%) and neutral asset turnover (0.92)
- Unfavorable price-to-book ratio (3.55) suggests valuation concerns
- Neutral liquidity ratios with quick ratio below 1 (0.89)
- Less concentrated geographic focus mainly in North America
BWXT Weaknesses
- High valuation multiples: P/E (36.18) and P/B (9.44) considered unfavorable
- Higher debt-to-equity (0.98) and debt-to-assets (37%) increase leverage risk
- Lower dividend yield (0.87%) versus GD
- Limited product diversification mainly in nuclear operations
Both companies exhibit solid profitability and favorable capital efficiency metrics, but GD’s broad diversification contrasts with BWXT’s focused specialization. BWXT’s elevated valuation and leverage require cautious monitoring relative to GD’s more balanced financial profile.
The Moat Duel: Analyzing Competitive Defensibility
A structural moat is the only reliable barrier that protects long-term profits from relentless competitive erosion:
General Dynamics Corporation: Diversified Defense Powerhouse
General Dynamics leverages Intangible Assets and scale across aerospace, marine, and combat systems. Its very favorable ROIC above WACC confirms durable value creation with expanding profitability in 2026.
BWX Technologies, Inc.: Specialized Nuclear Component Leader
BWXT’s moat rests on cost advantage and specialized nuclear technology. Despite strong current ROIC, declining trends suggest margin pressure. Expansion into commercial nuclear markets could offer growth but risks intensify.
Industrial Scale vs. Specialized Precision: The Moat Showdown
General Dynamics boasts a wider and deepening moat through diversified defense segments and improving ROIC trends. BWXT creates value but faces shrinking profitability. GD is better positioned to defend market share.
Which stock offers better returns?
The stock prices of General Dynamics Corporation and BWX Technologies, Inc. showed distinct bullish trends over the past 12 months, with notable price appreciations and accelerating momentum.
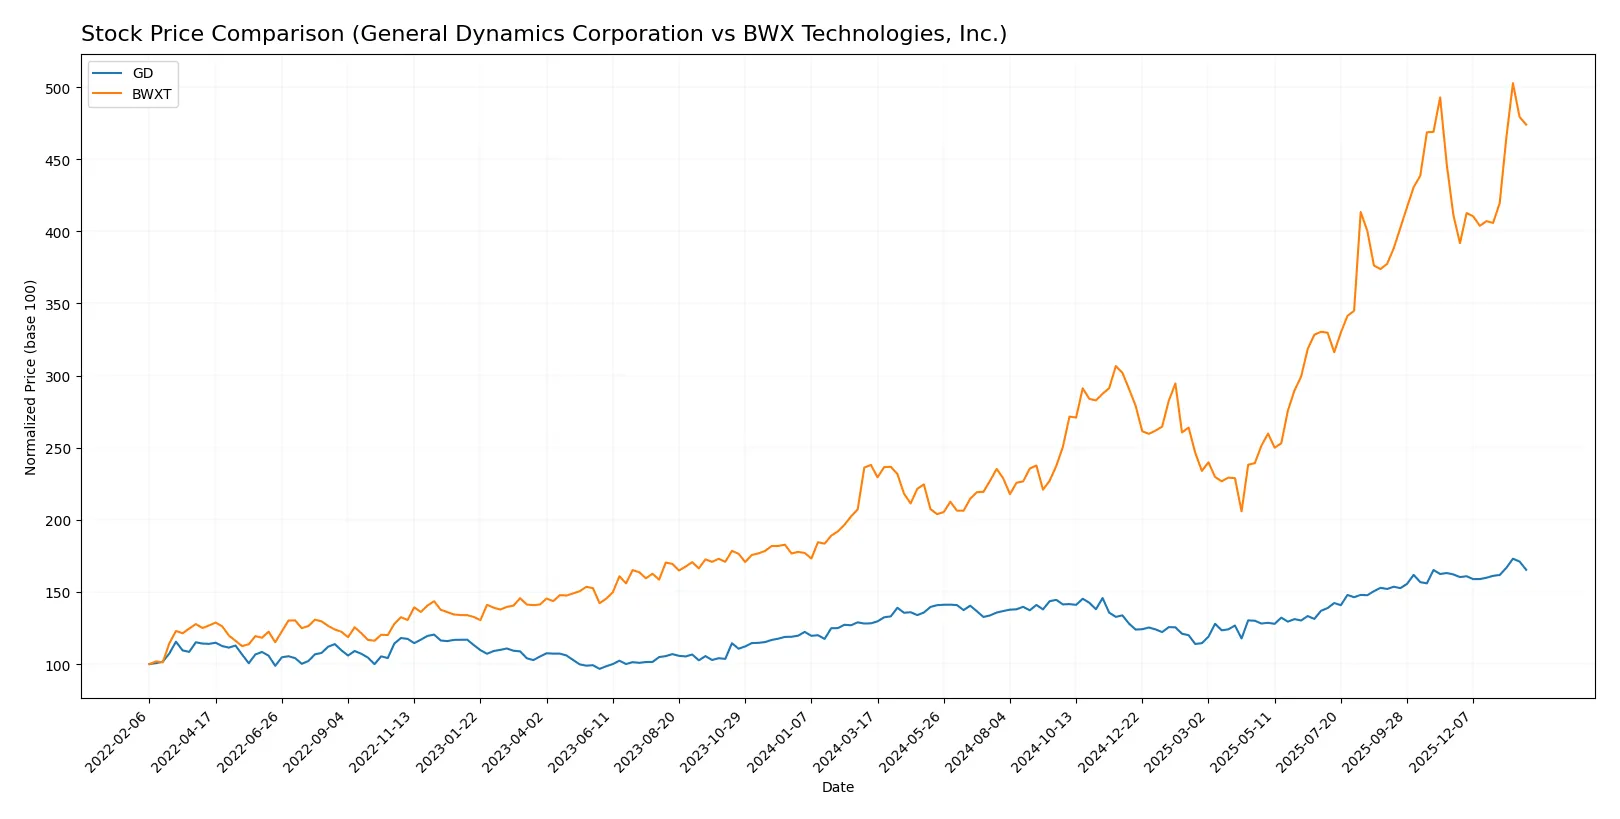
Trend Comparison
General Dynamics Corporation’s stock rose 28.93% over the past year, demonstrating a clear bullish trend with accelerating gains. Its price fluctuated between 241.94 and 367.38, reflecting moderate volatility (std dev 28.77).
BWX Technologies, Inc. outperformed with a 99.08% increase over the same period. The stock’s trend also accelerated, reaching highs of 217.89 from a low of 88.41, with higher volatility (std dev 36.35).
BWXT delivered the highest market performance, nearly tripling GD’s return. Both stocks gained, but BWXT’s stronger acceleration and larger percentage gain stand out.
Target Prices
Analysts show a positive target consensus for both General Dynamics Corporation and BWX Technologies, indicating potential upside from current prices.
| Company | Target Low | Target High | Consensus |
|---|---|---|---|
| General Dynamics Corporation | 390 | 444 | 406.63 |
| BWX Technologies, Inc. | 180 | 225 | 204 |
The target consensus for General Dynamics at 406.63 suggests a roughly 15.9% upside versus its current price of 351.09. BWXT’s consensus target at 204 aligns closely with its current price of 205.43, signaling limited near-term price appreciation.

Don’t Let Luck Decide Your Entry Point
Optimize your entry points with our advanced ProRealTime indicators. You’ll get efficient buy signals with precise price targets for maximum performance. Start outperforming now!
How do institutions grade them?
The following tables summarize recent institutional grades for General Dynamics Corporation and BWX Technologies, Inc.:
General Dynamics Corporation Grades
This table shows recent grades from established financial institutions for General Dynamics Corporation.
| Grading Company | Action | New Grade | Date |
|---|---|---|---|
| B of A Securities | Maintain | Buy | 2026-01-30 |
| UBS | Maintain | Neutral | 2026-01-15 |
| Citigroup | Maintain | Neutral | 2026-01-13 |
| JP Morgan | Maintain | Overweight | 2025-12-19 |
| Morgan Stanley | Upgrade | Overweight | 2025-12-16 |
| JP Morgan | Maintain | Overweight | 2025-10-28 |
| B of A Securities | Maintain | Buy | 2025-10-28 |
| Bernstein | Maintain | Market Perform | 2025-10-28 |
| UBS | Maintain | Neutral | 2025-10-27 |
| JP Morgan | Maintain | Overweight | 2025-10-27 |
BWX Technologies, Inc. Grades
This table shows recent grades from recognized financial firms for BWX Technologies, Inc.
| Grading Company | Action | New Grade | Date |
|---|---|---|---|
| Seaport Global | Downgrade | Neutral | 2026-01-20 |
| B of A Securities | Maintain | Buy | 2025-11-13 |
| BTIG | Maintain | Buy | 2025-11-07 |
| Truist Securities | Maintain | Hold | 2025-11-04 |
| Truist Securities | Maintain | Hold | 2025-10-15 |
| Deutsche Bank | Maintain | Hold | 2025-10-08 |
| B of A Securities | Maintain | Buy | 2025-08-13 |
| Deutsche Bank | Maintain | Hold | 2025-08-06 |
| Maxim Group | Downgrade | Hold | 2025-08-06 |
| Truist Securities | Maintain | Hold | 2025-08-05 |
Which company has the best grades?
General Dynamics receives more consistently positive grades, including multiple “Buy” and “Overweight” ratings. BWX Technologies shows a mix of “Buy,” “Hold,” and recent downgrades to “Neutral.” Investors may interpret General Dynamics’ steadier upgrades as a stronger institutional confidence signal.
Risks specific to each company
The following categories identify the critical pressure points and systemic threats facing both firms in the 2026 market environment:
1. Market & Competition
General Dynamics Corporation
- Well-diversified aerospace and defense segments support resilience against competition.
BWX Technologies, Inc.
- Specializes in nuclear components with niche, but limited diversification risks.
2. Capital Structure & Debt
General Dynamics Corporation
- Low debt-to-equity (0.31) and strong interest coverage reduce financial risk.
BWX Technologies, Inc.
- Higher debt-to-equity (0.98) and moderate coverage increase leverage concerns.
3. Stock Volatility
General Dynamics Corporation
- Low beta (0.414) signals less stock price volatility versus market.
BWX Technologies, Inc.
- Higher beta (0.852) indicates greater sensitivity to market swings.
4. Regulatory & Legal
General Dynamics Corporation
- Faces standard aerospace and defense regulatory scrutiny globally.
BWX Technologies, Inc.
- Nuclear industry exposure adds complex regulatory and compliance risks.
5. Supply Chain & Operations
General Dynamics Corporation
- Broad manufacturing footprint with established defense contracts supports operational stability.
BWX Technologies, Inc.
- Nuclear materials handling and precision manufacturing create operational complexity.
6. ESG & Climate Transition
General Dynamics Corporation
- Defense sector pressures for increased sustainability practices are emerging.
BWX Technologies, Inc.
- Nuclear focus presents both environmental challenges and low-carbon energy opportunities.
7. Geopolitical Exposure
General Dynamics Corporation
- Heavy reliance on U.S. defense budgets exposes it to government policy shifts.
BWX Technologies, Inc.
- Nuclear contracts and exports face significant geopolitical and trade risks.
Which company shows a better risk-adjusted profile?
General Dynamics’ strongest risk factor is geopolitical exposure due to its dependence on U.S. defense spending. BWX’s most significant risk lies in its leveraged capital structure and regulatory challenges from nuclear operations. Despite BWX’s higher profitability, General Dynamics offers a more balanced risk-adjusted profile, supported by a safer capital structure and lower stock volatility. The recent rise in BWX’s debt-to-equity ratio and its very unfavorable price-to-earnings and price-to-book ratios justify caution.
Final Verdict: Which stock to choose?
General Dynamics stands out with its durable competitive advantage, demonstrated by a steadily growing ROIC well above its cost of capital. Its superpower lies in efficient capital allocation and robust profitability, making it a reliable value creator. A point of vigilance remains its moderate valuation multiples, which could temper upside. It suits portfolios seeking steady growth with a margin of safety.
BWX Technologies commands a strategic moat through niche specialization and strong returns on equity. Its higher operational margins and liquidity ratios reflect solid financial health, though its premium valuation and rising debt levels introduce risk. Compared to General Dynamics, BWXT offers a more growth-oriented profile but with less margin of safety, fitting well in GARP or thematic growth portfolios.
If you prioritize durable value creation and financial discipline, General Dynamics outshines as a compelling choice due to its stable profitability and balanced capital structure. However, if you seek accelerated growth with a tolerance for valuation premium and leverage, BWX Technologies offers better momentum and higher returns on equity, albeit with elevated risks.
Disclaimer: Investment carries a risk of loss of initial capital. The past performance is not a reliable indicator of future results. Be sure to understand risks before making an investment decision.
Go Further
I encourage you to read the complete analyses of General Dynamics Corporation and BWX Technologies, Inc. to enhance your investment decisions: