Home > Comparison > Industrials > GE vs BWXT
The strategic rivalry between GE Aerospace and BWX Technologies, Inc. shapes the aerospace and defense sector’s evolution. GE Aerospace operates as a capital-intensive industrial giant, focusing on jet engines and integrated aircraft systems. In contrast, BWX Technologies specializes in precision nuclear components with a niche in naval and commercial nuclear power. This analysis pits broad industrial scale against specialized nuclear expertise to identify the superior risk-adjusted investment trajectory for diversified portfolios.
Table of contents
Companies Overview
GE Aerospace and BWX Technologies, Inc. both hold pivotal roles in the aerospace and defense sector, shaping technology and national security.
GE Aerospace: Engine Innovator and Systems Integrator
GE Aerospace dominates as a leading manufacturer of jet and turboprop engines for commercial and military aviation. It generates revenue primarily through engine sales and servicing across multiple aviation segments. In 2026, its strategic focus emphasizes expanding advanced propulsion technologies and integrated aircraft systems to maintain competitive edge.
BWX Technologies, Inc.: Nuclear Specialist for Defense and Power
BWX Technologies excels in designing and manufacturing nuclear components critical to U.S. naval propulsion and commercial nuclear power. Its revenue streams come from supplying reactors, fuel, and maintenance services. The company’s 2026 strategy centers on enhancing nuclear technologies and expanding operational services to meet rising defense and energy demands.
Strategic Collision: Similarities & Divergences
Both companies operate within aerospace and defense but serve distinct technological niches—propulsion engines versus nuclear components. Their competitive battleground lies in government contracts and technological innovation. GE Aerospace leans on broad aerospace integration, while BWX Technologies focuses on nuclear specialization, creating different risk and growth profiles for investors.
Income Statement Comparison
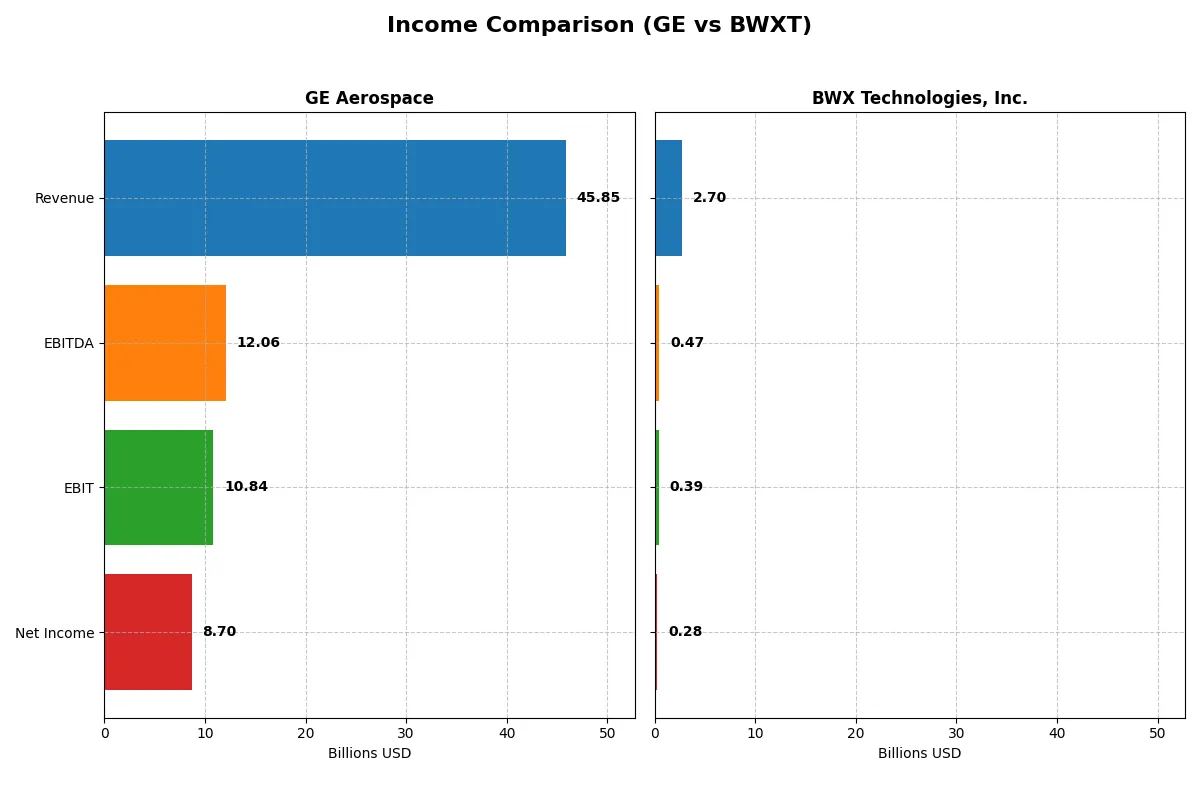
This data dissects the core profitability and scalability of both corporate engines to reveal who dominates the bottom line:
| Metric | GE Aerospace (GE) | BWX Technologies, Inc. (BWXT) |
|---|---|---|
| Revenue | 45.9B | 2.7B |
| Cost of Revenue | 28.97B | 2.05B |
| Operating Expenses | 8.12B | 275M |
| Gross Profit | 16.89B | 655M |
| EBITDA | 12.06B | 474M |
| EBIT | 10.84B | 388M |
| Interest Expense | 843M | 39M |
| Net Income | 8.70B | 282M |
| EPS | 8.16 | 3.08 |
| Fiscal Year | 2025 | 2024 |
Income Statement Analysis: The Bottom-Line Duel
This income statement comparison unveils the true efficiency and profitability of each corporate engine over recent years.
GE Aerospace Analysis
GE Aerospace shows a robust revenue rebound, reaching $45.9B in 2025, up 18% from 2024. Net income surged to $8.7B, reflecting solid margin improvement with a gross margin near 37% and net margin at 19%. The company’s EBIT margin expanded to 23.7%, signaling enhanced operational efficiency and strong momentum heading into 2026.
BWX Technologies, Inc. Analysis
BWXT steadily grew revenue to $2.7B in 2024, up 8% year-over-year, but with a lower gross margin of 24.2% and net margin of 10.4%. EBIT margin sits at 14.4%, indicating moderate operational leverage. While net income rose to $282M, growth in operating expenses slightly outpaced revenue, tempering efficiency gains.
Margin Power vs. Revenue Scale
GE Aerospace dominates with superior margins and accelerating net income growth, leveraging scale for strong profitability. BWXT’s consistent revenue growth contrasts with thinner margins and slower bottom-line expansion. For investors, GE’s profile offers a compelling combination of scale and margin improvement, while BWXT presents a steadier but less efficient earnings trajectory.
Financial Ratios Comparison
These vital ratios act as a diagnostic tool to expose the underlying fiscal health, valuation premiums, and capital efficiency of the companies compared below:
| Ratios | GE Aerospace (GE) | BWX Technologies, Inc. (BWXT) |
|---|---|---|
| ROE | 46.6% | 26.1% |
| ROIC | 8.1% | 12.8% |
| P/E | 37.8 | 36.2 |
| P/B | 17.6 | 9.4 |
| Current Ratio | 1.04 | 1.96 |
| Quick Ratio | 0.74 | 1.88 |
| D/E | 1.10 | 0.98 |
| Debt-to-Assets | 15.7% | 36.8% |
| Interest Coverage | 10.4 | 9.6 |
| Asset Turnover | 0.35 | 0.94 |
| Fixed Asset Turnover | 5.74 | 2.12 |
| Payout Ratio | 16.7% | 31.3% |
| Dividend Yield | 0.44% | 0.87% |
| Fiscal Year | 2025 | 2024 |
Efficiency & Valuation Duel: The Vital Signs
Financial ratios act as the company’s DNA, unveiling hidden risks and operational strengths that shape investor confidence and valuation.
GE Aerospace
GE Aerospace delivers a striking 46.6% ROE and a strong 19% net margin, signaling robust profitability. However, its high P/E of 37.8 and P/B of 17.6 mark the stock as stretched. Dividend yield at 0.44% disappoints, with limited shareholder returns suggesting reinvestment into growth and R&D.
BWX Technologies, Inc.
BWXT posts a solid 26.1% ROE and a 10.4% net margin, indicating efficient operations. Its P/E at 36.2 and P/B near 9.4 also appear pricey but less stretched than GE. BWXT supports shareholders with a 0.87% dividend yield, balancing returns while maintaining a strong liquidity position.
Premium Valuation vs. Operational Safety
GE Aerospace boasts superior profitability but at a comparatively stretched valuation and weaker liquidity. BWXT offers a better mix of operational efficiency, shareholder returns, and financial stability. Investors prioritizing growth might lean toward GE, while those valuing steady dividends and balance-sheet health may prefer BWXT.
Which one offers the Superior Shareholder Reward?
I compare GE Aerospace and BWX Technologies on dividends, payout ratios, and buybacks. GE yields 0.44%-0.56% with a conservative payout near 16%, supported by strong free cash flow coverage (85%). BWXT offers higher yields, around 0.87%-1.21%, but with payout ratios near 31%-35%, pushing more capital into dividends. Buybacks at GE are moderate, preserving cash for reinvestment, while BWXT shows stronger buyback intensity, enhancing shareholder value. GE’s distribution is sustainable given cash flow and lower leverage. BWXT’s aggressive payout and debt levels suggest higher risk. I find GE Aerospace offers a more balanced, sustainable total return profile in 2026.
Comparative Score Analysis: The Strategic Profile
The radar chart reveals the fundamental DNA and trade-offs of GE Aerospace and BWX Technologies, Inc., spotlighting their financial strengths and vulnerabilities:
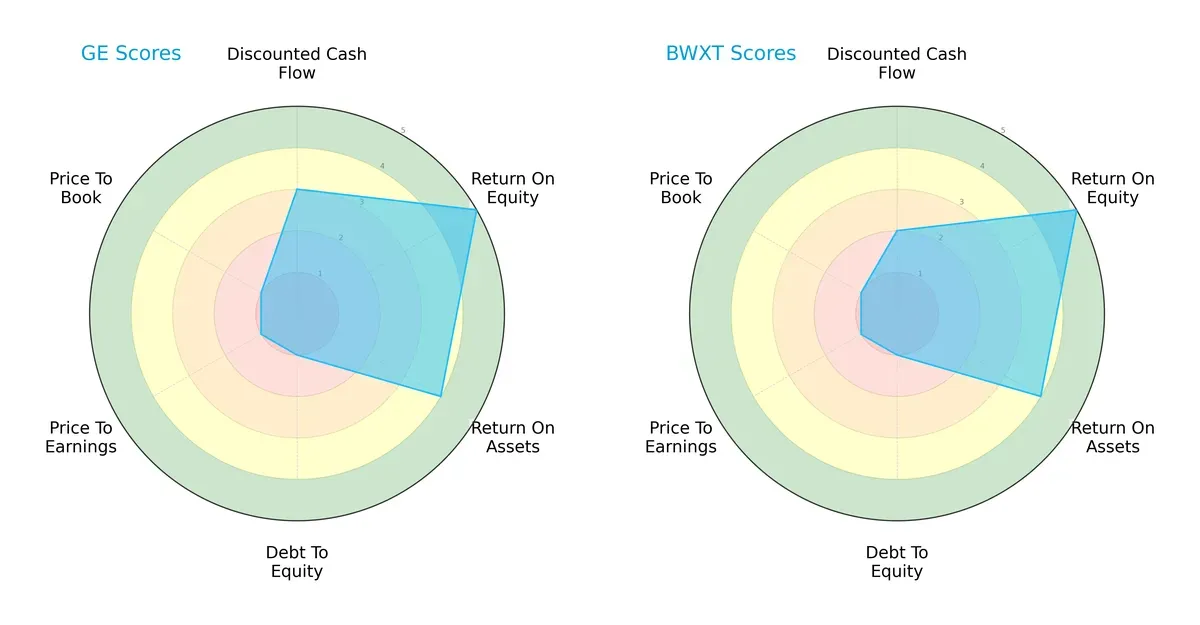
GE Aerospace delivers a more balanced profile with moderate DCF and robust ROE and ROA scores, but it struggles with heavy leverage and poor valuation metrics. BWX Technologies matches GE’s profitability but relies similarly on weak debt management and valuation, reflecting a narrower competitive edge.
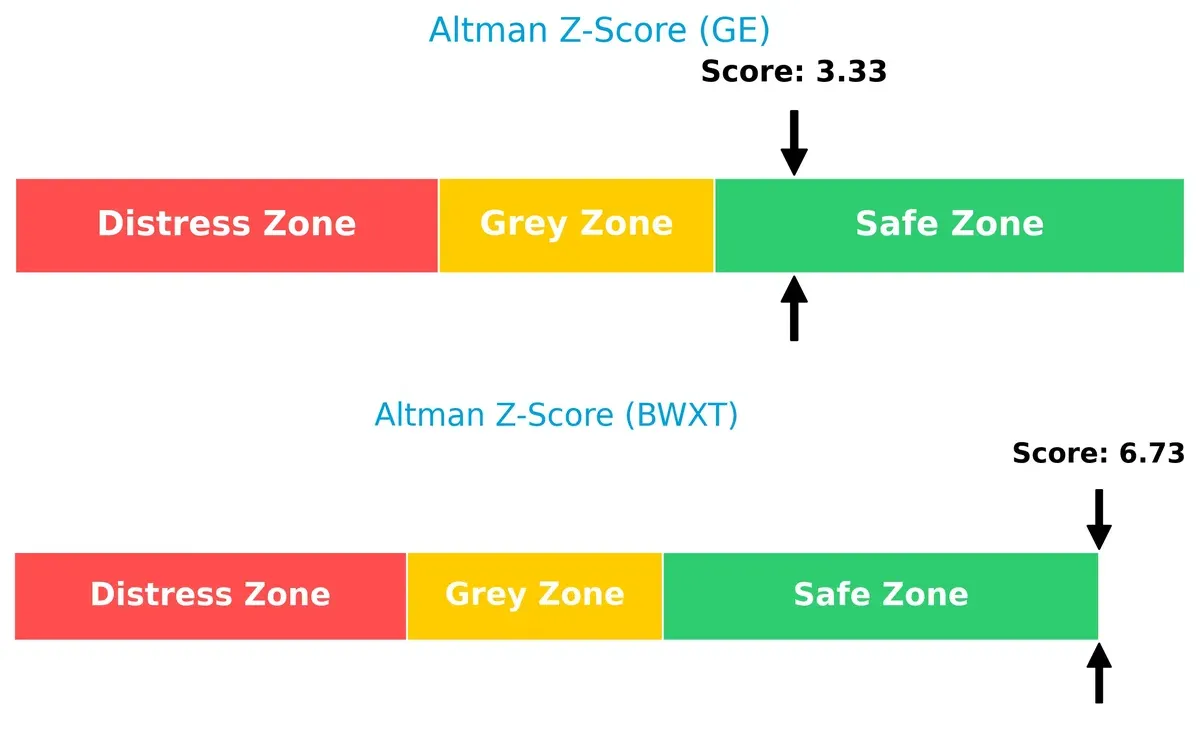
Bankruptcy Risk: Solvency Showdown
BWX Technologies’ Altman Z-Score of 6.73 far exceeds GE Aerospace’s 3.33, indicating a stronger solvency position and lower bankruptcy risk for BWXT in today’s market cycle:
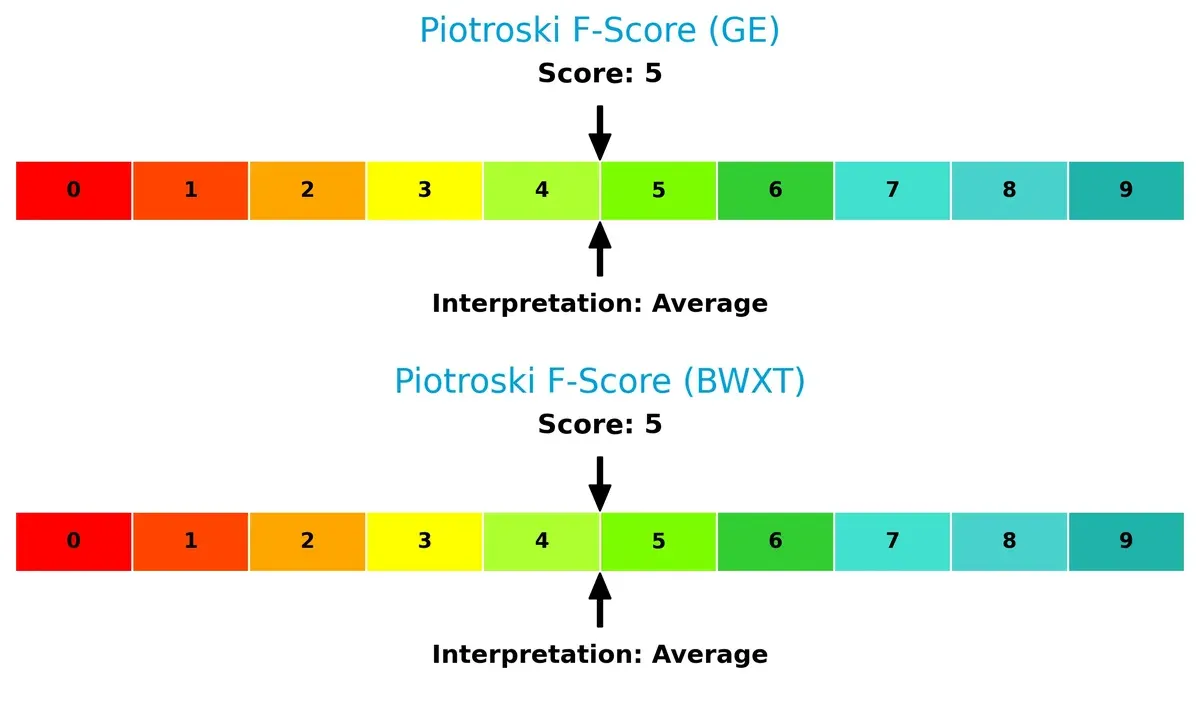
Financial Health: Quality of Operations
Both firms share an identical Piotroski F-Score of 5, signaling average financial health with no glaring red flags in operational efficiency or balance sheet quality compared to each other:
How are the two companies positioned?
This section dissects GE Aerospace and BWX Technologies’ operational DNA by comparing their revenue distribution and internal dynamics. It aims to confront their economic moats to reveal which model offers the most resilient competitive advantage today.
Revenue Segmentation: The Strategic Mix
This visual comparison dissects how GE Aerospace and BWX Technologies diversify their income streams and where their primary sector bets lie:
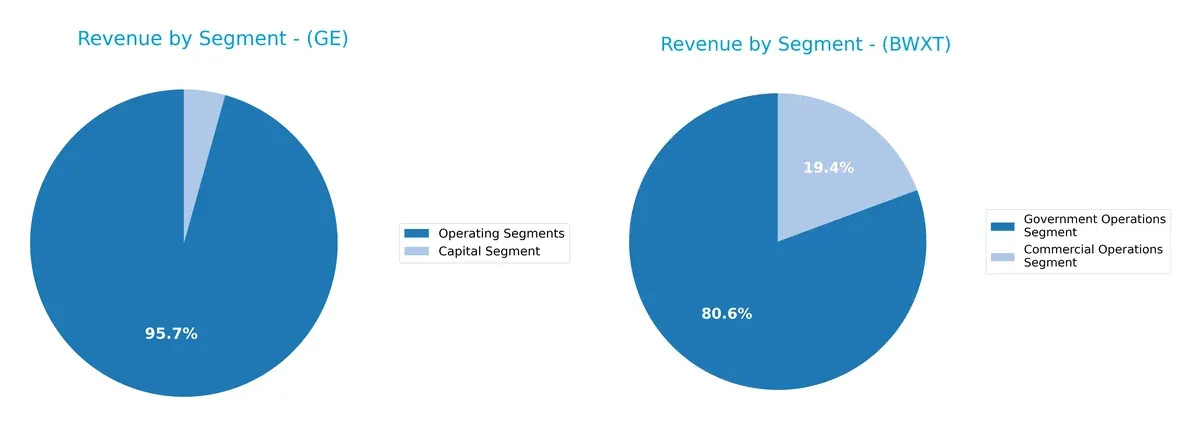
GE Aerospace presents a diversified portfolio anchored by its Aerospace Segment generating $31.8B in 2023, supported by Power ($17.7B) and Renewable Energy ($15B). BWX Technologies, in contrast, relies heavily on its Government Operations Segment, which dwarfs its Commercial Operations at $2.18B vs. $524M in 2024. GE’s broad mix suggests ecosystem lock-in and infrastructure dominance, while BWXT’s concentration signals dependence on government contracts and higher exposure to sector-specific risks.
Strengths and Weaknesses Comparison
This table compares the Strengths and Weaknesses of GE Aerospace and BWX Technologies, Inc.:
GE Aerospace Strengths
- Broad revenue diversification across Aerospace, Power, and Renewable Energy segments
- Strong global presence with significant revenue from US and Non-US markets
- High ROE at 46.6% indicating effective equity use
- Favorable net margin near 19% shows strong profitability
- Low debt-to-assets ratio at 15.74% reduces financial risk
BWX Technologies, Inc. Strengths
- Favorable ROIC of 12.79% exceeding WACC at 7.55%, showing efficient capital allocation
- Strong liquidity ratios: current ratio 1.96, quick ratio 1.88
- Solid global footprint mainly in US and Canada markets
- Favorable interest coverage at 9.83 demonstrates good debt servicing ability
- Balanced revenue from Government and Commercial operations
GE Aerospace Weaknesses
- Unfavorable valuation metrics: high P/E at 37.76 and P/B at 17.6
- Quick ratio below 1 at 0.74 signals potential short-term liquidity issues
- Debt-to-equity above 1.1 indicates elevated leverage
- Asset turnover low at 0.35 suggests less efficient asset use
- Dividend yield low at 0.44% may deter income-focused investors
BWX Technologies, Inc. Weaknesses
- Unfavorable valuation with P/E at 36.18 and P/B at 9.44
- Moderate debt-to-assets at 36.78% adds leverage risk
- Neutral asset turnover at 0.94 and fixed asset turnover at 2.12
- Dividend yield at 0.87% remains below typical market average
Both companies exhibit distinct strengths: GE Aerospace benefits from diversified operations and strong profitability metrics, while BWXT shows superior capital efficiency and liquidity. However, both face valuation headwinds and some leverage concerns, which investors should monitor relative to their risk tolerance and strategic goals.
The Moat Duel: Analyzing Competitive Defensibility
A durable structural moat protects long-term profits from relentless competitive pressure and market erosion. Here’s how two aerospace giants defend their turf:
GE Aerospace: Intangible Assets Powerhouse
GE Aerospace leverages deep engineering expertise and brand reputation, reflected in stable 19% net margins. Its expanding defense and commercial engine segments could either fortify or test this intangible asset moat in 2026.
BWX Technologies, Inc.: Cost Advantage Specialist
BWXT’s moat stems from specialized nuclear components and government contracts, driving a 10.4% net margin. Unlike GE’s broad portfolio, BWXT’s cost advantage faces margin pressure but could exploit nuclear power market growth ahead.
Intangible Assets vs. Cost Advantage: Who Holds the Stronger Moat?
GE’s intangible asset moat is broader, sustaining higher margins despite value destruction signs. BWXT creates value on cost but suffers declining profitability. GE is better positioned to defend market share long term.
Which stock offers better returns?
The past year shows strong price appreciation for both stocks, with distinct momentum phases and trading volume shifts influencing their trajectories.
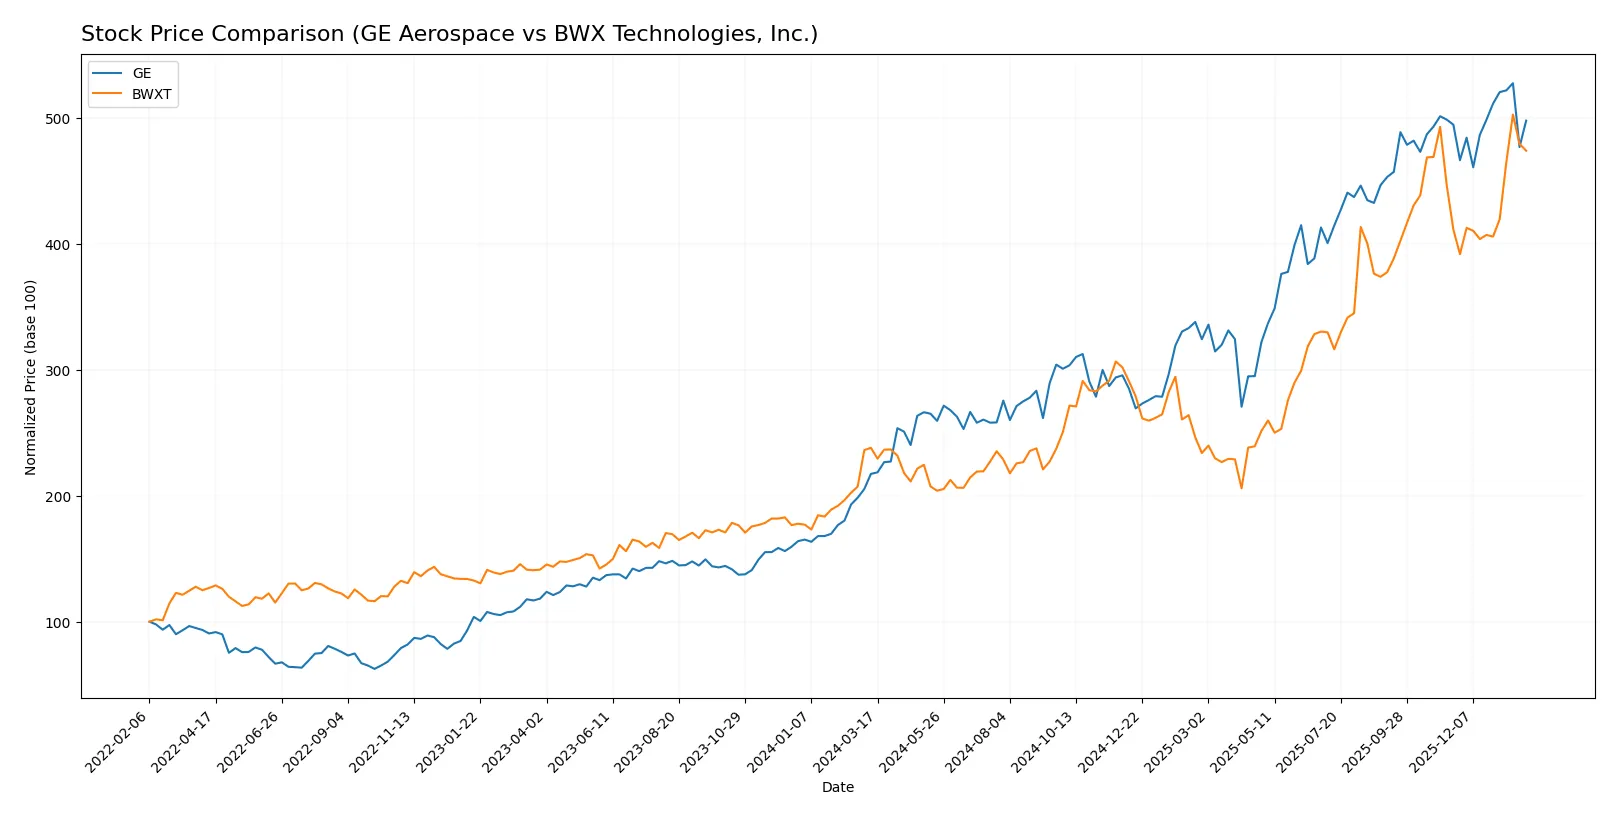
Trend Comparison
GE Aerospace’s stock surged 129.03% over the past 12 months, marking a bullish trend with decelerating momentum and high volatility. The price peaked at 325.12 and bottomed at 133.95.
BWX Technologies’ shares rose 99.08% in the same period, also bullish but accelerating. Volatility was lower than GE’s, with highs near 217.89 and lows around 88.41.
GE Aerospace outperformed BWX Technologies in total price gain over the year, despite slowing momentum, delivering the highest market return among the two.
Target Prices
Analysts present a confident target price consensus for GE Aerospace and BWX Technologies, reflecting solid upside potential.
| Company | Target Low | Target High | Consensus |
|---|---|---|---|
| GE Aerospace | 374 | 387 | 380.33 |
| BWX Technologies, Inc. | 180 | 225 | 204 |
The consensus target prices for GE Aerospace and BWX suggest 24% and 0.3% upside, respectively, versus current prices of 306.79 and 205.43. Analysts expect GE Aerospace to outperform, while BWX trades near its median target.

Don’t Let Luck Decide Your Entry Point
Optimize your entry points with our advanced ProRealTime indicators. You’ll get efficient buy signals with precise price targets for maximum performance. Start outperforming now!
How do institutions grade them?
The following tables summarize the latest institutional grades for GE Aerospace and BWX Technologies, Inc.:
GE Aerospace Grades
This table displays recent grades and recommendations from major financial institutions for GE Aerospace.
| Grading Company | Action | New Grade | Date |
|---|---|---|---|
| JP Morgan | Maintain | Overweight | 2026-01-26 |
| Citigroup | Maintain | Buy | 2026-01-23 |
| UBS | Maintain | Buy | 2026-01-23 |
| UBS | Maintain | Buy | 2026-01-15 |
| Citigroup | Maintain | Buy | 2026-01-13 |
| JP Morgan | Maintain | Overweight | 2025-10-27 |
| B of A Securities | Maintain | Buy | 2025-10-27 |
| UBS | Maintain | Buy | 2025-10-22 |
| RBC Capital | Maintain | Outperform | 2025-10-22 |
| Barclays | Maintain | Overweight | 2025-07-23 |
BWX Technologies, Inc. Grades
This table shows recent grades and changes from financial institutions for BWX Technologies, Inc.
| Grading Company | Action | New Grade | Date |
|---|---|---|---|
| Seaport Global | Downgrade | Neutral | 2026-01-20 |
| B of A Securities | Maintain | Buy | 2025-11-13 |
| BTIG | Maintain | Buy | 2025-11-07 |
| Truist Securities | Maintain | Hold | 2025-11-04 |
| Truist Securities | Maintain | Hold | 2025-10-15 |
| Deutsche Bank | Maintain | Hold | 2025-10-08 |
| B of A Securities | Maintain | Buy | 2025-08-13 |
| Deutsche Bank | Maintain | Hold | 2025-08-06 |
| Maxim Group | Downgrade | Hold | 2025-08-06 |
| Truist Securities | Maintain | Hold | 2025-08-05 |
Which company has the best grades?
GE Aerospace consistently holds strong institutional support, with multiple “Buy,” “Overweight,” and “Outperform” ratings maintained recently. BWX Technologies, Inc. shows a mix of “Buy,” “Hold,” and recent downgrades to “Neutral” and “Hold.” Investors may view GE Aerospace’s more favorable grades as indicative of higher confidence from analysts.
Risks specific to each company
The following categories identify critical pressure points and systemic threats facing GE Aerospace and BWX Technologies in the 2026 market environment:
1. Market & Competition
GE Aerospace
- Faces intense competition in commercial and military aerospace sectors, with pressure on innovation and service contracts.
BWX Technologies, Inc.
- Operates in a niche nuclear components market, reliant on government contracts but with fewer direct competitors.
2. Capital Structure & Debt
GE Aerospace
- High debt-to-equity ratio (1.1) signals financial leverage risk despite favorable interest coverage.
BWX Technologies, Inc.
- Moderate debt levels with a debt-to-equity ratio near 1.0, showing balanced leverage and strong liquidity ratios.
3. Stock Volatility
GE Aerospace
- Beta of 1.40 indicates above-market volatility, increasing risk in turbulent conditions.
BWX Technologies, Inc.
- Beta of 0.85 reflects lower volatility, offering relative stability amid market fluctuations.
4. Regulatory & Legal
GE Aerospace
- Exposed to stringent aerospace and defense regulations, including export controls and compliance risks.
BWX Technologies, Inc.
- Subject to nuclear regulatory scrutiny with possible operational delays and cost overruns from compliance demands.
5. Supply Chain & Operations
GE Aerospace
- Complex global supply chain vulnerable to geopolitical disruptions and raw material price swings.
BWX Technologies, Inc.
- More concentrated supply chain focused on nuclear materials, with risks tied to specialized suppliers and regulatory approvals.
6. ESG & Climate Transition
GE Aerospace
- Faces pressure to innovate cleaner engine technologies amid growing environmental regulations.
BWX Technologies, Inc.
- Operates in nuclear sector with ESG concerns around waste management and safety, but benefits from low-carbon energy demand.
7. Geopolitical Exposure
GE Aerospace
- Significant global footprint exposes it to trade tensions and export restrictions.
BWX Technologies, Inc.
- Primarily US-focused with some international presence, geopolitical risks tied to defense and nuclear policies.
Which company shows a better risk-adjusted profile?
BWX Technologies carries a more balanced capital structure and lower stock volatility, supporting a steadier risk profile. GE Aerospace’s higher leverage and market volatility raise caution. BWXT’s niche market and regulatory risks are offset by strong liquidity and safer Altman Z-Score, signaling better financial stability in 2026.
Final Verdict: Which stock to choose?
GE Aerospace’s superpower lies in its impressive profit engine and accelerating earnings growth. Its ability to generate high returns on equity signals operational strength. A point of vigilance remains its stretched valuation and moderate liquidity, which could pressure risk-averse investors. GE fits well in aggressive growth portfolios willing to navigate volatility for outsized gains.
BWX Technologies boasts a sturdy strategic moat through specialized nuclear technology and solid recurring contracts. Its financial safety profile surpasses GE’s with stronger liquidity and a more favorable debt structure. BWXT suits investors seeking GARP (Growth at a Reasonable Price), blending steady profitability with manageable risk.
If you prioritize rapid expansion and high return potential, GE Aerospace is the compelling choice due to its earnings momentum and operational leverage. However, if you seek better stability and a defensible niche in a complex industry, BWX Technologies offers superior financial resilience and a clearer moat. Both present distinct investment scenarios aligned with different risk appetites.
Disclaimer: Investment carries a risk of loss of initial capital. The past performance is not a reliable indicator of future results. Be sure to understand risks before making an investment decision.
Go Further
I encourage you to read the complete analyses of GE Aerospace and BWX Technologies, Inc. to enhance your investment decisions: