Home > Comparison > Consumer Defensive > TSN vs BG
The strategic rivalry between Tyson Foods, Inc. and Bunge Global S.A. shapes the competitive landscape of the agricultural farm products sector. Tyson operates as a capital-intensive food processor specializing in meat products, while Bunge focuses on agribusiness with diversified operations in oilseeds, grains, and bioenergy. This analysis evaluates whether Tyson’s integrated protein processing or Bunge’s commodity-driven model offers superior risk-adjusted returns for a diversified portfolio in 2026.
Table of contents
Companies Overview
Tyson Foods and Bunge Global dominate the agricultural farm products sector with distinct yet impactful business models.
Tyson Foods, Inc.: Protein Powerhouse
Tyson Foods stands as a leading global food company specializing in beef, pork, chicken, and prepared foods. Its core revenue derives from processing live cattle and hogs into fresh and value-added meat products. In 2026, Tyson emphasizes expanding its product portfolio in ready-to-eat and frozen foods to capture changing consumer demands and improve market penetration.
Bunge Global S.A.: Agribusiness Integrator
Bunge Global operates as a diversified agribusiness and food company focused on oilseed processing, grain trading, milling, and bioenergy. It generates revenue by purchasing and processing agricultural commodities into oils, meals, flours, and sugar products. Its 2026 strategy prioritizes enhancing supply chain efficiency and scaling bioenergy production to meet sustainability goals and evolving food industry trends.
Strategic Collision: Similarities & Divergences
Both companies are entrenched in agricultural supply chains but pursue different value creation models. Tyson focuses on downstream meat processing and branded consumer foods, whereas Bunge excels in upstream commodity trading and ingredient production. Their primary battleground lies in serving food manufacturers versus direct retail and foodservice channels. This contrast defines Tyson’s consumer-facing risk profile versus Bunge’s commodity-driven exposure.
Income Statement Comparison
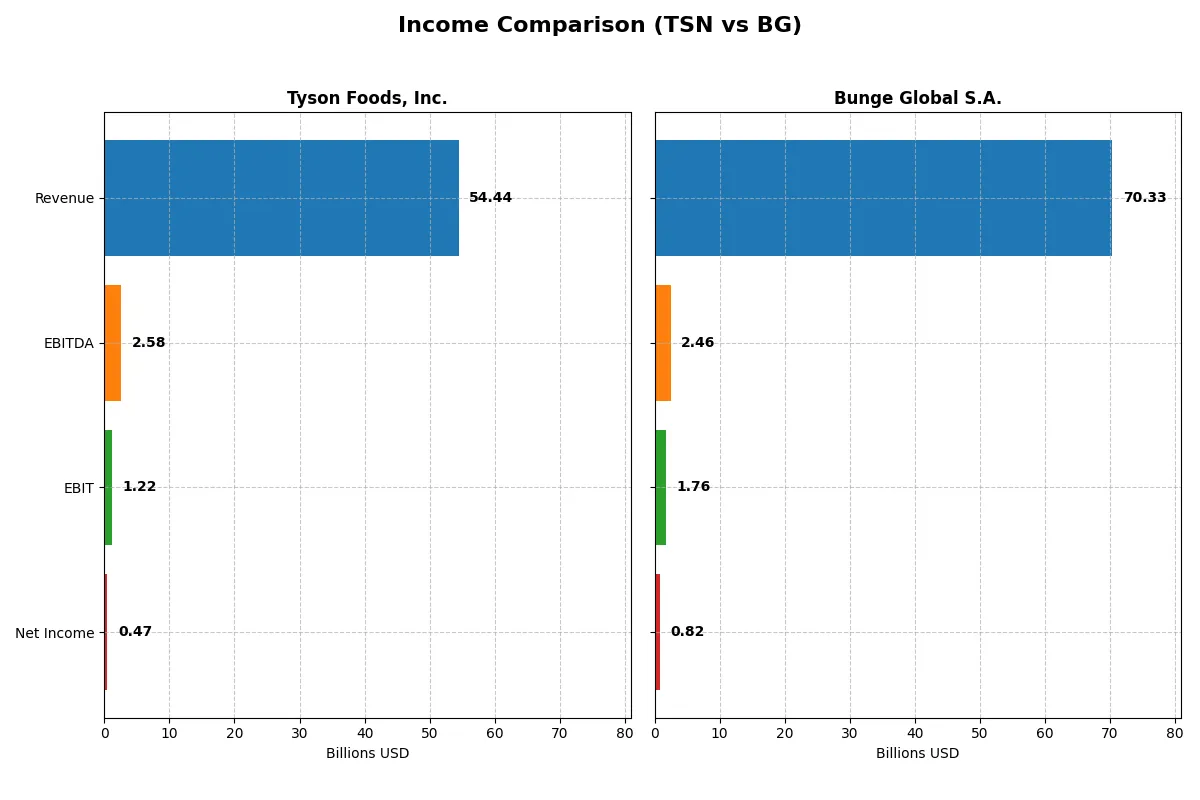
This data dissects the core profitability and scalability of both corporate engines to reveal who dominates the bottom line:
| Metric | Tyson Foods, Inc. (TSN) | Bunge Global S.A. (BG) |
|---|---|---|
| Revenue | 54.4B | 70.3B |
| Cost of Revenue | 50.9B | 66.9B |
| Operating Expenses | 2.12B | 2.11B |
| Gross Profit | 3.56B | 3.41B |
| EBITDA | 2.58B | 2.47B |
| EBIT | 1.22B | 1.76B |
| Interest Expense | 449M | 628M |
| Net Income | 474M | 816M |
| EPS | 1.36 | 4.91 |
| Fiscal Year | 2025 | 2025 |
Income Statement Analysis: The Bottom-Line Duel
This income statement comparison reveals how efficiently each company converts revenue into profit, exposing their true operational strengths and weaknesses.
Tyson Foods, Inc. Analysis
Tyson Foods’ revenue grew modestly to $54.4B in 2025, but net income plunged to $474M, reflecting margin pressure. Its gross margin dipped slightly to 6.54%, and net margin contracted to 0.87%, signaling weakened profitability. Despite stable revenue, earnings momentum faltered sharply, with EBIT down 22.6% year-over-year, indicating operational efficiency challenges.
Bunge Global S.A. Analysis
Bunge Global’s revenue surged 32% to $70.3B in 2025, showcasing robust top-line growth. Gross margin held steady near 4.85%, while net margin slipped to 1.16%. EBIT fell 11.7%, reflecting some margin compression amid expansion. The company’s net income decreased to $816M, revealing difficulties in translating revenue gains into sustained profit growth.
Margin Resilience vs. Revenue Expansion
Tyson Foods exhibits weak earnings despite steady revenues, struggling with margin erosion and profitability decline. Bunge Global capitalizes on significant revenue growth but faces margin and net income setbacks. Bunge’s profile appeals more to growth-focused investors, while Tyson’s margin struggles caution those prioritizing profitability stability.
Financial Ratios Comparison
These vital ratios act as a diagnostic tool to expose the underlying fiscal health, valuation premiums, and capital efficiency of the companies compared below:
| Ratios | Tyson Foods, Inc. (TSN) | Bunge Global S.A. (BG) |
|---|---|---|
| ROE | 2.62% | 4.70% |
| ROIC | 3.05% | 2.74% |
| P/E | 39.79 | 18.12 |
| P/B | 1.04 | 0.85 |
| Current Ratio | 1.55 | 1.61 |
| Quick Ratio | 0.66 | 0.74 |
| D/E | 0.49 | 0.98 |
| Debt-to-Assets | 24.09% | 38.07% |
| Interest Coverage | 3.21 | 2.06 |
| Asset Turnover | 1.49 | 1.58 |
| Fixed Asset Turnover | 5.91 | 5.26 |
| Payout ratio | 147.05% | 56.25% |
| Dividend yield | 3.70% | 3.10% |
| Fiscal Year | 2025 | 2025 |
Efficiency & Valuation Duel: The Vital Signs
Financial ratios act as the company’s DNA, exposing hidden risks and revealing operational strengths critical for investors’ decisions.
Tyson Foods, Inc.
Tyson shows weak profitability with a 2.62% ROE and razor-thin 0.87% net margin, signaling operational challenges. Its high P/E of 39.8 suggests an expensive valuation relative to earnings. The firm maintains a solid 3.7% dividend yield, rewarding shareholders while balancing favorable leverage and liquidity metrics.
Bunge Global S.A.
Bunge posts a higher ROE at 4.7% and a slightly better net margin of 1.16%, but still below ideal thresholds. Its P/E ratio of 18.1 is more reasonable, reflecting a neutral valuation stance. Bunge also offers a 3.1% dividend yield, supported by moderate debt levels and favorable asset turnover ratios.
Balanced Risk with Valuation Discipline
Tyson’s expensive valuation contrasts with weaker profitability, while Bunge presents better returns at a more moderate price. Bunge’s profile suits investors seeking operational efficiency with controlled risk. Tyson appeals to those prioritizing steady dividend income despite stretched valuation.
Which one offers the Superior Shareholder Reward?
I compare Tyson Foods (TSN) and Bunge Global (BG) by distribution strategy, dividend yield, payout ratios, and buyback intensity. TSN delivers a 3.7% dividend yield with a high 147% payout ratio, supported by solid free cash flow of 3.4B. BG yields 3.1%, with a modest 56% payout but negative free cash flow (-5.6B) due to heavy capex. TSN maintains consistent buybacks enhancing total returns, while BG’s weaker cash flow limits buyback scope. I see TSN’s dividend and buyback model as more sustainable and rewarding in 2026, offering superior shareholder return potential.
Comparative Score Analysis: The Strategic Profile
The radar chart reveals the fundamental DNA and trade-offs of Tyson Foods, Inc. and Bunge Global S.A., highlighting their financial strengths and vulnerabilities:
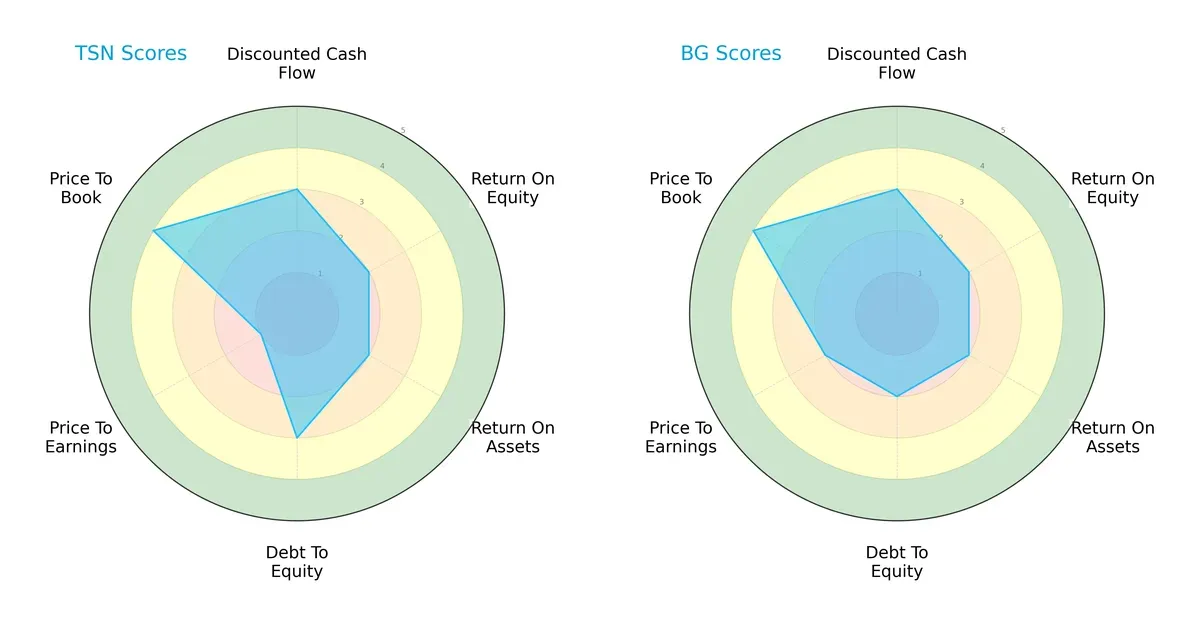
Both firms share moderate discounted cash flow scores, indicating similar valuation outlooks. Tyson edges out with a stronger debt-to-equity profile (3 vs. 2), signaling better leverage control. Both lag on return on equity and assets (2 each), reflecting operational challenges. Tyson’s weak price-to-earnings score (1) contrasts with Bunge’s slightly better rating (2), suggesting valuation concerns. Tyson’s higher price-to-book score (4) implies greater market confidence in its asset base. Overall, Tyson presents a more balanced profile with prudent debt management, while Bunge relies more on valuation metrics.
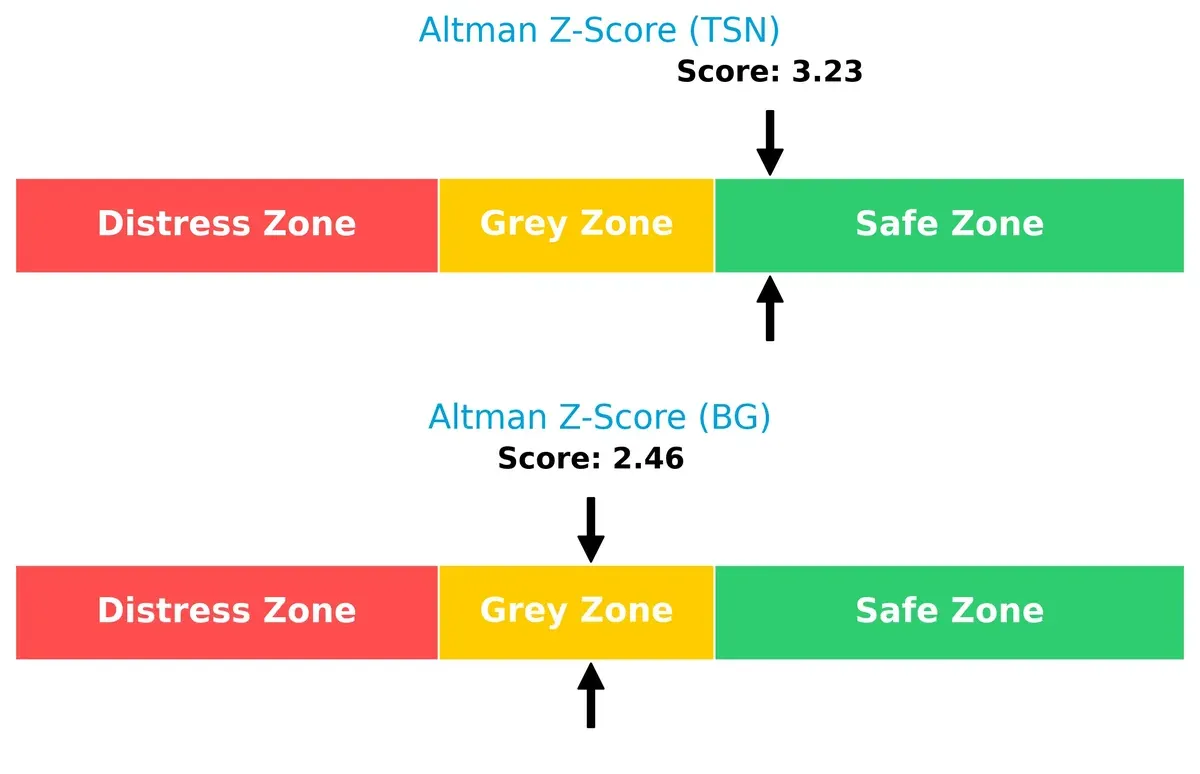
Bankruptcy Risk: Solvency Showdown
Tyson’s Altman Z-Score of 3.23 places it safely above Bunge’s 2.46, implying stronger long-term survival prospects in this uncertain market cycle:
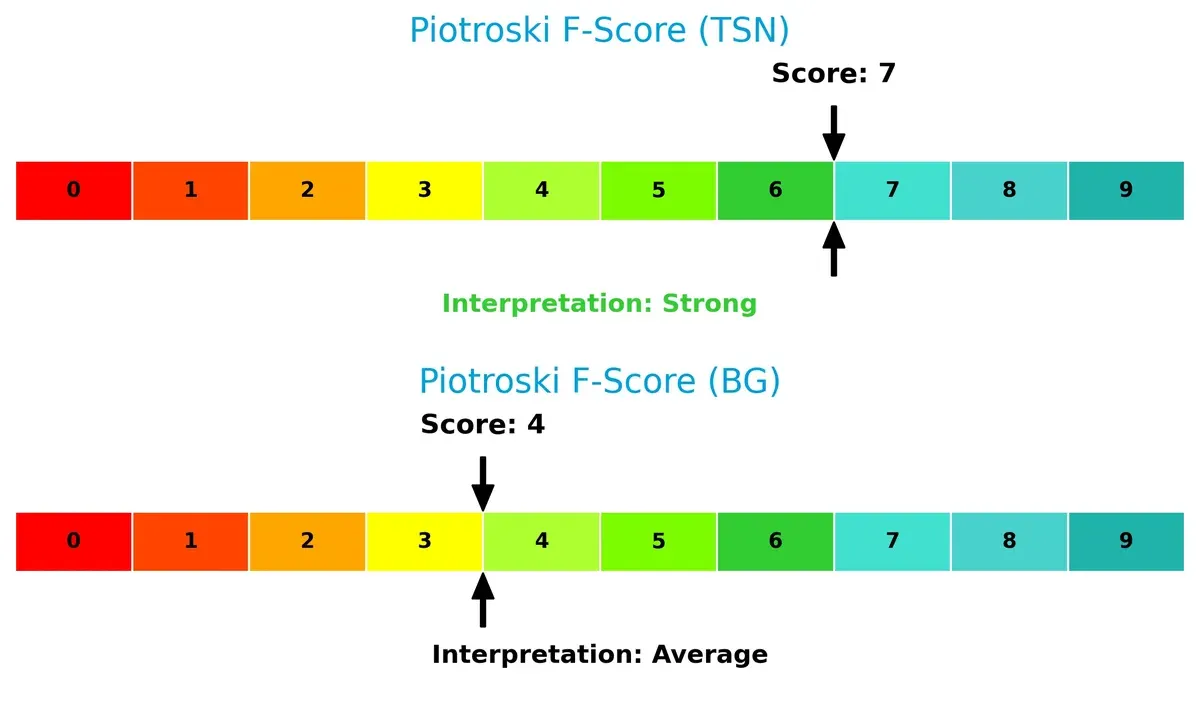
Financial Health: Quality of Operations
Tyson’s Piotroski F-Score of 7 signals robust financial health and operational quality, overshadowing Bunge’s average score of 4, which raises caution on internal financial metrics:
How are the two companies positioned?
This section dissects the operational DNA of Tyson Foods and Bunge Global by comparing their revenue distribution and internal dynamics. The goal is to confront their economic moats to reveal which model offers the most resilient competitive advantage today.
Revenue Segmentation: The Strategic Mix
The following visual comparison dissects how Tyson Foods, Inc. and Bunge Global S.A. diversify their income streams and highlights where their primary sector bets lie:
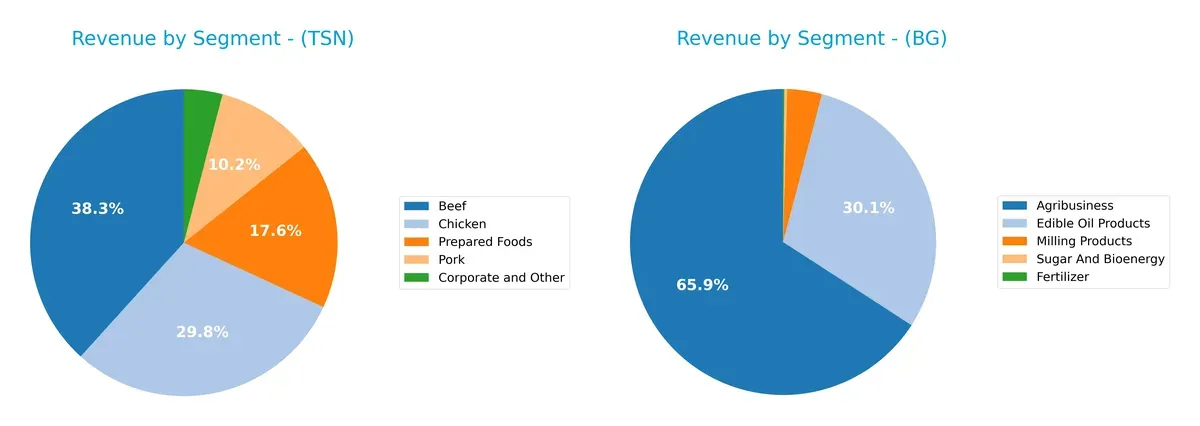
Tyson Foods leans on a balanced portfolio across Beef ($21.6B), Chicken ($16.8B), Prepared Foods ($9.9B), and Pork ($5.8B). This diversity cushions against volatility in any single protein market. In contrast, Bunge Global anchors its revenue heavily in Agribusiness ($27.9B) and Edible Oil Products ($12.8B), showing concentration risks but also deep ecosystem dominance in agricultural commodities and processing infrastructure. Tyson’s approach reduces sector risk; Bunge’s focuses on scale and market control.
Strengths and Weaknesses Comparison
This table compares the strengths and weaknesses of Tyson Foods, Inc. and Bunge Global S.A.:
Tyson Foods Strengths
- Diversified product portfolio with Beef, Chicken, Pork, and Prepared Foods
- Favorable current and quick ratios indicate liquidity
- Strong asset and fixed asset turnover ratios
- Dividend yield at 3.7% offers income
Bunge Global Strengths
- Broad geographic presence across Europe, Americas, and Asia Pacific
- Favorable current ratio and asset turnover
- Lower price-to-book ratio at 0.85
- Dividend yield at 3.1% supports shareholder returns
Tyson Foods Weaknesses
- Low net margin at 0.87%, below sector standards
- Unfavorable ROE and ROIC, indicating weak profitability
- High P/E ratio at 39.79 suggests overvaluation risk
- Quick ratio below 1 signals potential short-term liquidity concerns
Bunge Global Weaknesses
- Unfavorable net margin and ROIC highlight profitability challenges
- Debt-to-equity ratio near 1 indicates high leverage risk
- Quick ratio below 1 shows liquidity constraints
- Neutral interest coverage suggests limited debt service cushion
Tyson excels in operational efficiency and product diversification but struggles with profitability and valuation concerns. Bunge enjoys a broad global footprint and solid liquidity but faces profitability pressure and higher financial leverage. Both companies must address profitability and liquidity challenges to enhance strategic resilience.
The Moat Duel: Analyzing Competitive Defensibility
A structural moat is the only lasting barrier protecting long-term profits from relentless competition erosion. Let’s dissect the moats of Tyson Foods and Bunge Global:
Tyson Foods, Inc.: Scale and Brand-Driven Cost Advantage
Tyson leverages massive scale and integrated operations to control costs and maintain stable margins despite industry headwinds. However, declining ROIC signals rising pressure on its cost advantage in 2026.
Bunge Global S.A.: Global Agribusiness Network Effects
Bunge’s moat rests on its vast global supply chain and commodity processing network, which drives revenue growth. Yet, its shrinking ROIC warns that operational efficiency must improve to sustain this lead.
Scale Cost Advantage vs. Global Network Effects
Both firms face value destruction with declining ROICs, but Tyson’s entrenched cost advantage offers a deeper moat than Bunge’s network, which hinges on complex global supply chains. Tyson is better positioned to defend market share through scale economies despite current profitability challenges.
Which stock offers better returns?
The past year shows strong upward price trends for both stocks, with notable acceleration in recent months and distinct trading volume dynamics influencing their market behavior.
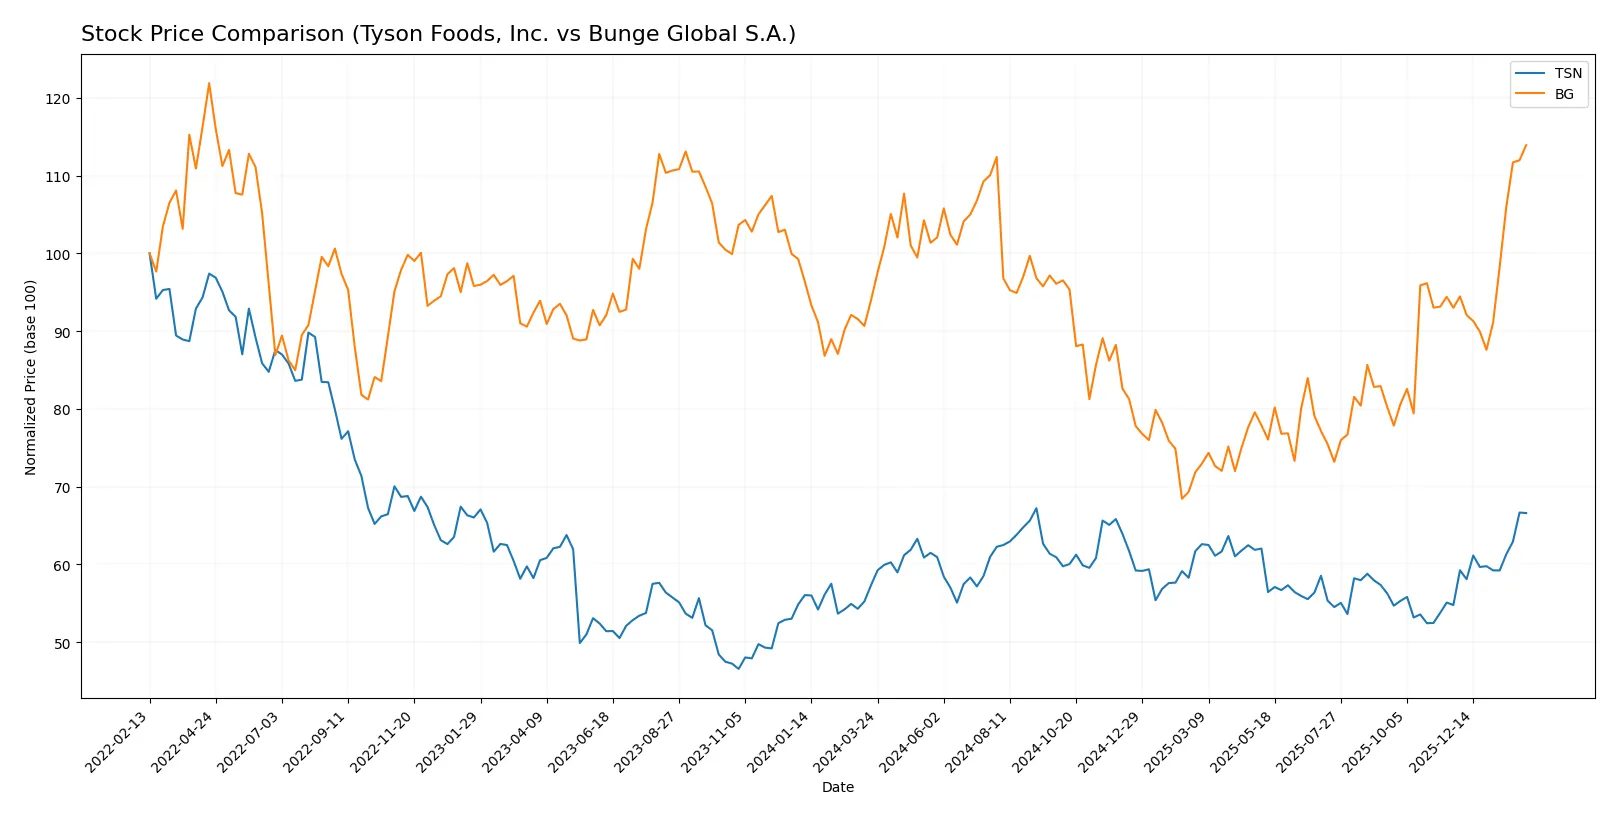
Trend Comparison
Tyson Foods, Inc. (TSN) posted a 16.22% price gain over 12 months, confirming a bullish trend with accelerating momentum and moderate volatility (3.3 std deviation). Its recent three-month rise accelerated further by 21.59%.
Bunge Global S.A. (BG) achieved a 21.24% price increase over the same 12-month period, also bullish with acceleration but higher volatility (12.2 std deviation). The recent quarterly gain of 22.5% showed even stronger upward momentum.
Bunge Global outperformed Tyson Foods in total price appreciation and recent momentum, despite bearing greater volatility, delivering the highest market performance among the two stocks.
Target Prices
Analysts provide a constructive outlook on Tyson Foods, Inc. and Bunge Global S.A., with target prices suggesting upside potential.
| Company | Target Low | Target High | Consensus |
|---|---|---|---|
| Tyson Foods, Inc. | 61 | 78 | 70.25 |
| Bunge Global S.A. | 95 | 145 | 120.33 |
The consensus targets for Tyson Foods and Bunge Global exceed current prices by 7.7% and 3.9%, respectively, indicating moderate growth expectations from analysts.

Don’t Let Luck Decide Your Entry Point
Optimize your entry points with our advanced ProRealTime indicators. You’ll get efficient buy signals with precise price targets for maximum performance. Start outperforming now!
How do institutions grade them?
The following tables summarize the recent institutional grades for Tyson Foods, Inc. and Bunge Global S.A.:
Tyson Foods, Inc. Grades
The table below shows recent grades from leading financial institutions for Tyson Foods, Inc.:
| Grading Company | Action | New Grade | Date |
|---|---|---|---|
| JP Morgan | maintain | Neutral | 2026-02-03 |
| BMO Capital | maintain | Outperform | 2026-02-03 |
| Barclays | maintain | Overweight | 2026-02-03 |
| BMO Capital | upgrade | Outperform | 2026-01-08 |
| Piper Sandler | maintain | Neutral | 2025-12-12 |
| BMO Capital | maintain | Market Perform | 2025-11-11 |
| B of A Securities | maintain | Neutral | 2025-10-08 |
| Bernstein | downgrade | Market Perform | 2025-07-23 |
| JP Morgan | maintain | Neutral | 2025-05-06 |
| Stephens & Co. | maintain | Equal Weight | 2025-05-06 |
Bunge Global S.A. Grades
Below are recent grades from reputable financial institutions for Bunge Global S.A.:
| Grading Company | Action | New Grade | Date |
|---|---|---|---|
| JP Morgan | maintain | Overweight | 2026-02-05 |
| Barclays | maintain | Overweight | 2026-02-05 |
| UBS | maintain | Buy | 2026-02-05 |
| Morgan Stanley | maintain | Overweight | 2026-02-05 |
| JP Morgan | maintain | Overweight | 2026-01-21 |
| Morgan Stanley | upgrade | Overweight | 2025-12-16 |
| B of A Securities | maintain | Buy | 2025-12-02 |
| Barclays | upgrade | Overweight | 2025-11-06 |
| Barclays | maintain | Equal Weight | 2025-10-21 |
| Stephens & Co. | maintain | Overweight | 2025-10-17 |
Which company has the best grades?
Bunge Global S.A. consistently receives higher grades, including multiple “Overweight” and “Buy” ratings. Tyson Foods, Inc. mostly holds “Neutral” to “Outperform” grades. Higher grades for Bunge suggest stronger institutional confidence, potentially influencing investor perception and demand.
Risks specific to each company
The following categories identify critical pressure points and systemic threats facing Tyson Foods, Inc. and Bunge Global S.A. in the 2026 market environment:
1. Market & Competition
Tyson Foods, Inc. (TSN)
- Faces intense competition in meat processing and prepared foods with pressure on margins.
Bunge Global S.A. (BG)
- Competes in global commodity trading and processing, exposed to volatile agricultural markets.
2. Capital Structure & Debt
Tyson Foods, Inc. (TSN)
- Maintains moderate debt levels with a favorable debt-to-equity ratio of 0.49 and 24% debt-to-assets.
Bunge Global S.A. (BG)
- Higher leverage with debt-to-equity near 1.0 and 38% debt-to-assets, increasing financial risk.
3. Stock Volatility
Tyson Foods, Inc. (TSN)
- Exhibits low stock volatility with beta at 0.465, indicating relative stability.
Bunge Global S.A. (BG)
- Shows moderate volatility with beta at 0.754, more sensitive to market swings.
4. Regulatory & Legal
Tyson Foods, Inc. (TSN)
- Subject to strict food safety and environmental regulations in meat processing.
Bunge Global S.A. (BG)
- Faces regulatory scrutiny on commodity trading, bioenergy production, and international trade policies.
5. Supply Chain & Operations
Tyson Foods, Inc. (TSN)
- Relies on live cattle and hog supply; vulnerable to livestock disease outbreaks and feed costs.
Bunge Global S.A. (BG)
- Dependent on global grain and oilseed supply chains, exposed to weather disruptions and transport bottlenecks.
6. ESG & Climate Transition
Tyson Foods, Inc. (TSN)
- Faces pressure to reduce carbon footprint and improve animal welfare standards.
Bunge Global S.A. (BG)
- Invests in bioenergy and sustainable agriculture but must manage deforestation and emissions concerns.
7. Geopolitical Exposure
Tyson Foods, Inc. (TSN)
- Primarily US-focused but exposed to export market volatility and trade tensions.
Bunge Global S.A. (BG)
- Operates globally, with significant exposure to geopolitical risks affecting commodity flows and tariffs.
Which company shows a better risk-adjusted profile?
Tyson Foods’ strongest risk is concentrated in supply chain vulnerabilities related to livestock and regulatory pressures on food safety. Bunge’s most significant risk stems from its higher leverage and complex global supply chain exposure. Tyson’s lower beta and stronger Altman Z-Score (3.23 vs. 2.46) indicate a safer financial footing. Despite Bunge’s investments in bioenergy, its average Piotroski score and elevated debt caution me. Tyson Foods shows a more favorable risk-adjusted profile, supported by stable liquidity and lower financial risk in 2026.
Final Verdict: Which stock to choose?
Tyson Foods, Inc. (TSN) showcases a superpower in operational efficiency and solid asset turnover, reflecting disciplined capital management despite a challenging profitability landscape. Its declining ROIC and cautious income trends are points of vigilance. TSN suits investors with an appetite for turnaround stories and aggressive growth bets.
Bunge Global S.A. (BG) benefits from a strategic moat rooted in its diversified global agri-commodities platform and relatively steadier income growth. Its safety profile appears more balanced than TSN’s, with a moderate valuation and stronger liquidity. BG fits well within GARP portfolios seeking growth with measured risk.
If you prioritize operational efficiency and potential value creation through restructuring, TSN outshines as a compelling choice despite its risks. However, if you seek better stability and strategic diversification, BG offers superior resilience and a more conservative risk-return profile. Each stock caters to distinct investor avatars navigating the complex agribusiness landscape.
Disclaimer: Investment carries a risk of loss of initial capital. The past performance is not a reliable indicator of future results. Be sure to understand risks before making an investment decision.
Go Further
I encourage you to read the complete analyses of Tyson Foods, Inc. and Bunge Global S.A. to enhance your investment decisions: