Home > Comparison > Consumer Defensive > BG vs SFD
The strategic rivalry between Bunge Global S.A. and Smithfield Foods Inc. shapes the agricultural farm products sector’s future. Bunge operates as a diversified agribusiness with global commodity processing and bioenergy, while Smithfield focuses on packaged meats and integrated hog production. This analysis pits Bunge’s capital-intensive supply chain against Smithfield’s consumer-focused model. I will determine which trajectory offers superior risk-adjusted returns for a diversified portfolio navigating sector cyclicality and evolving consumer demands.
Table of contents
Companies Overview
Bunge Global S.A. and SMITHFIELD FOODS INC are key players in the agricultural products market, each commanding distinct niches.
Bunge Global S.A.: Global Agribusiness Powerhouse
Bunge Global S.A. dominates the agribusiness and food sectors through commodity trading and processing. Its core revenue stems from purchasing, storing, transporting, and selling oilseeds, grains, and specialty oils globally. In 2026, the company emphasizes expanding its sugar and bioenergy segment, blending traditional agriculture with renewable energy production.
SMITHFIELD FOODS INC: Leading Packaged Meats Producer
Smithfield Foods Inc. specializes in manufacturing and marketing packaged meats and fresh pork across the U.S. and international markets. Its revenue mainly derives from processing fresh hogs into various meat products and bioscience operations. In 2026, Smithfield focuses on optimizing its hog production farms and expanding export markets, leveraging strong brand portfolios.
Strategic Collision: Similarities & Divergences
While both operate in agricultural products, Bunge pursues a commodity-driven, vertically integrated agribusiness model, contrasting Smithfield’s focus on branded packaged meats and animal farming. Their main battleground lies in global food supply chains and consumer demand for protein and oils. Investors face distinct profiles: Bunge offers exposure to commodity cycles and energy diversification, whereas Smithfield leans on branded consumer staples and operational scale.
Income Statement Comparison
This data dissects the core profitability and scalability of both corporate engines to reveal who dominates the bottom line:
| Metric | Bunge Global S.A. (BG) | SMITHFIELD FOODS INC (SFD) |
|---|---|---|
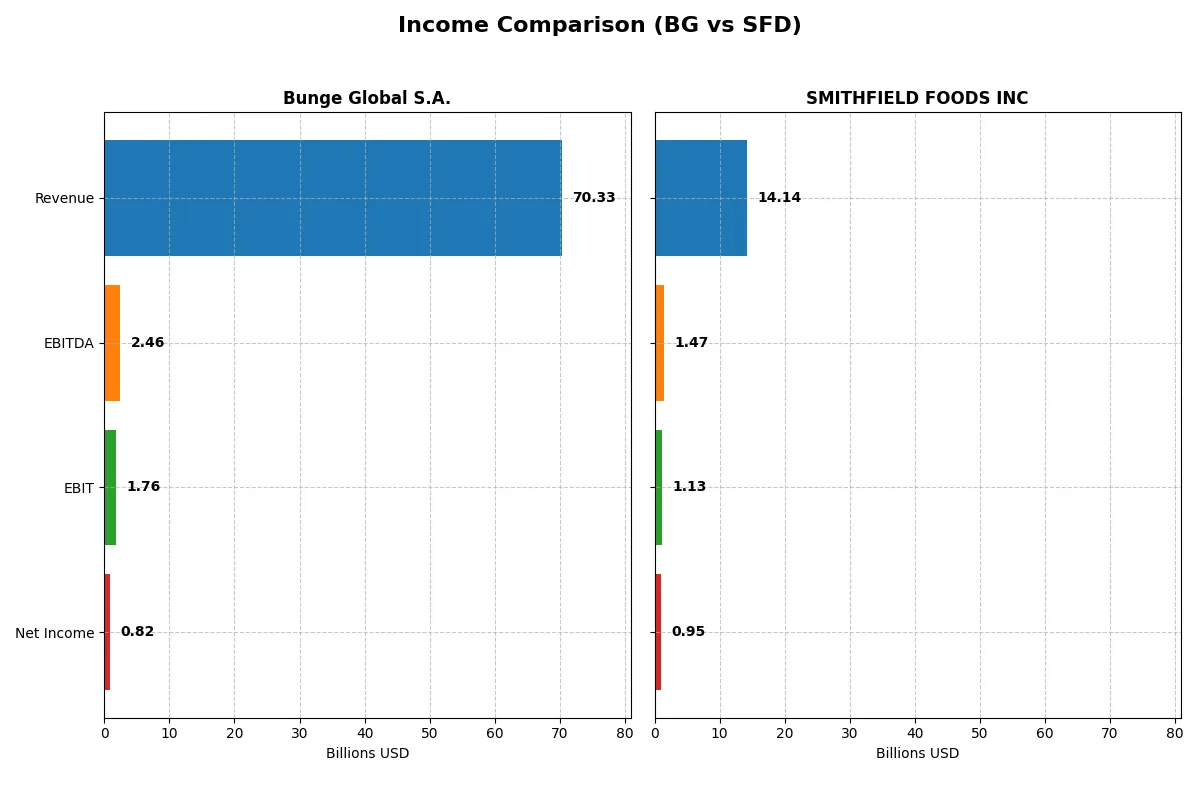
| Revenue | 70.3B | 14.1B |
| Cost of Revenue | 66.9B | 12.2B |
| Operating Expenses | 2.11B | 780M |
| Gross Profit | 3.41B | 1.90B |
| EBITDA | 2.47B | 1.47B |
| EBIT | 1.76B | 1.13B |
| Interest Expense | 628M | 66M |
| Net Income | 816M | 953M |
| EPS | 4.91 | 2.42 |
| Fiscal Year | 2025 | 2024 |
Income Statement Analysis: The Bottom-Line Duel
This income statement comparison exposes which company operates with superior efficiency and profitability under shifting market conditions.
Bunge Global S.A. Analysis
Bunge Global’s revenue rose sharply by 32% in 2025, reaching $70.3B, yet net income dropped 28% to $816M. Its gross margin held steady near 4.85%, but net margin contracted sharply to 1.16%. Despite revenue momentum, profitability and EPS declined significantly, signaling pressure on operational efficiency.
SMITHFIELD FOODS INC Analysis
Smithfield Foods posted $14.1B in 2024 revenue, down 3.4% year-over-year, but net income surged to $953M, a 5,503% jump driven by margin expansion. Gross margin doubled to 13.4%, and net margin improved to 6.74%. The company’s sharp rebound in earnings reflects strong cost control and operational leverage despite softer top-line growth.
Margin Resilience vs. Revenue Expansion
Smithfield’s robust margin improvement and earnings growth contrast with Bunge’s revenue-driven but margin-compressed performance. While Bunge scales revenues impressively, it struggles to convert sales into profits. Smithfield’s profile suits investors favoring margin stability and earnings momentum over top-line expansion alone.
Financial Ratios Comparison
These vital ratios act as a diagnostic tool to expose the underlying fiscal health, valuation premiums, and capital efficiency of the companies compared below:
| Ratios | Bunge Global S.A. (BG) | SMITHFIELD FOODS INC (SFD) |
|---|---|---|
| ROE | 4.7% | 16.3% |
| ROIC | 2.7% | 8.9% |
| P/E | 18.1 | 9.97 |
| P/B | 0.85 | 1.63 |
| Current Ratio | 1.61 | 2.46 |
| Quick Ratio | 0.74 | 1.05 |
| D/E (Debt to Equity) | 0.98 | 0.40 |
| Debt-to-Assets | 38.1% | 21.3% |
| Interest Coverage | 2.06 | 16.94 |
| Asset Turnover | 1.58 | 1.28 |
| Fixed Asset Turnover | 5.26 | 4.03 |
| Payout ratio | 56.3% | 30.2% |
| Dividend yield | 3.10% | 3.03% |
| Fiscal Year | 2025 | 2024 |
Efficiency & Valuation Duel: The Vital Signs
Financial ratios act as a company’s DNA, uncovering hidden risks and operational strengths vital for investors.
Bunge Global S.A.
Bunge Global posts a low 4.7% ROE and slim 1.16% net margin, signaling weak profitability. The P/E ratio at 18.12 suggests a fairly valued stock, while a 3.1% dividend yield rewards shareholders steadily. However, reinvestment appears limited, reflecting a cautious growth approach amid moderate operational efficiency.
SMITHFIELD FOODS INC
Smithfield Foods delivers a robust 16.34% ROE and solid 6.74% net margin, reflecting efficient profit generation. Its P/E ratio at 9.97 indicates an attractive valuation relative to earnings. The company supports shareholder returns through a 3.03% dividend yield and maintains strong financial health, underpinning sustained operational effectiveness and growth potential.
Balanced Profitability Meets Valuation Strength
Smithfield Foods leads with superior profitability and a more attractive valuation, signaling better operational efficiency. Bunge Global offers a modest yield but weaker returns and reinvestment. Investors seeking growth and strong returns may prefer Smithfield, while those prioritizing stability and dividends might consider Bunge.
Which one offers the Superior Shareholder Reward?
I compare Bunge Global S.A. (BG) and SMITHFIELD FOODS INC (SFD) based on dividends, payout ratios, and buybacks. BG yields around 3.48% with a conservative 33% payout, supported by solid free cash flow. SFD offers a slightly lower 3.03% yield but maintains a 30% payout ratio. BG’s buyback intensity is modest but consistent, enhancing total return sustainably. SFD’s capital allocation favors steady dividends and moderate buybacks, but its higher debt and lower free cash flow coverage raise sustainability concerns. I find BG’s balanced distribution and free cash flow strength deliver a superior total shareholder reward in 2026.
Comparative Score Analysis: The Strategic Profile
The radar chart reveals the fundamental DNA and trade-offs of Bunge Global S.A. and SMITHFIELD FOODS INC, highlighting their financial strengths and vulnerabilities:
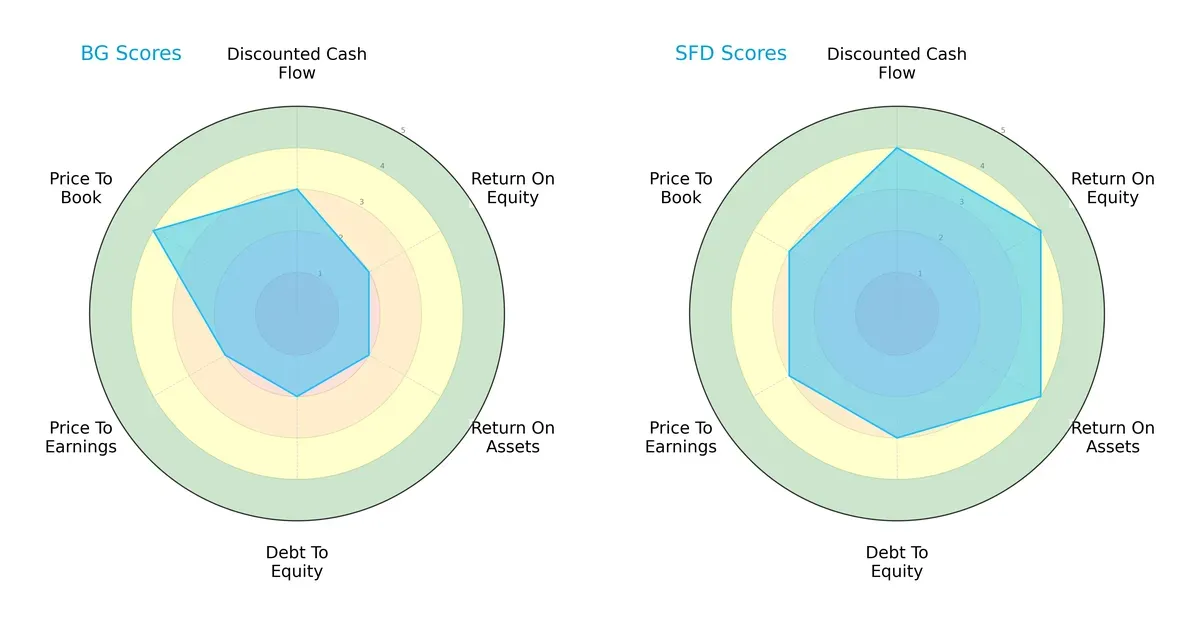
SMITHFIELD FOODS INC (SFD) presents a stronger, more balanced profile with favorable scores in DCF, ROE, and ROA, indicating efficient capital use and profitability. Bunge Global S.A. (BG) relies heavily on a favorable Price-to-Book valuation but lags in profitability and leverage metrics. SFD’s moderate debt-to-equity score suggests better financial stability compared to BG’s weaker balance sheet metrics.
Bankruptcy Risk: Solvency Showdown
The Altman Z-Score gap favors SMITHFIELD FOODS INC, implying higher long-term survival odds in this economic cycle:
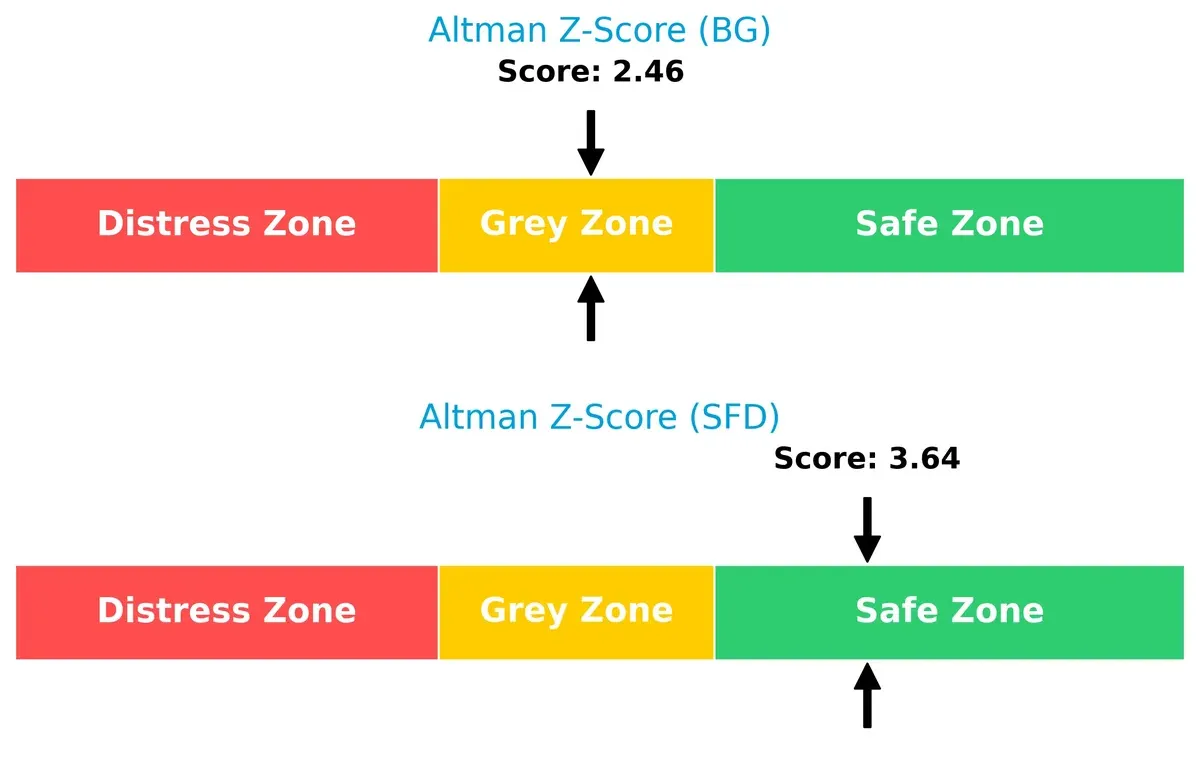
SMITHFIELD FOODS scores 3.64, placing it safely above distress thresholds, signaling robust solvency. Bunge Global’s 2.46 score falls in the grey zone, indicating a moderate bankruptcy risk and less financial resilience amid market volatility.
Financial Health: Quality of Operations
SMITHFIELD FOODS INC outperforms Bunge Global in operational quality, as reflected in their Piotroski F-Scores:
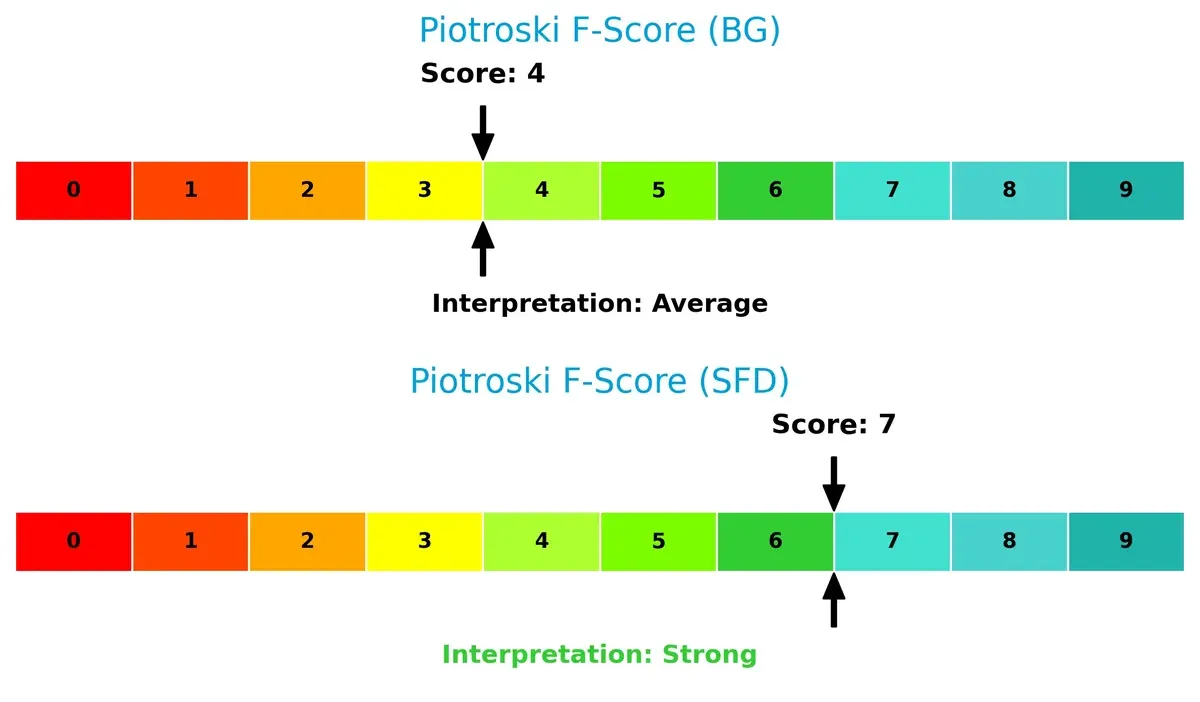
With a strong score of 7, SFD demonstrates solid profitability, liquidity, and efficiency. BG’s average score of 4 raises red flags about internal financial health and operational risks. Investors should weigh these operational disparities carefully before allocating capital.
How are the two companies positioned?
This section dissects BG and SFD’s operational DNA by comparing their revenue distribution by segment alongside internal strengths and weaknesses. The goal is to confront their economic moats to reveal which model offers the most resilient, sustainable competitive advantage today.
Revenue Segmentation: The Strategic Mix
This visual comparison dissects how Bunge Global S.A. and SMITHFIELD FOODS INC diversify their income streams and where their primary sector bets lie:
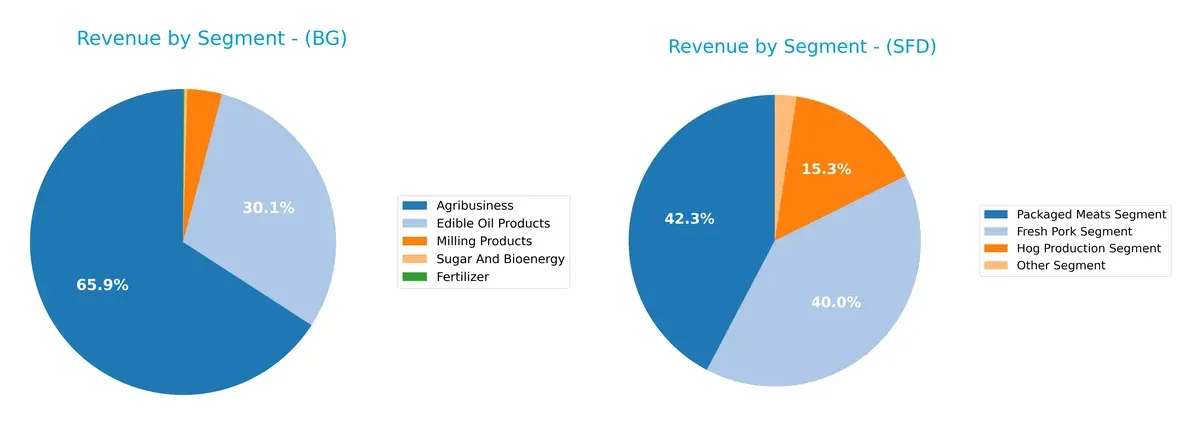
Bunge Global anchors its revenue in Agribusiness at $28B (2024), with significant contributions from Edible Oil Products at $12.8B, showing a moderately diversified portfolio. In contrast, SMITHFIELD FOODS relies heavily on Packaged Meats ($8.3B) and Fresh Pork ($7.9B), concentrating revenue in protein segments. Bunge’s diversity reduces risk and leverages agricultural ecosystems, while Smithfield’s focus signals strong market positioning but exposes it to sector-specific volatility.
Strengths and Weaknesses Comparison
This table compares the strengths and weaknesses of Bunge Global S.A. and SMITHFIELD FOODS INC:
BG Strengths
- Diversified agribusiness portfolio including edible oils, milling, and sugar
- Favorable current ratio at 1.61 supports liquidity
- Asset and fixed asset turnover rates above 1.5 indicate efficient use of assets
- Dividend yield at 3.1% provides steady income
SFD Strengths
- Higher profitability with 16.34% ROE and 6.74% net margin
- Strong liquidity with current ratio 2.46 and quick ratio 1.05
- Low debt-to-assets of 21.33% reduces financial risk
- Favorable P/E at 9.97 supports valuation appeal
- Broad product segments including fresh pork and packaged meats
BG Weaknesses
- Unfavorable net margin at 1.16% and ROIC below WACC at 2.74%
- Quick ratio below 1 at 0.74 signals potential short-term liquidity pressure
- ROE of 4.7% lags industry profitability benchmarks
- Heavy reliance on European and US markets may limit geographic diversification
SFD Weaknesses
- Neutral net margin and ROIC indicate moderate profitability
- Limited geographic diversification with majority revenue from US
- PB ratio at 1.63 is less favorable than BG’s 0.85, indicating less undervaluation potential
Bunge Global shows strengths in diversification and efficient asset use but struggles with profitability and short-term liquidity. Smithfield Foods displays robust profitability and strong financial health but faces geographic concentration and moderate valuation concerns. These contrasts highlight differing strategic priorities and operational focuses.
The Moat Duel: Analyzing Competitive Defensibility
A structural moat is the sole shield protecting long-term profits from relentless competitive erosion. Let’s dissect the moats of two agri-sector giants:
Bunge Global S.A.: Commodity Scale with Margin Pressure
Bunge relies on cost advantage and scale in global grain and oilseed markets. Yet, declining ROIC and squeezed margins signal weakening moat. Expansion into bioenergy offers growth, but risks persist in volatile commodity cycles.
SMITHFIELD FOODS INC: Integrated Value Chain with Margin Resilience
Smithfield leverages vertical integration and brand strength in packaged meats, contrasting Bunge’s commodity focus. Its rising ROIC and margin expansion reflect durable competitive positioning. International market growth and bioscience units may deepen its moat.
Cost Leadership vs. Vertical Integration: Who Defends Better?
Smithfield’s growing ROIC and value creation trump Bunge’s declining profitability and value destruction. I see Smithfield with the deeper moat, better equipped to defend market share amid sector headwinds.
Which stock offers better returns?
The past year shows distinct bullish momentum for both stocks, with Bunge Global S.A. accelerating strongly, while SMITHFIELD FOODS INC also advances steadily on rising buyer dominance and volumes.
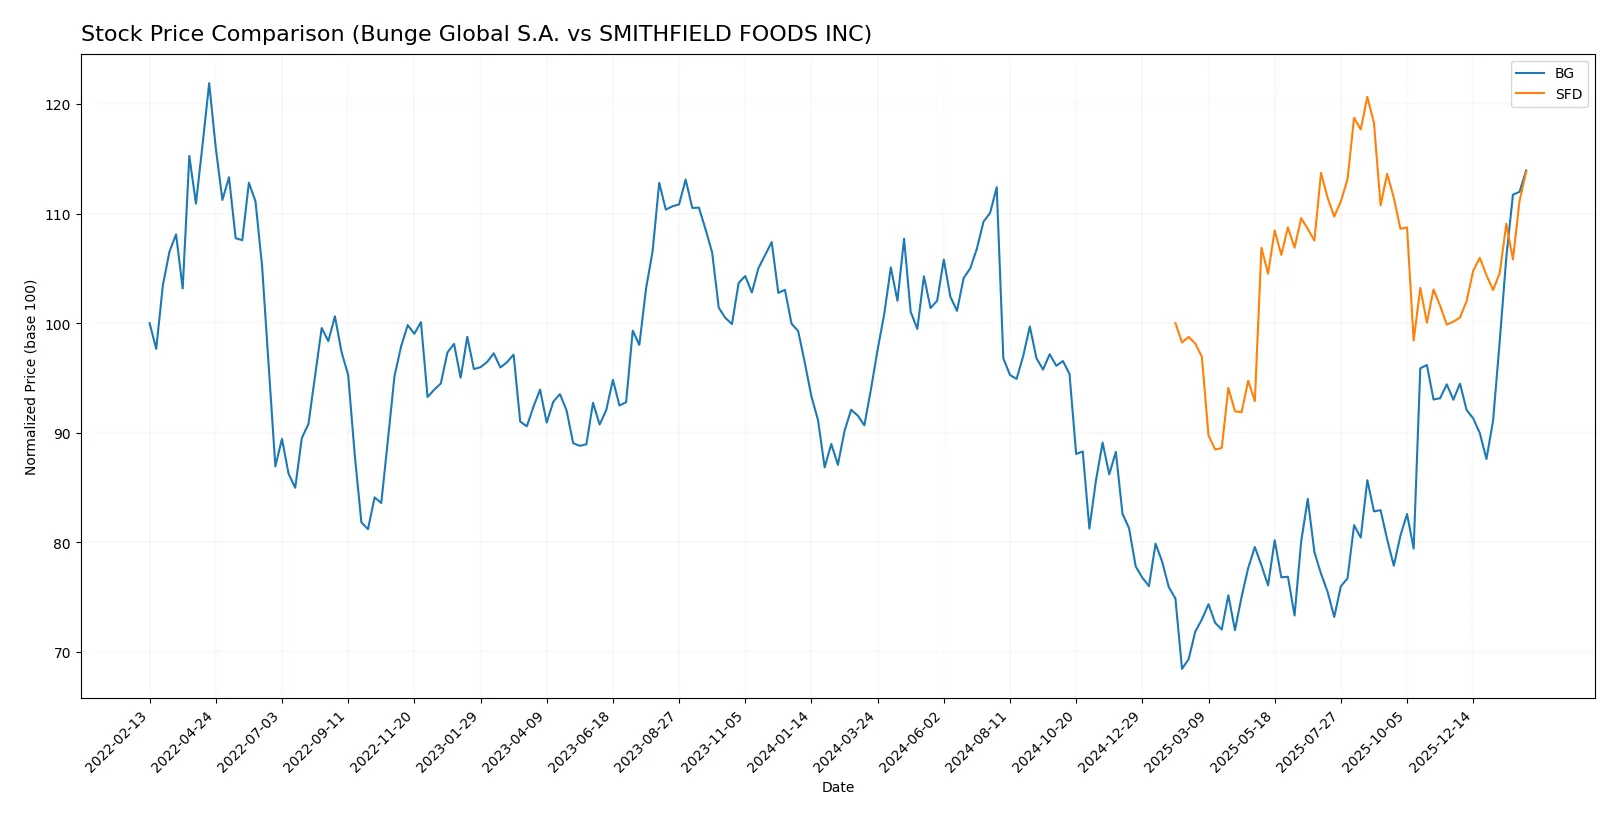
Trend Comparison
Bunge Global S.A. (BG) rose 21.24% over 12 months, exhibiting acceleration and high volatility with a 12.2 std deviation, hitting a peak of 115.86 and a low of 69.6.
SMITHFIELD FOODS INC (SFD) gained 13.81% over the same period, also accelerating but with lower volatility at 1.67 std deviation, ranging between 19.02 and 25.94.
BG’s stronger price increase and higher volatility outpace SFD’s steadier but smaller gain, delivering the superior market performance in this comparison.
Target Prices
Analysts present a clear target price consensus for Bunge Global S.A. and SMITHFIELD FOODS INC.
| Company | Target Low | Target High | Consensus |
|---|---|---|---|
| Bunge Global S.A. | 95 | 145 | 120.33 |
| SMITHFIELD FOODS INC | 29 | 30 | 29.5 |
The consensus target for Bunge Global at 120.33 exceeds its current price of 115.86, implying modest upside. Smithfield’s target consensus at 29.5 also suggests room for appreciation from its 24.47 price.

Don’t Let Luck Decide Your Entry Point
Optimize your entry points with our advanced ProRealTime indicators. You’ll get efficient buy signals with precise price targets for maximum performance. Start outperforming now!
How do institutions grade them?
Here is a summary of recent institutional grades for both companies:
Bunge Global S.A. Grades
The following table presents recent grades from major financial institutions for Bunge Global S.A.:
| Grading Company | Action | New Grade | Date |
|---|---|---|---|
| JP Morgan | Maintain | Overweight | 2026-02-05 |
| Barclays | Maintain | Overweight | 2026-02-05 |
| UBS | Maintain | Buy | 2026-02-05 |
| Morgan Stanley | Maintain | Overweight | 2026-02-05 |
| JP Morgan | Maintain | Overweight | 2026-01-21 |
| Morgan Stanley | Upgrade | Overweight | 2025-12-16 |
| B of A Securities | Maintain | Buy | 2025-12-02 |
| Barclays | Upgrade | Overweight | 2025-11-06 |
| Barclays | Maintain | Equal Weight | 2025-10-21 |
| Stephens & Co. | Maintain | Overweight | 2025-10-17 |
SMITHFIELD FOODS INC Grades
The following table presents recent grades from major financial institutions for SMITHFIELD FOODS INC:
| Grading Company | Action | New Grade | Date |
|---|---|---|---|
| B of A Securities | Maintain | Buy | 2025-10-08 |
| Barclays | Maintain | Overweight | 2025-08-13 |
| UBS | Maintain | Buy | 2025-08-13 |
| Morgan Stanley | Maintain | Overweight | 2025-08-13 |
Which company has the best grades?
Bunge Global S.A. holds a stronger consensus of recent upgrades to Overweight and Buy, signaling growing institutional confidence. SMITHFIELD FOODS INC maintains stable Buy and Overweight ratings but with fewer recent updates. Investors may view Bunge’s positive momentum as a sign of better near-term outlook.
Risks specific to each company
The following categories identify the critical pressure points and systemic threats facing both firms in the 2026 market environment:
1. Market & Competition
Bunge Global S.A.
- Faces intense competition in global agribusiness with pressure on margins and commodity price volatility.
SMITHFIELD FOODS INC
- Operates in highly competitive meat processing with risks from shifting consumer preferences and alternative proteins.
2. Capital Structure & Debt
Bunge Global S.A.
- Moderate leverage with debt-to-assets at 38%, interest coverage at 2.8x signals some risk in rising rates.
SMITHFIELD FOODS INC
- Stronger balance sheet; debt-to-assets at 21%, interest coverage at 17x shows flexibility and lower financial risk.
3. Stock Volatility
Bunge Global S.A.
- Beta of 0.75 indicates moderate volatility, less sensitive than the market but exposed to commodity cycles.
SMITHFIELD FOODS INC
- Very low beta of 0.15 shows defensive stock profile with limited price swings amid market turbulence.
4. Regulatory & Legal
Bunge Global S.A.
- Subject to agricultural export/import rules and bioenergy regulations, with moderate regulatory complexity.
SMITHFIELD FOODS INC
- Faces stringent food safety, animal welfare, and environmental regulations in U.S. and export markets, increasing compliance costs.
5. Supply Chain & Operations
Bunge Global S.A.
- Relies on global commodity supply chains vulnerable to weather disruptions and geopolitical tensions.
SMITHFIELD FOODS INC
- Vertically integrated hog production mitigates supply risk but exposes to disease outbreaks and feed cost inflation.
6. ESG & Climate Transition
Bunge Global S.A.
- Exposed to sustainability pressures in bioenergy and agriculture; transitioning to lower carbon footprint is challenging.
SMITHFIELD FOODS INC
- High scrutiny on livestock emissions and waste management; ESG risks may impact brand and access to capital.
7. Geopolitical Exposure
Bunge Global S.A.
- Global operations expose it to trade tensions and tariffs affecting commodity flows.
SMITHFIELD FOODS INC
- International markets like China and Mexico pose geopolitical and trade risks but offer growth opportunities.
Which company shows a better risk-adjusted profile?
SMITHFIELD FOODS faces its largest risk from regulatory and ESG pressures due to intensive livestock operations and global food safety standards. Bunge’s primary risk lies in commodity price volatility and supply chain disruptions. Smithfield’s strong balance sheet and defensive stock volatility point to a superior risk-adjusted profile. Notably, Smithfield’s Altman Z-Score in the safe zone and higher Piotroski score underscore robust financial health compared to Bunge’s moderate distress signals.
Final Verdict: Which stock to choose?
Bunge Global’s superpower lies in its operational efficiency and strong asset turnover, which historically supports resilience in commodity cycles. However, its declining profitability and value destruction signal a point of vigilance. It fits an aggressive growth portfolio willing to tolerate volatility for potential upside.
Smithfield Foods boasts a robust strategic moat through sustainable value creation and improving profitability, underpinned by consistent ROIC growth above WACC. Its conservative capital structure and superior stability make it suitable for a GARP (Growth at a Reasonable Price) portfolio seeking steady returns with moderate risk.
If you prioritize operational efficiency and are comfortable with cyclical swings, Bunge Global might be compelling despite its challenges. However, if you seek durable competitive advantage and better financial stability, Smithfield Foods offers a more favorable risk-reward profile with stronger value creation. Both choices require careful monitoring of their respective vulnerabilities.
Disclaimer: Investment carries a risk of loss of initial capital. The past performance is not a reliable indicator of future results. Be sure to understand risks before making an investment decision.
Go Further
I encourage you to read the complete analyses of Bunge Global S.A. and SMITHFIELD FOODS INC to enhance your investment decisions: