Home > Comparison > Industrials > TT vs BLDR
The strategic rivalry between Trane Technologies plc and Builders FirstSource, Inc. shapes the Industrials sector’s construction landscape. Trane Technologies operates as a capital-intensive solutions provider specializing in HVAC and refrigeration systems, while Builders FirstSource focuses on supplying building materials and construction services. This head-to-head pits innovative engineering against expansive distribution. This analysis will clarify which business model delivers superior risk-adjusted returns for a diversified portfolio.
Table of contents
Companies Overview
Trane Technologies and Builders FirstSource stand as pivotal players in the construction industry, each shaping their segments with distinct approaches.
Trane Technologies plc: Global Climate Solutions Leader
Trane Technologies dominates the climate control sector, generating revenue through designing, manufacturing, and servicing HVAC and transport refrigeration solutions. Its core business includes air conditioners, chillers, heat pumps, and energy management systems. In 2026, the company focuses strategically on expanding sustainable, energy-efficient technologies worldwide, leveraging its strong global brand presence.
Builders FirstSource, Inc.: Integrated Building Materials Supplier
Builders FirstSource specializes in supplying building materials and components to professional builders and remodelers across the U.S. Its revenue engine hinges on lumber, engineered wood products, and construction services, including turn-key framing and installation. The company’s 2026 strategy emphasizes expanding its product portfolio and enhancing service integration to better serve residential construction markets.
Strategic Collision: Similarities & Divergences
Both firms operate within construction but adopt contrasting philosophies: Trane Technologies pursues a technology-driven, sustainable solutions model, while Builders FirstSource relies on broad materials supply and service integration. Their primary competition lies in servicing large-scale construction projects, though their end markets differ. Investors face two distinct profiles—Trane offers innovation-led growth, whereas Builders FirstSource provides cyclical exposure tied to U.S. housing trends.
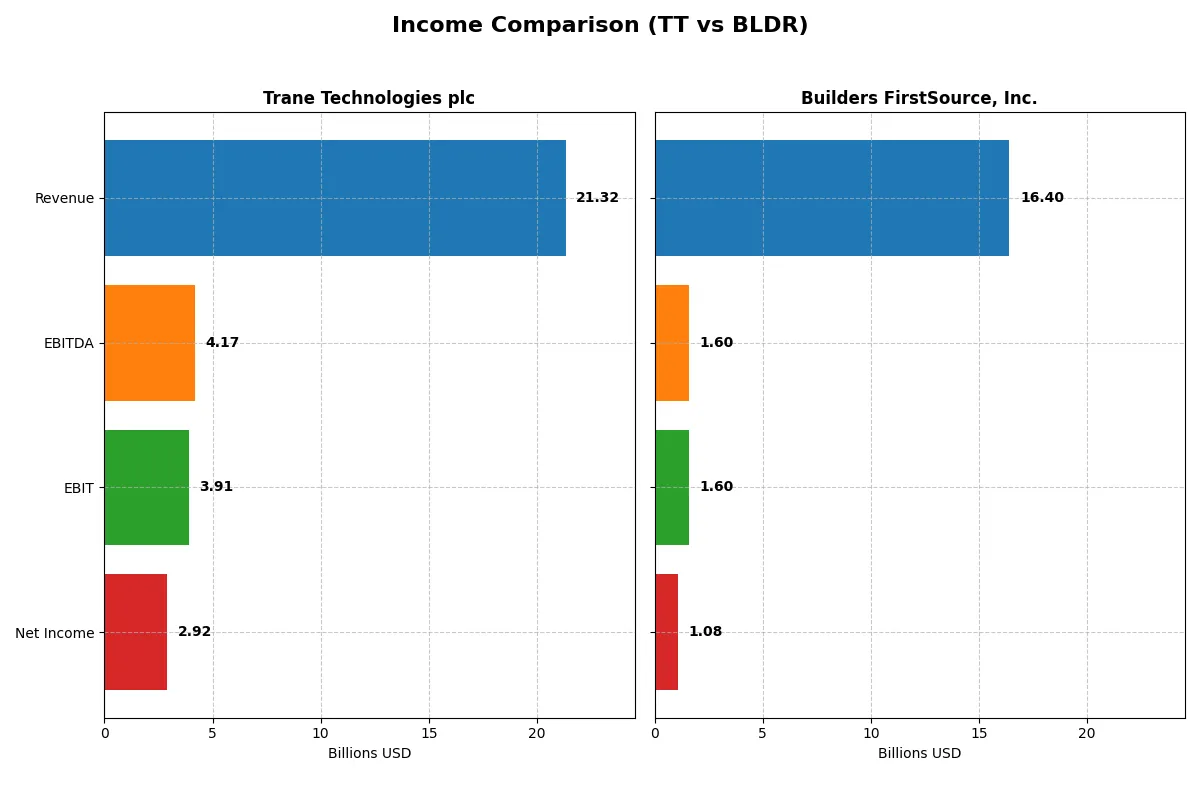
Income Statement Comparison
This data dissects the core profitability and scalability of both corporate engines to reveal who dominates the bottom line:
| Metric | Trane Technologies plc (TT) | Builders FirstSource, Inc. (BLDR) |
|---|---|---|
| Revenue | 21.3B | 16.4B |
| Cost of Revenue | 13.6B | 11.0B |
| Operating Expenses | 3.74B | 3.79B |
| Gross Profit | 7.71B | 5.38B |
| EBITDA | 4.17B | 1.60B |
| EBIT | 3.91B | 1.60B |
| Interest Expense | 228M | 208M |
| Net Income | 2.92B | 1.08B |
| EPS | 13.09 | 9.13 |
| Fiscal Year | 2025 | 2024 |
Income Statement Analysis: The Bottom-Line Duel
This income statement comparison exposes the true efficiency and profitability dynamics driving each company’s financial engine.
Trane Technologies plc Analysis
Trane Technologies grew revenue steadily from 14.1B in 2021 to 21.3B in 2025, with net income almost doubling to 2.9B. Its gross margin rose to 36.2%, and the net margin improved to 13.7%, signaling robust operational leverage. In 2025, efficiency gains fueled a 12% EBIT growth and a solid 15% EPS increase, reflecting strong momentum.
Builders FirstSource, Inc. Analysis
Builders FirstSource expanded revenue from 8.6B in 2020 to a peak of 22.7B in 2022 before declining to 16.4B in 2024. Net income peaked at 2.7B in 2022 but fell to 1.1B by 2024. Despite a respectable 32.8% gross margin, its net margin dropped to 6.6%, with a 27% net margin contraction in the latest year, indicating margin pressure and waning efficiency.
Margin Strength vs. Revenue Volatility
Trane Technologies showcases consistent margin expansion and steady revenue growth, underpinning superior profitability. Builders FirstSource, while demonstrating impressive historical net income growth, suffers recent revenue declines and margin compression. Trane’s profile offers a clearer profitability advantage, making it more attractive for investors focused on sustainable earnings quality.
Financial Ratios Comparison
These vital ratios act as a diagnostic tool to expose the underlying fiscal health, valuation premiums, and capital efficiency of these companies:
| Ratios | Trane Technologies plc (TT) | Builders FirstSource, Inc. (BLDR) |
|---|---|---|
| ROE | 34.0% | 25.1% |
| ROIC | 20.3% | 13.9% |
| P/E | 29.8 | 15.7 |
| P/B | 10.1 | 3.93 |
| Current Ratio | 1.25 | 1.77 |
| Quick Ratio | 0.92 | 1.09 |
| D/E | 0.54 | 1.01 |
| Debt-to-Assets | 21.5% | 40.9% |
| Interest Coverage | 17.4 | 7.7 |
| Asset Turnover | 1.00 | 1.55 |
| Fixed Asset Turnover | 9.47 | 6.42 |
| Payout ratio | 28.7% | 0% |
| Dividend yield | 0.96% | 0% |
| Fiscal Year | 2025 | 2024 |
Efficiency & Valuation Duel: The Vital Signs
Financial ratios serve as the company’s DNA, revealing hidden risks and operational excellence essential to informed investment decisions.
Trane Technologies plc
Trane Technologies delivers robust profitability with a 33.9% ROE and a strong 13.7% net margin, indicating efficient operations. However, its valuation appears stretched with a P/E near 30 and a high P/B of 10.1. The company offers a modest 0.96% dividend yield, reflecting a cautious shareholder return approach amid reinvestment needs.
Builders FirstSource, Inc.
Builders FirstSource shows solid profitability, evidenced by a 25.1% ROE and a 6.6% net margin, signaling operational competence. Its valuation is more moderate with a P/E of 15.6 but a relatively high P/B of 3.9. The firm pays no dividend, suggesting capital deployment favors growth or debt management over immediate shareholder payouts.
Premium Valuation vs. Operational Safety
Trane Technologies commands a premium valuation supported by superior profitability, while Builders FirstSource offers a more balanced valuation with decent returns. Builders FirstSource’s profile suits investors prioritizing operational safety and moderate risk. Trane appeals to those accepting valuation risk for higher returns.
Which one offers the Superior Shareholder Reward?
I see Trane Technologies (TT) pays a modest 0.96% dividend yield with a conservative 29% payout ratio, well covered by a strong 88% free cash flow conversion. It also executes steady buybacks, enhancing total shareholder return. Builders FirstSource (BLDR) offers no dividends but aggressively repurchases shares, funded by robust free cash flow of 12.6B and a lower price-to-free-cash-flow ratio of 11.3x versus TT’s 31x. BLDR’s reinvestment in growth and buybacks signals a capital allocation strategy focused on long-term value. Given TT’s dividend stability and BLDR’s vigorous buybacks coupled with growth, I find BLDR’s shareholder reward more attractive in 2026 due to superior free cash flow efficiency and buyback intensity.
Comparative Score Analysis: The Strategic Profile
The radar chart reveals the fundamental DNA and trade-offs of Trane Technologies plc and Builders FirstSource, Inc.:
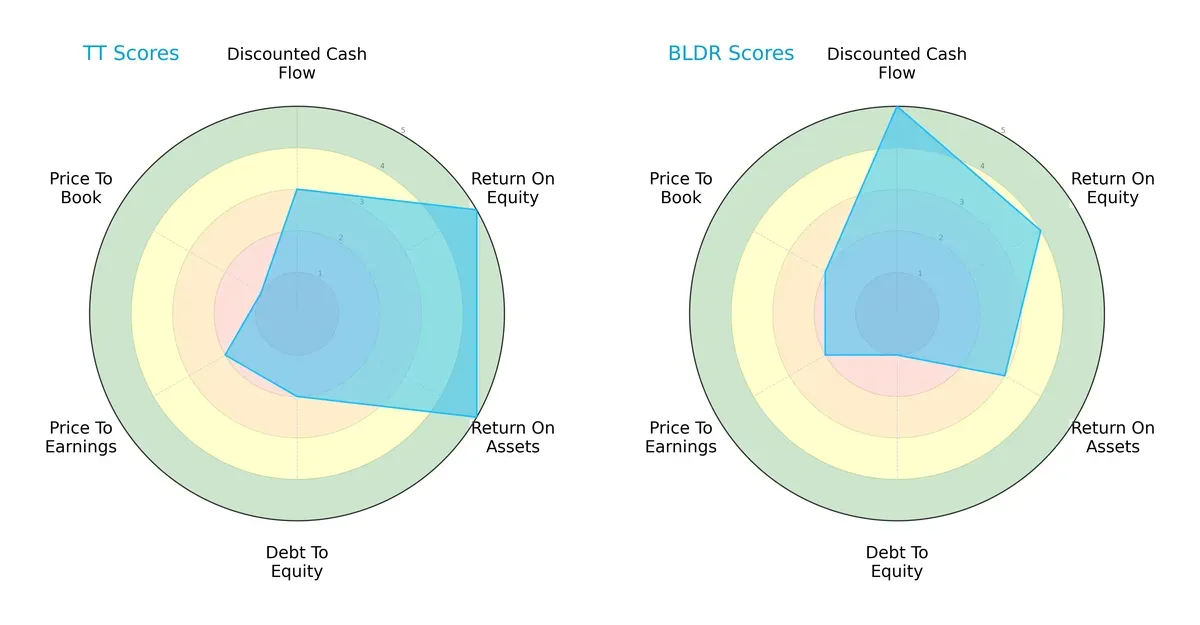
Trane Technologies shows a balanced profile with strong returns on equity (5) and assets (5). Builders FirstSource capitalizes on a superior discounted cash flow score (5) but lags in debt-to-equity (1), indicating higher leverage risk. Trane’s valuation metrics (P/E: 2, P/B: 1) are weaker, signaling potential overvaluation concerns. Overall, Trane leans on operational efficiency, while Builders FirstSource depends more on cash flow strength.
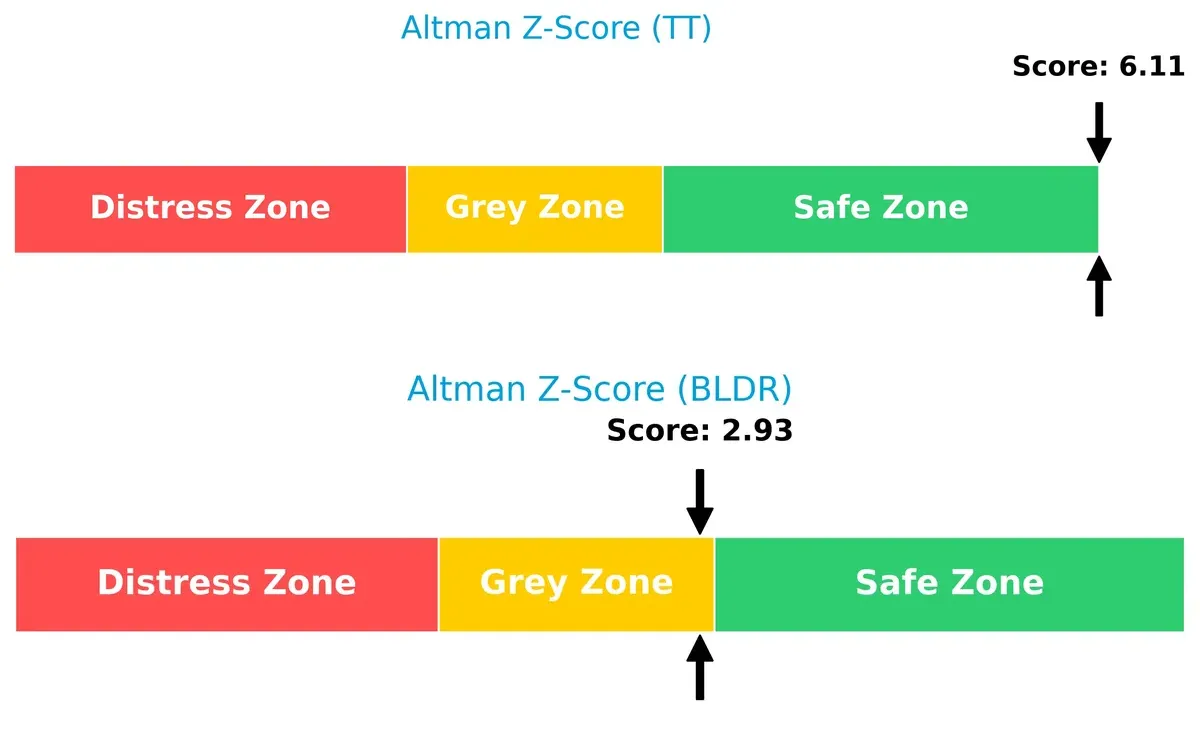
Bankruptcy Risk: Solvency Showdown
Trane’s Altman Z-Score of 6.11 places it comfortably in the safe zone, while Builders FirstSource’s 2.93 sits in the grey zone, indicating moderate bankruptcy risk in this cycle:
Financial Health: Quality of Operations
Trane’s Piotroski F-Score of 8 signals very strong financial health, outperforming Builders FirstSource’s average score of 6, which indicates some internal weaknesses:
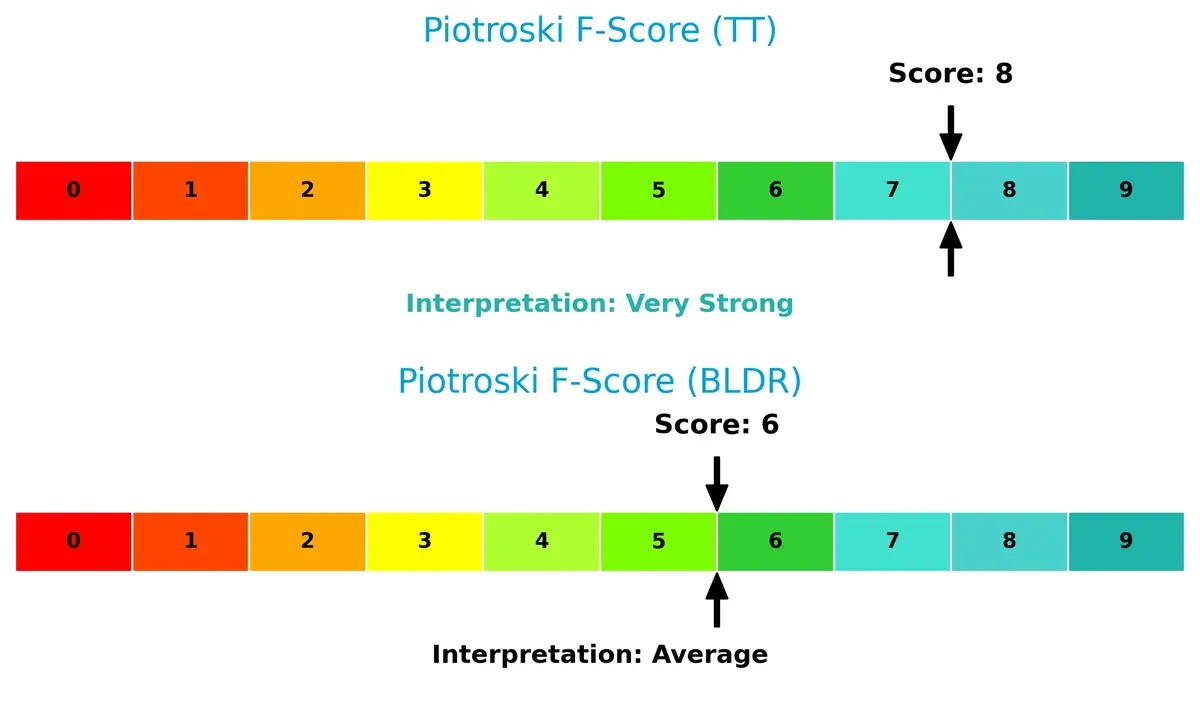
Trane’s superior operational metrics and lower financial distress risk make it the more resilient choice for conservative portfolios. Builders FirstSource’s higher leverage and moderate financial health require cautious monitoring.
How are the two companies positioned?
This section dissects the operational DNA of TT and BLDR by comparing their revenue distribution and internal dynamics. The goal is to confront their economic moats and identify which model delivers the most resilient competitive advantage today.
Revenue Segmentation: The Strategic Mix
This visual comparison dissects how Trane Technologies and Builders FirstSource diversify their income streams and reveals each firm’s primary sector bets:
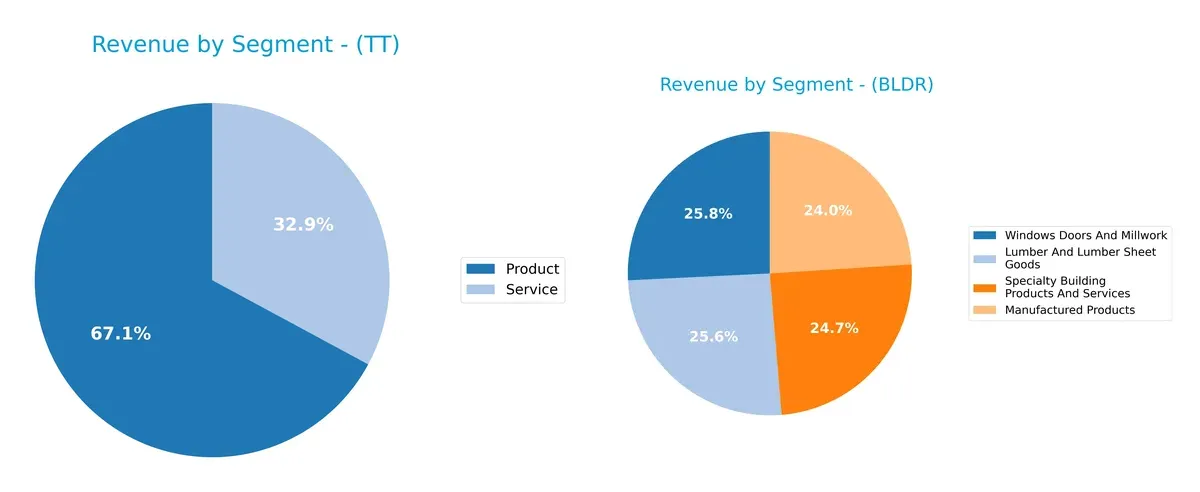
Trane Technologies anchors its revenue in two broad segments: Product at $13.3B and Service at $6.5B in 2024, showing moderate diversification but a clear dominance of product sales. Builders FirstSource presents a more balanced revenue mix across four segments, each near $4B, indicating a diversified portfolio. Builders’ approach reduces concentration risk, while Trane’s product focus suggests reliance on manufacturing scale and innovation-driven ecosystem lock-in.
Strengths and Weaknesses Comparison
This table compares the Strengths and Weaknesses of Trane Technologies plc (TT) and Builders FirstSource, Inc. (BLDR):
TT Strengths
- High net margin at 13.69%
- ROE strong at 33.93%
- ROIC exceeds WACC at 20.26%
- Favorable debt-to-assets at 21.55%
- Solid interest coverage at 17.17x
- Diverse revenue with product and service segments
- Global presence with Americas, Asia Pacific, and EMEA revenues
BLDR Strengths
- Favorable ROE at 25.09%
- ROIC above WACC at 13.9%
- Strong current and quick ratios (1.77 and 1.09)
- Asset turnover favorable at 1.55x
- Fixed asset turnover at 6.42x
- Diverse product segments including lumber and specialty building products
- Regional presence across multiple U.S. geographic segments
TT Weaknesses
- Unfavorable high P/E of 29.82
- Unfavorable high P/B at 10.12
- Dividend yield low at 0.96%
- Neutral liquidity ratios near 1.25 and 0.92
- Moderate leverage with D/E at 0.54
- Concentrated geographic revenue with Americas dominant
BLDR Weaknesses
- Unfavorable debt-to-equity at 1.01
- Unfavorable P/B at 3.93
- Zero dividend yield
- Moderate net margin at 6.57% neutral
- Higher debt-to-assets at 40.94%
- Concentrated U.S.-only geographic exposure limits global diversification
Both companies show slightly favorable financial profiles with distinct strengths. TT boasts superior profitability and global reach but trades at higher valuation multiples. BLDR offers better liquidity and asset efficiency but carries heavier leverage and lacks international diversification. These factors shape their strategic positioning and risk profiles differently.
The Moat Duel: Analyzing Competitive Defensibility
A structural moat shields long-term profits from relentless competition erosion. Only a resilient moat ensures sustainable advantage in 2026:
Trane Technologies plc: Durable Innovation & Scale Moat
I identify Trane’s moat in its cost advantage and extensive product ecosystem. Its 11% ROIC premium over WACC fuels stable 18% EBIT margins. Expansion in energy-efficient HVAC deepens this moat amid rising regulatory demands.
Builders FirstSource, Inc.: Scale and Integration Moat
Builders FirstSource leverages scale and integration in building materials supply, contrasting Trane’s tech edge. Its 4.5% ROIC premium over WACC supports moderate 10% EBIT margins. However, recent revenue declines pose risks, though opportunities in integrated construction services could revive growth.
Verdict: Cost Leadership vs. Scale Integration
Trane’s wider moat reflects stronger capital efficiency and margin stability, underpinned by innovation and global reach. Builders FirstSource’s moat is narrower and more vulnerable to market cycles. Trane stands better equipped to defend and grow its market share in 2026.
Which stock offers better returns?
Over the past year, Trane Technologies gained 47.65%, showing a strong bullish trend despite decelerating momentum. Builders FirstSource fell 42.75%, reflecting an accelerating bearish trend. Trading volumes increased for both stocks.
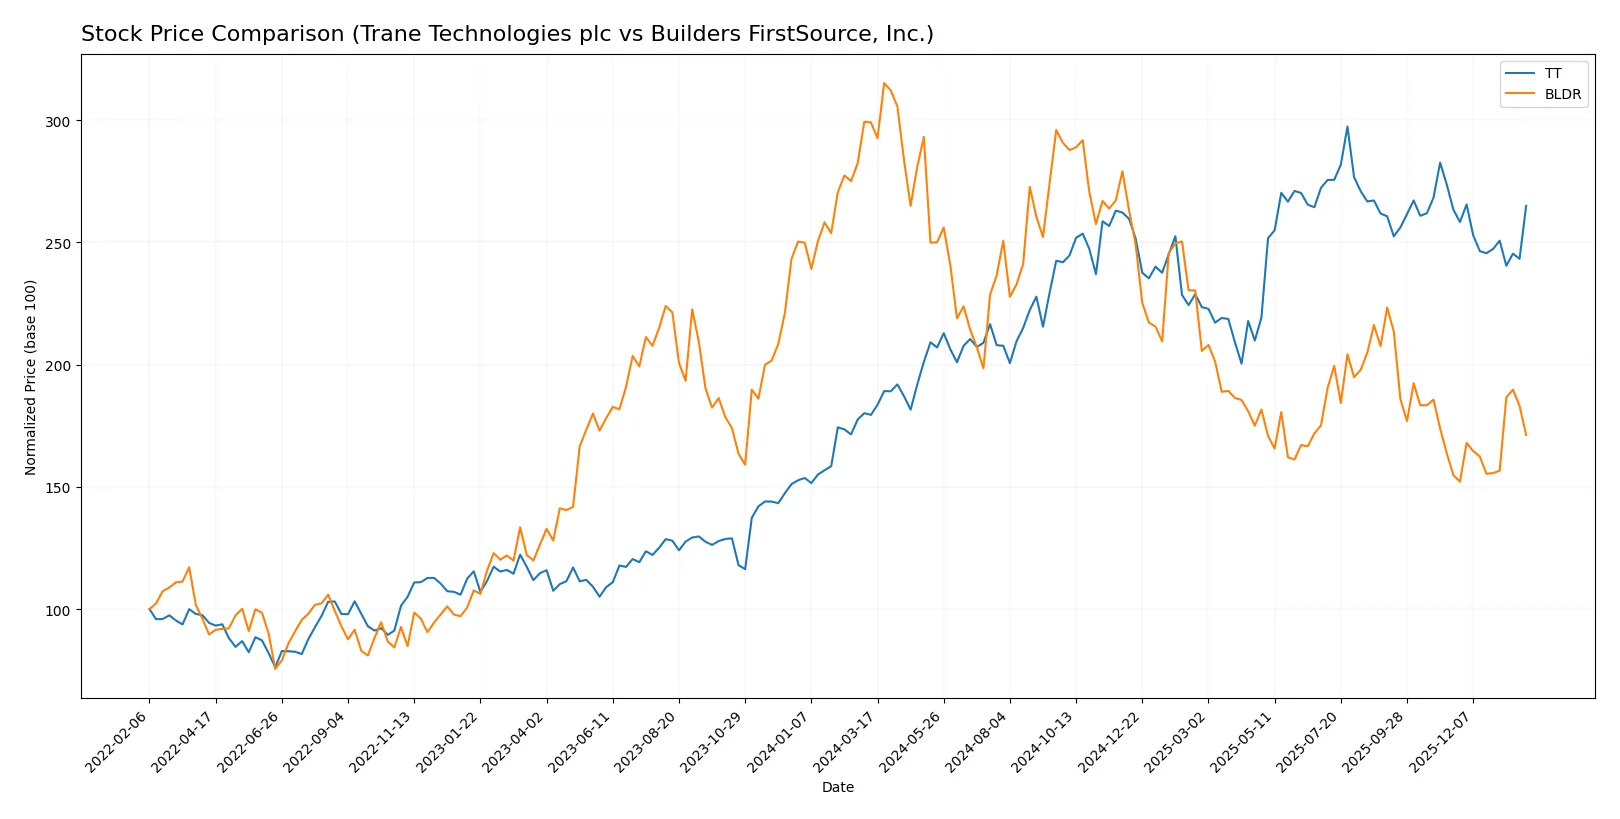
Trend Comparison
Trane Technologies’ stock rose 47.65% over the past year, marking a bullish trend with decelerating price gains and high volatility (44.11 std dev). The stock hit a high of 472.07 and a low of 284.85.
Builders FirstSource’s stock declined 42.75%, indicating a bearish trend with accelerating losses. Volatility stands at 29.71. The stock recorded a high of 210.54 and a low of 101.62 during the period.
Trane Technologies delivered the highest market performance with a significant price increase, contrasting with Builders FirstSource’s steep decline over the same timeframe.
Target Prices
Analysts present a balanced target price consensus for both Trane Technologies plc and Builders FirstSource, Inc., signaling moderate upside potential.
| Company | Target Low | Target High | Consensus |
|---|---|---|---|
| Trane Technologies plc | 370 | 520 | 475 |
| Builders FirstSource, Inc. | 109.41 | 145 | 128.64 |
Trane Technologies’ consensus target of 475 suggests a 13% upside from its current 420.58 price. Builders FirstSource shows a 12% potential gain versus its 114.4 price.

Don’t Let Luck Decide Your Entry Point
Optimize your entry points with our advanced ProRealTime indicators. You’ll get efficient buy signals with precise price targets for maximum performance. Start outperforming now!
How do institutions grade them?
Trane Technologies plc Grades
The following table summarizes recent institutional grades for Trane Technologies plc:
| Grading Company | Action | New Grade | Date |
|---|---|---|---|
| RBC Capital | Maintain | Sector Perform | 2026-01-30 |
| Wells Fargo | Maintain | Underweight | 2026-01-30 |
| Oppenheimer | Maintain | Outperform | 2026-01-30 |
| Citigroup | Maintain | Buy | 2026-01-30 |
| JP Morgan | Maintain | Neutral | 2026-01-30 |
| Barclays | Maintain | Overweight | 2026-01-30 |
| Oppenheimer | Upgrade | Outperform | 2026-01-20 |
| Morgan Stanley | Maintain | Overweight | 2026-01-13 |
| Barclays | Maintain | Overweight | 2026-01-07 |
| UBS | Maintain | Buy | 2026-01-05 |
Builders FirstSource, Inc. Grades
The following table summarizes recent institutional grades for Builders FirstSource, Inc.:
| Grading Company | Action | New Grade | Date |
|---|---|---|---|
| Stephens & Co. | Downgrade | Equal Weight | 2026-01-20 |
| Barclays | Maintain | Overweight | 2026-01-15 |
| UBS | Maintain | Buy | 2026-01-06 |
| Stifel | Maintain | Hold | 2025-12-16 |
| Jefferies | Downgrade | Hold | 2025-12-15 |
| Barclays | Maintain | Overweight | 2025-12-08 |
| DA Davidson | Maintain | Neutral | 2025-11-03 |
| Zelman & Assoc | Upgrade | Neutral | 2025-10-31 |
| UBS | Maintain | Buy | 2025-10-31 |
| Barclays | Maintain | Overweight | 2025-10-31 |
Which company has the best grades?
Trane Technologies plc holds generally stronger grades, including multiple “Buy” and “Outperform” ratings. Builders FirstSource shows more mixed results with downgrades to “Hold” and “Equal Weight.” This difference signals potentially higher analyst confidence in Trane Technologies’ near-term prospects.
Risks specific to each company
The following categories identify the critical pressure points and systemic threats facing both firms in the 2026 market environment:
1. Market & Competition
Trane Technologies plc
- Operates globally with strong HVAC innovation but faces intense competition from diversified industrial players.
Builders FirstSource, Inc.
- Focuses on U.S. residential construction materials; highly sensitive to housing market cycles and regional competition.
2. Capital Structure & Debt
Trane Technologies plc
- Maintains moderate leverage (D/E 0.54) with strong interest coverage (17.17x), indicating solid debt management.
Builders FirstSource, Inc.
- Higher leverage (D/E 1.01) raises financial risk despite acceptable interest coverage (7.68x).
3. Stock Volatility
Trane Technologies plc
- Beta of 1.22 suggests moderate volatility, reflecting stable investor confidence amid industrial sector cycles.
Builders FirstSource, Inc.
- Beta of 1.57 indicates elevated volatility, exposing shareholders to greater market swings.
4. Regulatory & Legal
Trane Technologies plc
- Faces stringent environmental regulations due to refrigerants and emissions, increasing compliance costs.
Builders FirstSource, Inc.
- Subject to building codes and material safety standards; litigation risks tied to construction defects.
5. Supply Chain & Operations
Trane Technologies plc
- Global supply chain complexity risks disruptions but benefits from diversified sourcing and scale.
Builders FirstSource, Inc.
- Relies heavily on U.S. suppliers; vulnerable to regional supply shortages and price volatility in lumber and steel.
6. ESG & Climate Transition
Trane Technologies plc
- Advanced climate solutions boost ESG profile but require ongoing R&D investment to meet evolving standards.
Builders FirstSource, Inc.
- ESG efforts growing but lag peers; exposure to carbon-intensive materials challenges climate transition goals.
7. Geopolitical Exposure
Trane Technologies plc
- Significant international sales expose it to currency and geopolitical risks, especially in emerging markets.
Builders FirstSource, Inc.
- Primarily domestic U.S. focus mitigates direct geopolitical risks but limits global growth opportunities.
Which company shows a better risk-adjusted profile?
Trane Technologies faces its biggest risk in regulatory and geopolitical exposure, balancing global complexity with strong financial metrics. Builders FirstSource’s highest risk lies in capital structure and market volatility, compounded by regional supply vulnerabilities. Given Trane’s superior Altman Z-Score (6.11, safe zone) and Piotroski Score (8, very strong), it demonstrates a more robust risk-adjusted profile. Builders FirstSource’s scores place it in a grey zone with average financial strength, justifying caution in this cyclical, leveraged player.
Final Verdict: Which stock to choose?
Trane Technologies (TT) stands out for its ability to generate strong economic value through a durable competitive advantage. Its superpower lies in consistently high returns on invested capital that outpace its cost of capital, signaling efficient capital allocation and robust profitability. A point of vigilance remains its elevated valuation multiples, which might temper near-term upside. TT fits well in portfolios targeting aggressive growth with an appetite for premium pricing.
Builders FirstSource (BLDR) leverages its strategic moat in operational efficiency and asset utilization, reflected in solid return metrics and a favorable free cash flow yield. Its relatively stronger liquidity ratios and lower valuation multiples provide a margin of safety compared to TT. BLDR suits investors seeking growth at a reasonable price, balancing potential upside with a more conservative risk profile.
If you prioritize durable value creation and can tolerate premium valuation, Trane Technologies outshines with superior profitability and growth momentum. However, if you seek better stability with reasonable entry multiples and a steadier financial footing, Builders FirstSource offers a compelling alternative. Both present favorable long-term prospects, but your choice depends on your risk tolerance and investment style.
Disclaimer: Investment carries a risk of loss of initial capital. The past performance is not a reliable indicator of future results. Be sure to understand risks before making an investment decision.
Go Further
I encourage you to read the complete analyses of Trane Technologies plc and Builders FirstSource, Inc. to enhance your investment decisions: