Home > Comparison > Industrials > LII vs BLDR
The strategic rivalry between Lennox International Inc. and Builders FirstSource, Inc. shapes the Industrials sector’s construction landscape. Lennox operates as a diversified manufacturer of HVAC and refrigeration systems, emphasizing technological integration and premium solutions. Builders FirstSource focuses on supplying building materials and components at scale, leveraging volume and service breadth. This analysis will assess which business model offers a superior risk-adjusted return, guiding investors seeking durable exposure in Industrial construction.
Table of contents
Companies Overview
Lennox International Inc. and Builders FirstSource, Inc. both shape the US construction sector but serve distinct markets with unique value propositions.
Lennox International Inc.: HVAC and Refrigeration Powerhouse
Lennox International Inc. dominates the heating, ventilation, air conditioning, and refrigeration (HVACR) markets. Its core revenue stems from manufacturing and marketing residential and commercial heating and cooling systems, plus refrigeration solutions essential for food preservation. In 2026, Lennox emphasizes innovation in energy-efficient HVAC technologies, aiming to capture growing demand for sustainable climate control.
Builders FirstSource, Inc.: Building Materials and Services Leader
Builders FirstSource, Inc. commands a strong position in building materials and construction services for professional homebuilders and remodelers. Its revenues arise from lumber, engineered wood products, windows, doors, and turnkey building solutions. The company’s 2026 strategy focuses on expanding its integrated supply chain and enhancing installation services to improve customer retention and operational efficiency.
Strategic Collision: Similarities & Divergences
Both companies operate in construction but contrast sharply in focus—Lennox leans on high-tech climate control, while Builders FirstSource centers on materials and construction logistics. Their primary battleground is the residential construction market where HVAC and materials intersect. Investors face distinct profiles: Lennox offers exposure to innovation-driven industrial products; Builders FirstSource provides scale and distribution strength in building supplies.
Income Statement Comparison
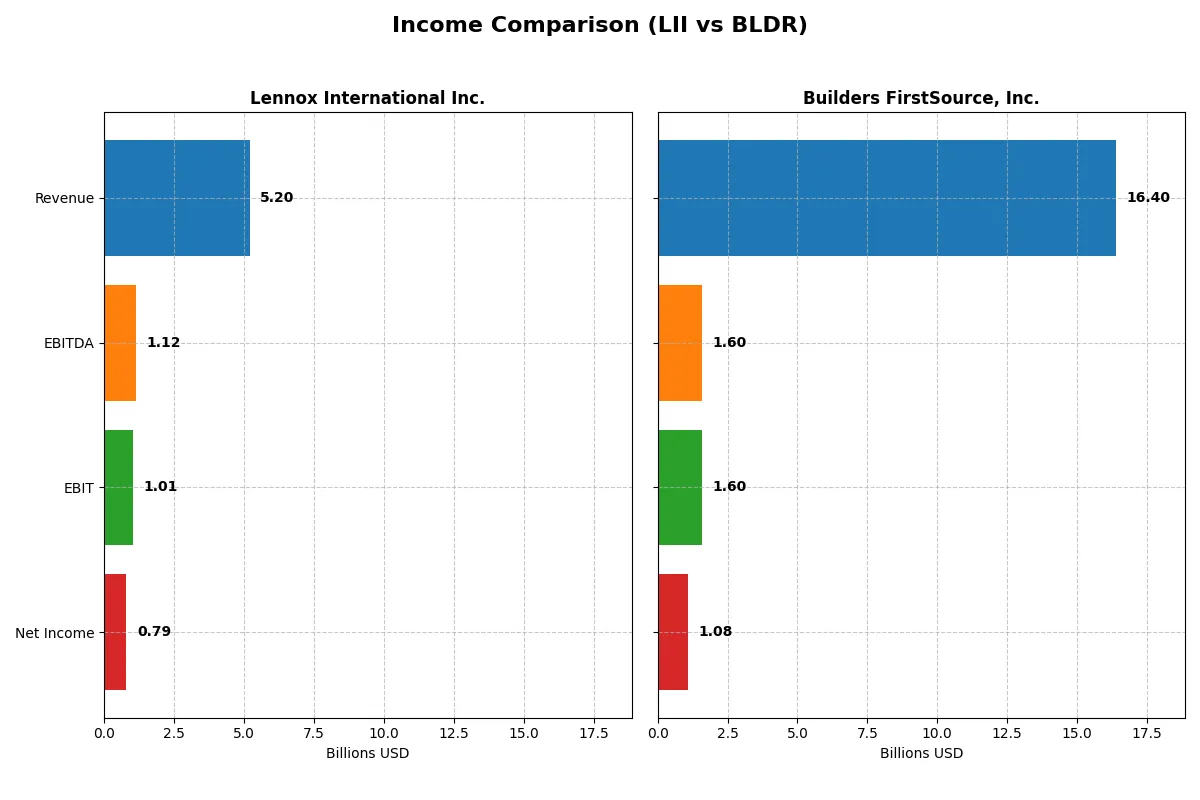
This data dissects the core profitability and scalability of both corporate engines to reveal who dominates the bottom line:
| Metric | Lennox International Inc. (LII) | Builders FirstSource, Inc. (BLDR) |
|---|---|---|
| Revenue | 5.20B | 16.40B |
| Cost of Revenue | 3.48B | 11.02B |
| Operating Expenses | 700M | 3.79B |
| Gross Profit | 1.72B | 5.38B |
| EBITDA | 1.12B | 1.60B |
| EBIT | 1.01B | 1.60B |
| Interest Expense | 41M | 208M |
| Net Income | 786M | 1.08B |
| EPS | 22.31 | 9.13 |
| Fiscal Year | 2025 | 2024 |
Income Statement Analysis: The Bottom-Line Duel
This income statement comparison reveals the true efficiency and profitability dynamics of two distinct corporate engines.
Lennox International Inc. Analysis
Lennox International’s revenue grew 24% from 2021 to 2025 but dipped 2.7% in 2025 alone. Net income surged 69% over five years, reflecting solid bottom-line momentum. The company sustains a healthy 33% gross margin and a strong 15% net margin. In 2025, Lennox maintained efficiency with a favorable 0.79% interest expense relative to revenue.
Builders FirstSource, Inc. Analysis
Builders FirstSource expanded revenue 92% over five years but saw a 4.1% decline in 2024. Net income soared 244% overall but contracted 27% year-over-year. The firm holds a comparable 33% gross margin but a narrower 6.6% net margin. Interest expenses represent 1.27% of revenue, higher than Lennox, signaling greater financial leverage in 2024.
Margin Power vs. Revenue Scale
Lennox International leads with superior net margin and lower interest burden, showing efficient profit conversion despite slower revenue growth. Builders FirstSource impresses with rapid revenue and net income expansion but suffers margin compression and higher leverage. For investors prioritizing profitability and margin stability, Lennox offers a more attractive profile.
Financial Ratios Comparison
These vital ratios act as a diagnostic tool to expose the underlying fiscal health, valuation premiums, and capital efficiency of the companies analyzed:
| Ratios | Lennox International Inc. (LII) | Builders FirstSource, Inc. (BLDR) |
|---|---|---|
| ROE | 67.60% | 25.09% |
| ROIC | 25.51% | 13.90% |
| P/E | 21.56 | 15.65 |
| P/B | 14.57 | 3.93 |
| Current Ratio | 1.60 | 1.77 |
| Quick Ratio | 0.63 | 1.09 |
| D/E | 1.77 | 1.01 |
| Debt-to-Assets | 50.57% | 40.94% |
| Interest Coverage | 24.83 | 7.68 |
| Asset Turnover | 1.27 | 1.55 |
| Fixed Asset Turnover | 4.18 | 6.42 |
| Payout ratio | 22.00% | 0% |
| Dividend yield | 1.02% | 0% |
| Fiscal Year | 2025 | 2024 |
Efficiency & Valuation Duel: The Vital Signs
Ratios act as a company’s DNA, unveiling hidden risks and operational excellence through concise financial signals.
Lennox International Inc.
Lennox International shows strong profitability with a 67.6% ROE and a solid 15.13% net margin, reflecting operational efficiency. Its P/E ratio of 21.56 signals a fairly valued stock, though a high P/B of 14.57 suggests some premium. The 1.02% dividend yield indicates shareholder returns, balancing growth and income.
Builders FirstSource, Inc.
Builders FirstSource posts a respectable 25.1% ROE and a moderate 6.57% net margin, demonstrating steady but less robust profitability. Its P/E of 15.65 appears more conservative than Lennox’s, with a lower P/B of 3.93. The absence of dividends points to reinvestment focused on growth, supported by strong asset turnover ratios.
Premium Valuation vs. Operational Safety
Lennox International commands a premium valuation with superior profitability and dividend income, while Builders FirstSource offers a more conservative price with reinvestment potential. Lennox suits investors prioritizing income and efficiency, whereas Builders FirstSource fits those seeking growth with moderate risk.
Which one offers the Superior Shareholder Reward?
Lennox International Inc. (LII) and Builders FirstSource, Inc. (BLDR) contrast sharply in shareholder reward models. LII pays a modest dividend yield near 1%, with a sustainable payout ratio around 22%. It pairs dividends with moderate buybacks, supported by robust FCF coverage above 80%. BLDR pays no dividends but aggressively repurchases shares, driving total returns through capital appreciation. Its buyback program is intense, funded by strong operating cash flow and a lower debt burden. Historically, I’ve observed dividend-plus-buyback models like LII’s deliver steady returns in cyclical sectors, balancing income and growth. BLDR’s reinvestment strategy prioritizes growth over income, appealing in expansion phases but riskier if cash flow falters. In 2026, I find LII’s hybrid distribution more reliable for consistent shareholder reward, while BLDR suits growth-oriented investors willing to accept volatility. Overall, LII offers the superior total return profile for risk-conscious portfolios.
Comparative Score Analysis: The Strategic Profile
The radar chart reveals the fundamental DNA and trade-offs of Lennox International Inc. and Builders FirstSource, Inc.:
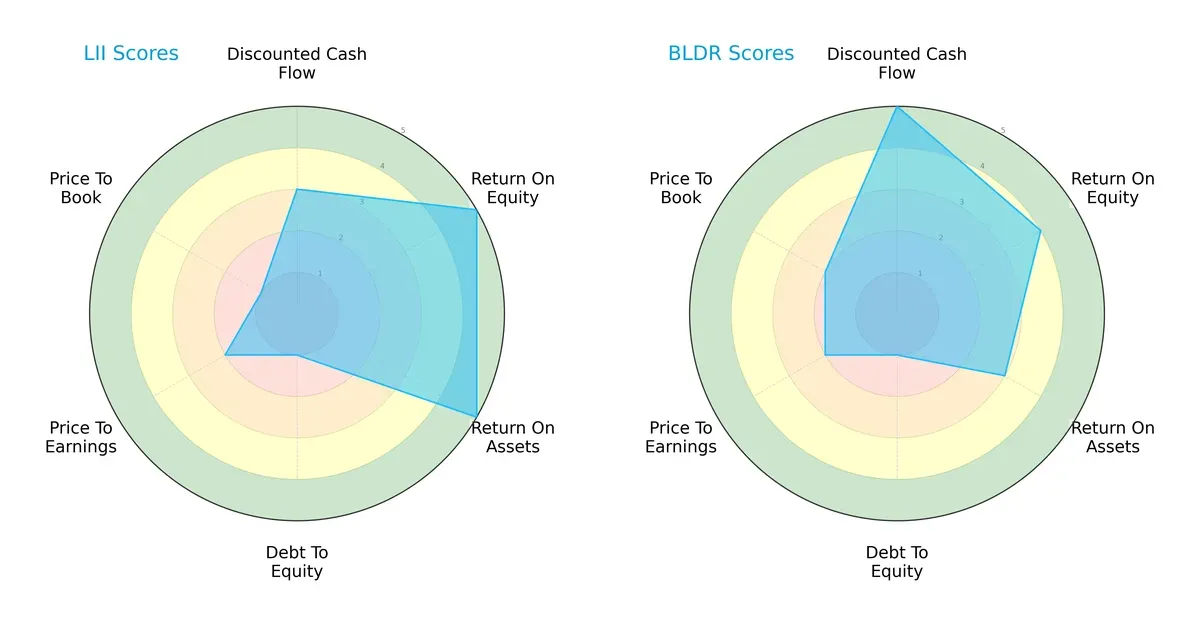
Lennox International excels in profitability with top ROE (5) and ROA (5) scores but suffers from weak balance sheet health, indicated by a very unfavorable debt-to-equity (1) and price-to-book (1) scores. Builders FirstSource boasts a stronger valuation edge with a higher DCF score (5) and better price-to-book (2) but posts moderate profitability metrics (ROE 4, ROA 3). Both show vulnerability in leverage, yet Builders FirstSource offers a more balanced profile across valuation and asset utilization.
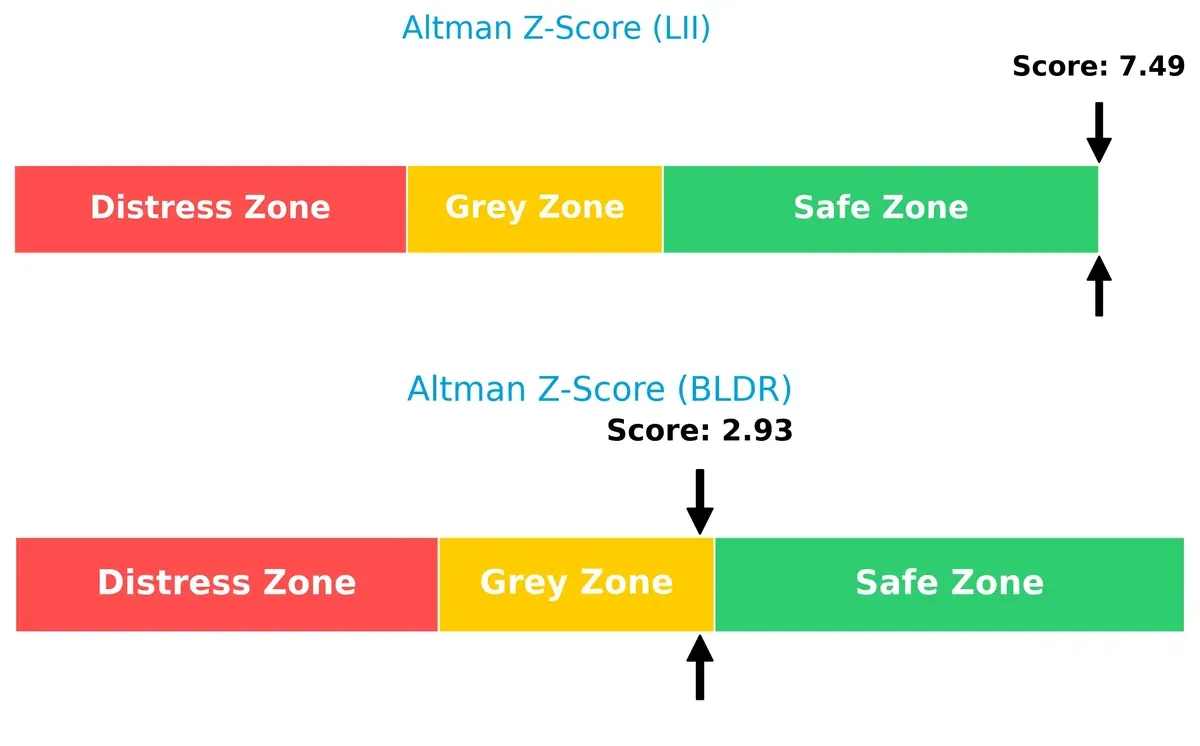
Bankruptcy Risk: Solvency Showdown
Lennox International’s Altman Z-Score of 7.49 places it firmly in the safe zone, signaling robust long-term survival prospects. Builders FirstSource’s score of 2.93 lands in the grey zone, suggesting moderate financial distress risk in this cycle:
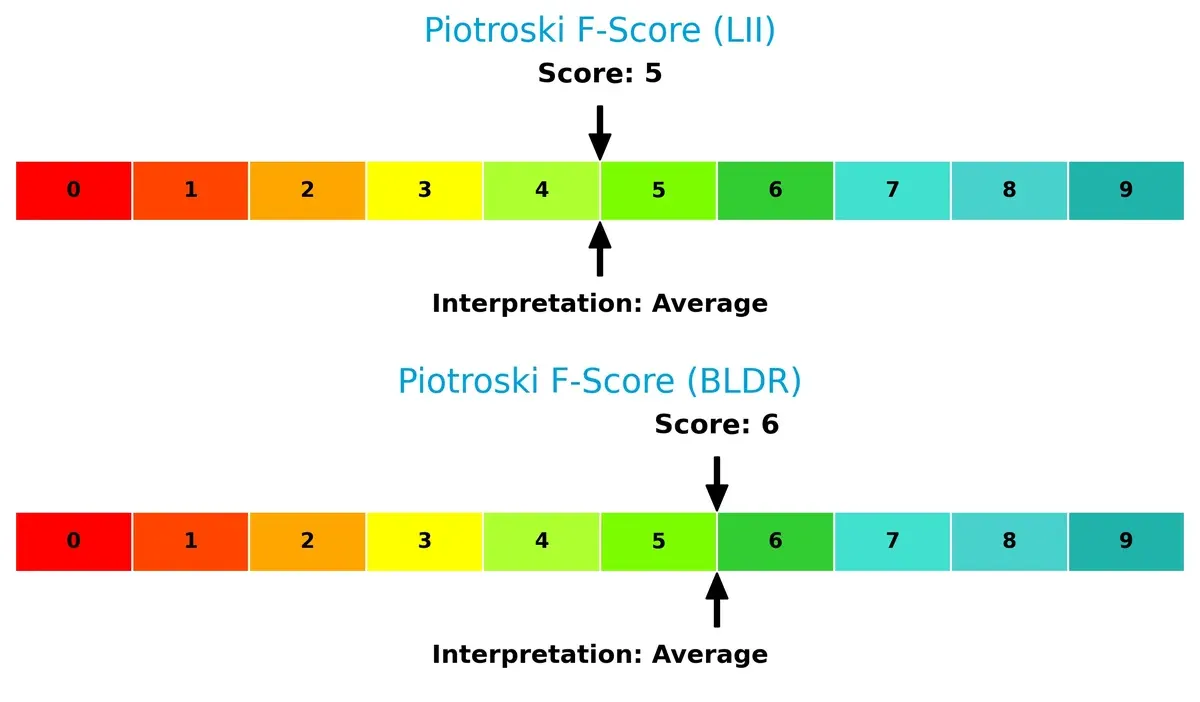
Financial Health: Quality of Operations
Builders FirstSource holds a slight edge with a Piotroski F-Score of 6 versus Lennox International’s 5, indicating marginally stronger internal financial health. Neither firm raises immediate red flags, but Builders FirstSource shows better operational quality and efficiency:
How are the two companies positioned?
This section dissects the operational DNA of LII and BLDR by comparing their revenue distribution by segment alongside their core strengths and weaknesses. The final goal is to confront their economic moats to determine which business model offers the most resilient, sustainable competitive advantage today.
Revenue Segmentation: The Strategic Mix
This visual comparison dissects how Lennox International Inc. and Builders FirstSource, Inc. diversify their income streams and where their primary sector bets lie:
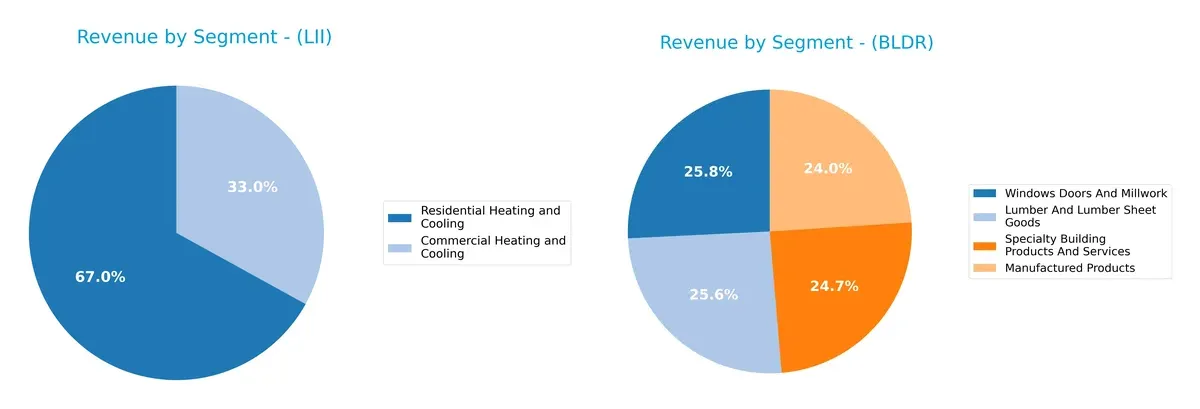
Lennox International anchors revenue in Residential Heating and Cooling with $3.58B in 2024, supported by Commercial Heating and Cooling at $1.76B. This shows moderate concentration but diversified HVAC exposure. Builders FirstSource commands a more balanced portfolio, with each segment near $4.2B in 2024, illustrating a highly diversified building products mix. Lennox pivots on HVAC dominance, exposing it to sector cycles, while Builders FirstSource mitigates risk across lumber, manufacturing, and specialty products.
Strengths and Weaknesses Comparison
This table compares the Strengths and Weaknesses of Lennox International Inc. and Builders FirstSource, Inc.:
Lennox International Inc. Strengths
- Strong profitability with 15.13% net margin
- High ROE at 67.6% and ROIC of 25.51%
- Solid asset turnover ratios
- Diverse product segments in heating, cooling, and refrigeration
- Moderate global presence with some international revenue
Builders FirstSource, Inc. Strengths
- Balanced profitability with favorable ROE (25.09%) and ROIC (13.9%)
- Higher current and quick ratios indicating liquidity
- Strong asset and fixed asset turnover
- Broad product diversification in lumber, manufacturing, and specialty building products
- Significant regional presence across US segments
Lennox International Inc. Weaknesses
- Elevated debt levels with 50.57% debt-to-assets
- Unfavorable quick ratio (0.63) and high debt/equity (1.77)
- Price-to-book ratio is high at 14.57, suggesting valuation risk
- Limited international revenue compared to domestic sales
Builders FirstSource, Inc. Weaknesses
- Lower net margin at 6.57%, reflecting tighter profitability
- Debt/equity ratio still elevated at 1.01
- No dividend yield, which may deter income-focused investors
- Neutral debt-to-assets ratio at 40.94%, requiring monitoring
Lennox International excels in profitability and product diversification but faces leverage and valuation challenges. Builders FirstSource shows balanced liquidity and product spread but contends with lower margins and modest debt risks. These factors shape each company’s strategic financial priorities.
The Moat Duel: Analyzing Competitive Defensibility
A strong structural moat protects long-term profits from relentless competition erosion. Here’s how Lennox International and Builders FirstSource stack up:
Lennox International Inc.: Intangible Assets and Brand Strength
Lennox leverages decades of brand trust and proprietary HVAC technologies. Its 15% net margin and 17% ROIC confirm efficient capital use. However, a recent 26% ROIC decline signals margin pressure in 2026 amid cooling demand.
Builders FirstSource, Inc.: Scale and Cost Advantage
Builders FirstSource capitalizes on scale and integrated supply chains, driving a growing ROIC now 4.5% above WACC. Despite lower margins (6.6%), its improving profitability and expansive US footprint suggest deepening moat through operational leverage in 2026.
Scale Economies vs. Brand Legacy: Who Defends Better?
Builders FirstSource exhibits a wider moat with rising returns and cost efficiencies fueling growth. Lennox’s higher profitability faces headwinds, weakening its moat depth. I see Builders FirstSource better positioned to defend and expand market share in a competitive construction landscape.
Which stock offers better returns?
Over the past year, Lennox International Inc. showed steady gains with accelerating growth, while Builders FirstSource, Inc. experienced a sharp decline despite a recent partial rebound.
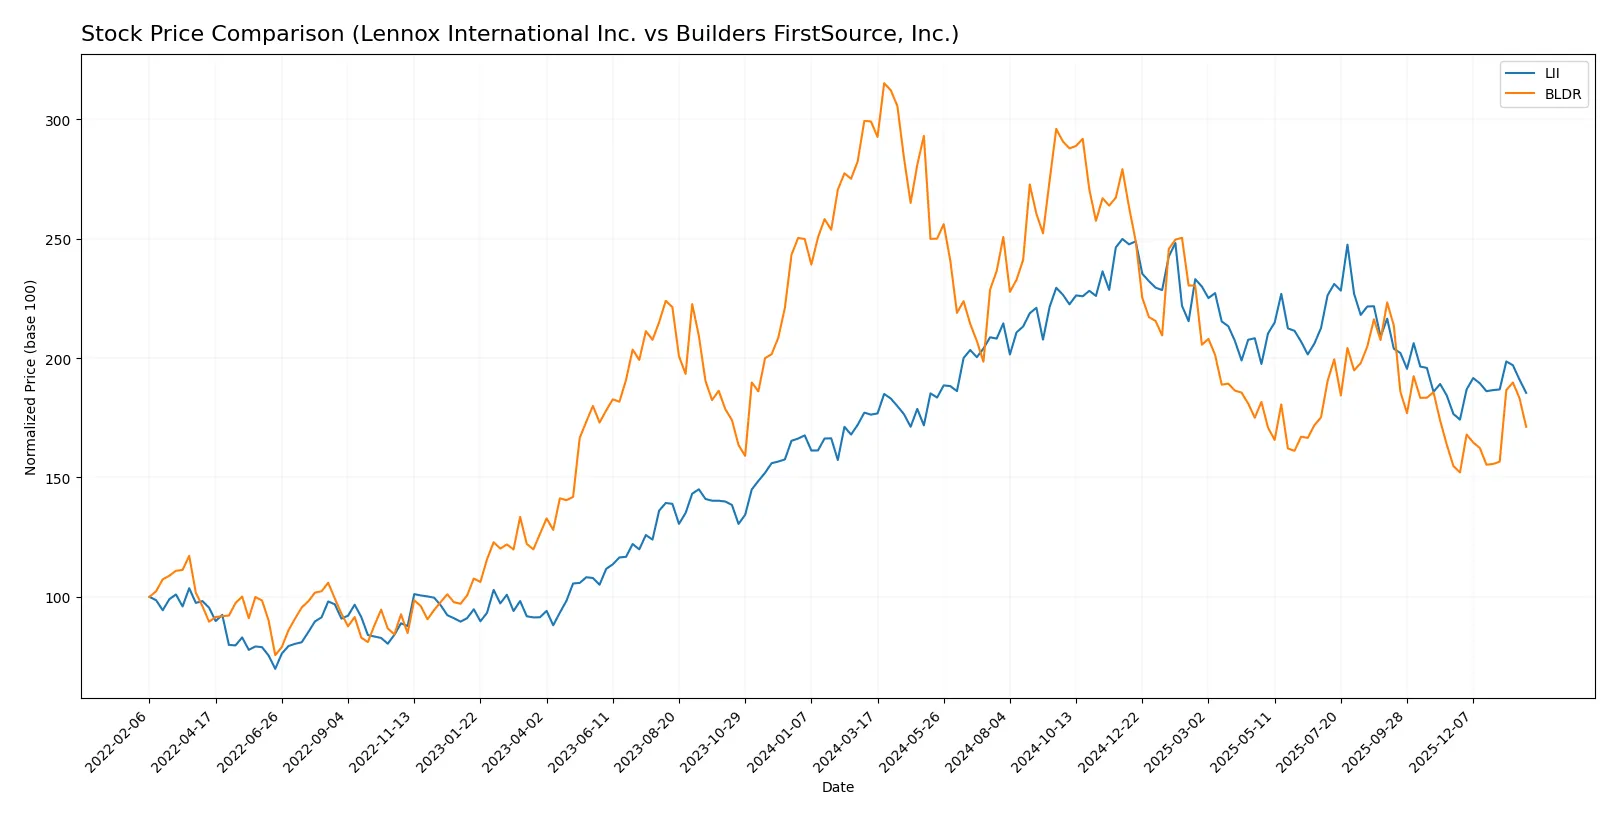
Trend Comparison
Lennox International’s stock rose 5.17% over 12 months, confirming a bullish trend with accelerating momentum and a high of 667.13. Volatility is notable with a 53.8 standard deviation.
Builders FirstSource declined 42.75% over the same period, marking a bearish trend with accelerating losses. The stock recently gained 10.6%, showing some recovery but remains volatile with a 29.71 standard deviation.
Lennox International delivered the highest market performance with steady positive returns, while Builders FirstSource suffered a large decline despite recent gains.
Target Prices
Analysts present a clear target consensus for Lennox International Inc. and Builders FirstSource, Inc.
| Company | Target Low | Target High | Consensus |
|---|---|---|---|
| Lennox International Inc. | 475 | 667 | 557.5 |
| Builders FirstSource, Inc. | 109.41 | 145 | 128.64 |
The Lennox consensus target of 557.5 suggests upside potential from the current 495.08 price. Builders FirstSource’s consensus at 128.64 implies a meaningful premium over its 114.4 share price.

Don’t Let Luck Decide Your Entry Point
Optimize your entry points with our advanced ProRealTime indicators. You’ll get efficient buy signals with precise price targets for maximum performance. Start outperforming now!
How do institutions grade them?
Here is a summary of recent institutional grades for Lennox International Inc. and Builders FirstSource, Inc.:
Lennox International Inc. Grades
The following table shows recent grades from reliable financial institutions for Lennox International Inc.:
| Grading Company | Action | New Grade | Date |
|---|---|---|---|
| Wells Fargo | Maintain | Equal Weight | 2026-01-29 |
| RBC Capital | Maintain | Sector Perform | 2026-01-29 |
| JP Morgan | Maintain | Underweight | 2026-01-16 |
| Barclays | Maintain | Overweight | 2026-01-07 |
| Barclays | Maintain | Overweight | 2025-12-11 |
| Wells Fargo | Maintain | Equal Weight | 2025-12-04 |
| Wolfe Research | Upgrade | Peer Perform | 2025-11-13 |
| UBS | Maintain | Neutral | 2025-10-27 |
| Morgan Stanley | Maintain | Underweight | 2025-10-23 |
| Barclays | Maintain | Overweight | 2025-10-23 |
Builders FirstSource, Inc. Grades
The following table shows recent grades from reliable financial institutions for Builders FirstSource, Inc.:
| Grading Company | Action | New Grade | Date |
|---|---|---|---|
| Stephens & Co. | Downgrade | Equal Weight | 2026-01-20 |
| Barclays | Maintain | Overweight | 2026-01-15 |
| UBS | Maintain | Buy | 2026-01-06 |
| Stifel | Maintain | Hold | 2025-12-16 |
| Jefferies | Downgrade | Hold | 2025-12-15 |
| Barclays | Maintain | Overweight | 2025-12-08 |
| DA Davidson | Maintain | Neutral | 2025-11-03 |
| Zelman & Assoc | Upgrade | Neutral | 2025-10-31 |
| UBS | Maintain | Buy | 2025-10-31 |
| Barclays | Maintain | Overweight | 2025-10-31 |
Which company has the best grades?
Builders FirstSource holds generally higher grades, including multiple Buy ratings from UBS and consistent Overweight ratings from Barclays. Lennox International shows more mixed ratings, ranging from Underweight to Overweight. Investors may perceive Builders FirstSource as more favored by analysts, potentially impacting sentiment and demand.
Risks specific to each company
The following categories identify critical pressure points and systemic threats facing both firms in the 2026 market environment:
1. Market & Competition
Lennox International Inc.
- Operates in HVAC and refrigeration, facing innovation and efficiency demands.
Builders FirstSource, Inc.
- Competes in building materials, pressured by supply-demand fluctuations and price sensitivity.
2. Capital Structure & Debt
Lennox International Inc.
- High debt-to-equity ratio (1.77) signals leveraged balance sheet risk.
Builders FirstSource, Inc.
- Moderate leverage (debt-to-equity 1.01) but still flagged as unfavorable.
3. Stock Volatility
Lennox International Inc.
- Beta of 1.18 indicates moderate market sensitivity.
Builders FirstSource, Inc.
- Higher beta at 1.57 indicates greater stock price volatility risk.
4. Regulatory & Legal
Lennox International Inc.
- Subject to environmental and safety regulations in HVAC and refrigeration sectors.
Builders FirstSource, Inc.
- Faces regulatory scrutiny on construction materials and installation services compliance.
5. Supply Chain & Operations
Lennox International Inc.
- Relies on global supply chains for components, vulnerable to disruptions.
Builders FirstSource, Inc.
- Supply chain complexity across lumber and manufactured products increases operational risk.
6. ESG & Climate Transition
Lennox International Inc.
- Pressure to innovate energy-efficient products amid rising ESG standards.
Builders FirstSource, Inc.
- Faces challenges sourcing sustainable materials and reducing carbon footprint.
7. Geopolitical Exposure
Lennox International Inc.
- International sales expose it to trade tensions and tariffs.
Builders FirstSource, Inc.
- Primarily US-focused, less exposed but vulnerable to domestic policy shifts.
Which company shows a better risk-adjusted profile?
Lennox’s most impactful risk is its high leverage, threatening financial flexibility despite strong profitability. Builders FirstSource faces higher stock volatility and supply chain complexity. Both show moderate financial health, but Lennox’s superior Altman Z-score (7.49 vs. 2.93) suggests a safer bankruptcy risk profile. Recent leverage concerns for Lennox warrant caution, yet Builders FirstSource’s higher beta and supply risks tilt the risk-adjusted edge to Lennox.
Final Verdict: Which stock to choose?
Lennox International Inc. (LII) excels as a cash-generating powerhouse with a strong return on equity and invested capital, signaling efficient capital allocation. Its main point of vigilance is its rising leverage, which could pressure financial flexibility. LII suits investors seeking aggressive growth fueled by operational strength.
Builders FirstSource, Inc. (BLDR) boasts a durable moat anchored in its growing ROIC and robust asset turnover, reflecting operational efficiency and competitive positioning. It offers a comparatively safer profile than LII, with steadier liquidity and moderate leverage. BLDR fits well into a GARP portfolio aiming for growth balanced with reasonable risk.
If you prioritize aggressive expansion and superior capital returns, Lennox International outshines with its profitability and cash conversion. However, if you seek better stability and a durable competitive advantage amid market volatility, Builders FirstSource offers a superior risk-adjusted profile. Both present analytical scenarios aligned with distinct investor strategies.
Disclaimer: Investment carries a risk of loss of initial capital. The past performance is not a reliable indicator of future results. Be sure to understand risks before making an investment decision.
Go Further
I encourage you to read the complete analyses of Lennox International Inc. and Builders FirstSource, Inc. to enhance your investment decisions: