Home > Comparison > Industrials > CARR vs BLDR
The strategic rivalry between Carrier Global Corporation and Builders FirstSource, Inc. shapes the competitive landscape of the Industrials sector. Carrier excels as a technology-driven HVAC and building automation provider, while Builders FirstSource leads as a comprehensive supplier of building materials and construction services. This head-to-head contrasts innovation with scale in construction. This analysis aims to identify which company offers superior risk-adjusted returns for a diversified portfolio in 2026.
Table of contents
Companies Overview
Carrier Global Corporation and Builders FirstSource, Inc. hold pivotal roles in the U.S. construction industry, shaping infrastructure and building trends.
Carrier Global Corporation: HVAC and Building Technologies Leader
Carrier Global Corporation dominates the HVAC and refrigeration market, generating revenue through heating, cooling, ventilation, and building automation systems. Its 2026 strategy emphasizes expanding digital solutions and integrating fire and security technologies, reinforcing its comprehensive service offering. Carrier’s broad product portfolio spans residential and commercial sectors, underlining its competitive advantage in technological innovation.
Builders FirstSource, Inc.: Building Materials and Services Specialist
Builders FirstSource, Inc. leads in supplying building materials and construction services to homebuilders and remodelers. It profits from lumber, engineered wood products, and turnkey framing services. In 2026, Builders FirstSource focuses on enhancing its manufacturing capabilities and expanding its product range, leveraging operational scale to meet rising U.S. residential construction demand.
Strategic Collision: Similarities & Divergences
Carrier pursues a technology-driven, integrated solutions model, while Builders FirstSource emphasizes scale and manufacturing in building materials. They compete primarily in the residential and commercial construction supply chains, yet their business models diverge markedly. Carrier’s innovation-centric approach contrasts with Builders FirstSource’s volume-driven strategy, creating distinct risk and growth profiles for investors.
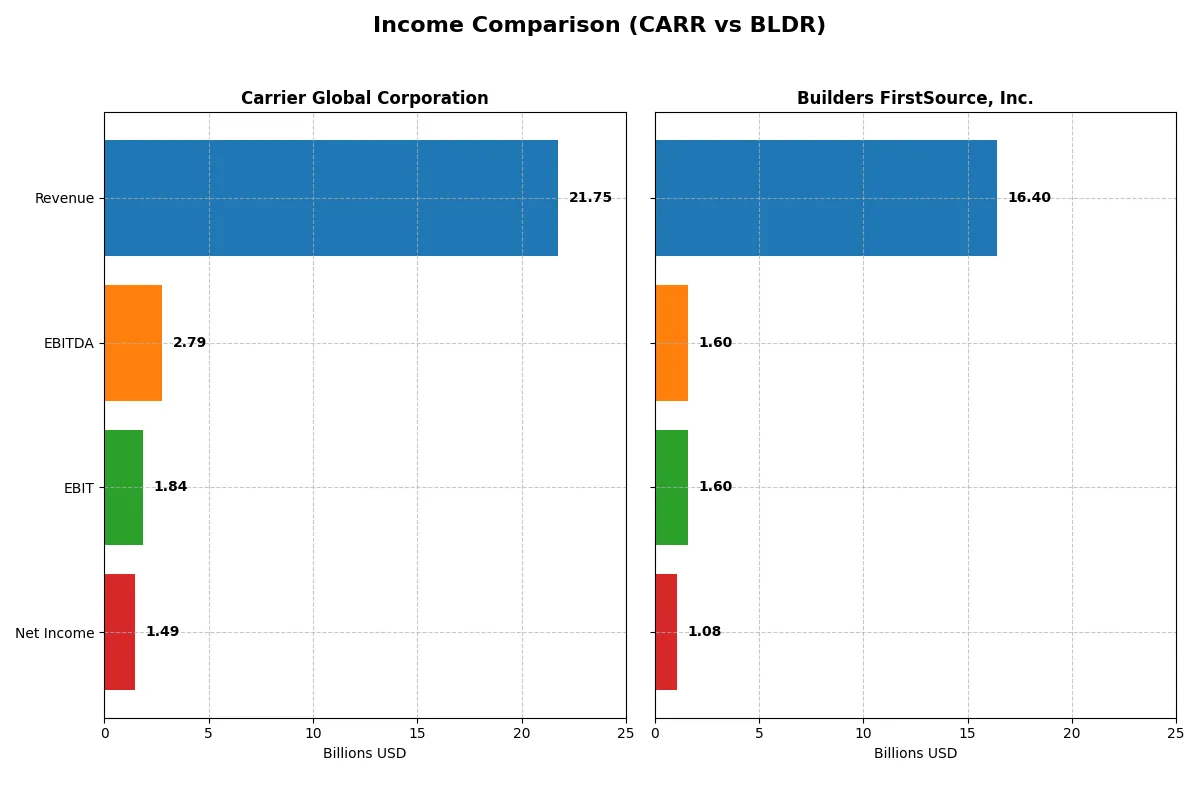
Income Statement Comparison
This data dissects the core profitability and scalability of both corporate engines to reveal who dominates the bottom line:
| Metric | Carrier Global Corporation (CARR) | Builders FirstSource, Inc. (BLDR) |
|---|---|---|
| Revenue | 21.7B | 16.4B |
| Cost of Revenue | 16.1B | 11.0B |
| Operating Expenses | 3.48B | 3.79B |
| Gross Profit | 5.63B | 5.38B |
| EBITDA | 2.79B | 1.60B |
| EBIT | 1.84B | 1.60B |
| Interest Expense | 345M | 208M |
| Net Income | 1.49B | 1.08B |
| EPS | 1.74 | 9.13 |
| Fiscal Year | 2025 | 2024 |
Income Statement Analysis: The Bottom-Line Duel
This income statement comparison exposes which company operates with superior efficiency and delivers stronger profitability.
Carrier Global Corporation Analysis
Carrier’s revenue grew modestly over 2021-2025 but declined 3.3% in 2025, hitting $21.7B. Its net income fell sharply by 72% in 2025 to $1.48B. Gross margin remains solid near 26%, but net margin contracted to 6.9%, signaling pressure on profitability. The latest year shows weakening momentum and margin compression.
Builders FirstSource, Inc. Analysis
Builders FirstSource achieved strong revenue growth of 91.6% over 2020-2024, despite a 4.1% dip in 2024 to $16.4B. Net income rose 244% over the period, though it declined 27% in 2024 to $1.08B. Gross margin stands higher at 32.8%, with net margin steady near 6.6%. Recent results show healthy operational leverage despite short-term setbacks.
Margin Strength vs. Growth Resilience
Builders FirstSource outperforms Carrier in long-term revenue and net income growth, supported by superior gross margins. Carrier maintains a larger scale but faces declining margins and earnings. For investors, Builders FirstSource’s growth trajectory and margin expansion offer a more attractive fundamental profile, while Carrier’s recent margin erosion signals caution.
Financial Ratios Comparison
These vital ratios act as a diagnostic tool to expose the underlying fiscal health, valuation premiums, and capital efficiency of the companies compared below:
| Ratios | Carrier Global Corporation (CARR) | Builders FirstSource, Inc. (BLDR) |
|---|---|---|
| ROE | 10.82% | 25.09% |
| ROIC | 5.84% | 13.90% |
| P/E | 29.7x | 15.65x |
| P/B | 3.21x | 3.93x |
| Current Ratio | 1.20 | 1.77 |
| Quick Ratio | 0.85 | 1.09 |
| D/E (Debt-to-Equity) | 0.92 | 1.01 |
| Debt-to-Assets | 34.07% | 40.94% |
| Interest Coverage | 6.23x | 7.68x |
| Asset Turnover | 0.58 | 1.55 |
| Fixed Asset Turnover | 5.86 | 6.42 |
| Payout Ratio | 51.71% | 0% |
| Dividend Yield | 1.74% | 0% |
| Fiscal Year | 2025 | 2024 |
Efficiency & Valuation Duel: The Vital Signs
Financial ratios serve as a company’s DNA, uncovering hidden risks and highlighting operational excellence beneath surface numbers.
Carrier Global Corporation
Carrier posts a neutral 10.8% ROE and modest 6.9% net margin, showing stable but unspectacular profitability. Its elevated 29.7 P/E and 3.21 P/B ratios signal an expensive valuation, stretching investor expectations. Carrier offers a 1.74% dividend yield, balancing shareholder returns with steady reinvestment in R&D at 2.87% of revenue.
Builders FirstSource, Inc.
Builders FirstSource impresses with a strong 25.1% ROE and 6.6% net margin, indicating efficient capital use and profitability. The stock trades at a reasonable 15.7 P/E but a high 3.93 P/B, reflecting mixed valuation signals. It pays no dividend, focusing capital on growth and maintaining a favorable free cash flow yield of 8.8%.
Valuation Discipline vs. Operational Efficiency
Builders FirstSource offers superior profitability and operational efficiency with a more balanced valuation profile. Carrier’s premium multiples contrast its middling returns, implying higher risk for reward. Investors seeking growth with disciplined capital use may prefer Builders, while those valuing income and stability might lean toward Carrier.
Which one offers the Superior Shareholder Reward?
Carrier Global Corporation (CARR) delivers steady dividends with a 1.74% yield and a moderate 52% payout ratio in 2025, supported by strong free cash flow coverage (1.79x). Builders FirstSource, Inc. (BLDR) pays no dividends but aggressively returns capital via buybacks, boasting a robust free cash flow per share of $12.6B and an operating cash flow ratio above 1.0, indicating solid liquidity. BLDR’s buyback intensity and reinvestment in growth, paired with its lower price-to-earnings ratio (~15.7 vs. CARR’s 29.7), suggest a more sustainable and higher total return profile in 2026. I favor BLDR’s distribution philosophy for superior long-term shareholder rewards.
Comparative Score Analysis: The Strategic Profile
The radar chart reveals the fundamental DNA and trade-offs of Carrier Global Corporation and Builders FirstSource, Inc.:

Builders FirstSource leads with a stronger overall score of 3 versus Carrier’s 2, driven by a very favorable discounted cash flow score of 5 versus 3. Builders exhibits better return on equity (4 vs. 3), while both match on return on assets (3). Both firms share weak debt-to-equity scores (1), signaling elevated leverage risk. Valuation metrics (P/E and P/B) are equally unfavorable for both. Builders FirstSource presents a more balanced profile, while Carrier relies on moderate operational returns but struggles with financial leverage.
Bankruptcy Risk: Solvency Showdown
Builders FirstSource posts a slightly higher Altman Z-Score of 2.94 compared to Carrier’s 2.61, both residing in the grey zone of moderate distress risk:
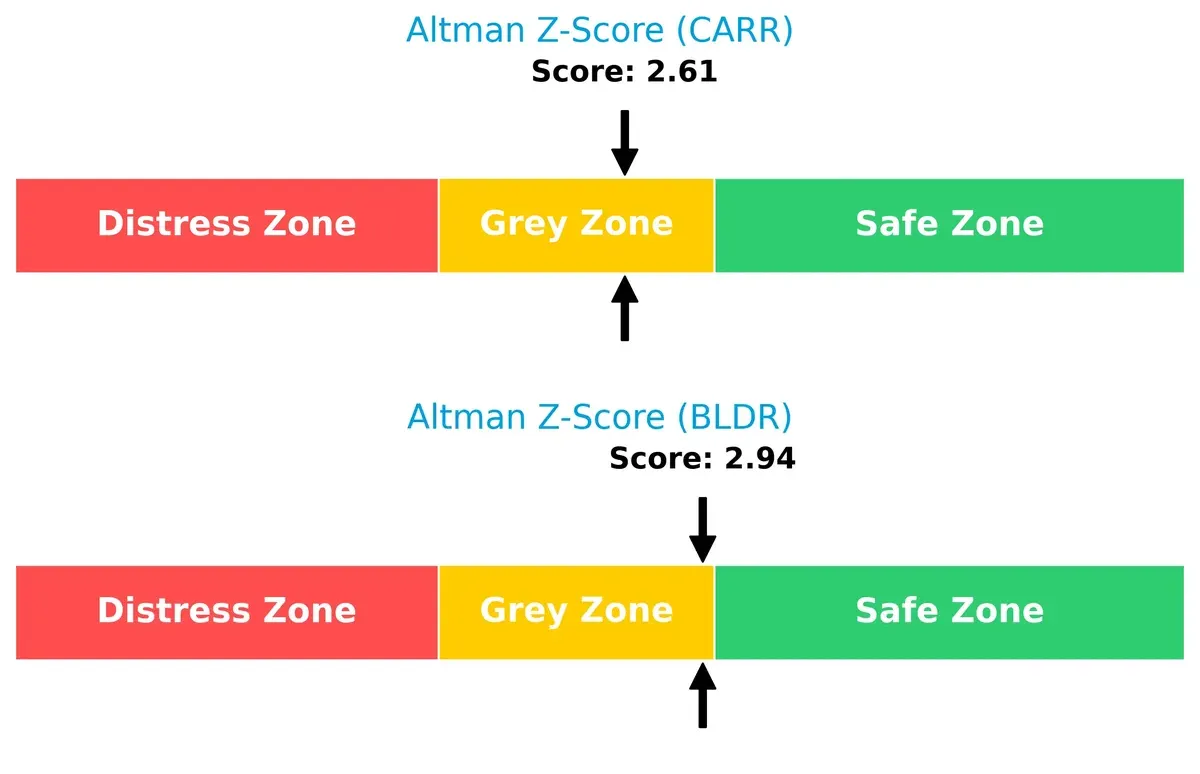
This suggests both companies face moderate bankruptcy risk in this cycle. Builders holds a marginally safer solvency position, but investors should remain vigilant due to their proximity to financial distress thresholds.
Financial Health: Quality of Operations
Both companies share identical Piotroski F-Scores of 6, indicating average financial health with no immediate red flags in internal metrics:
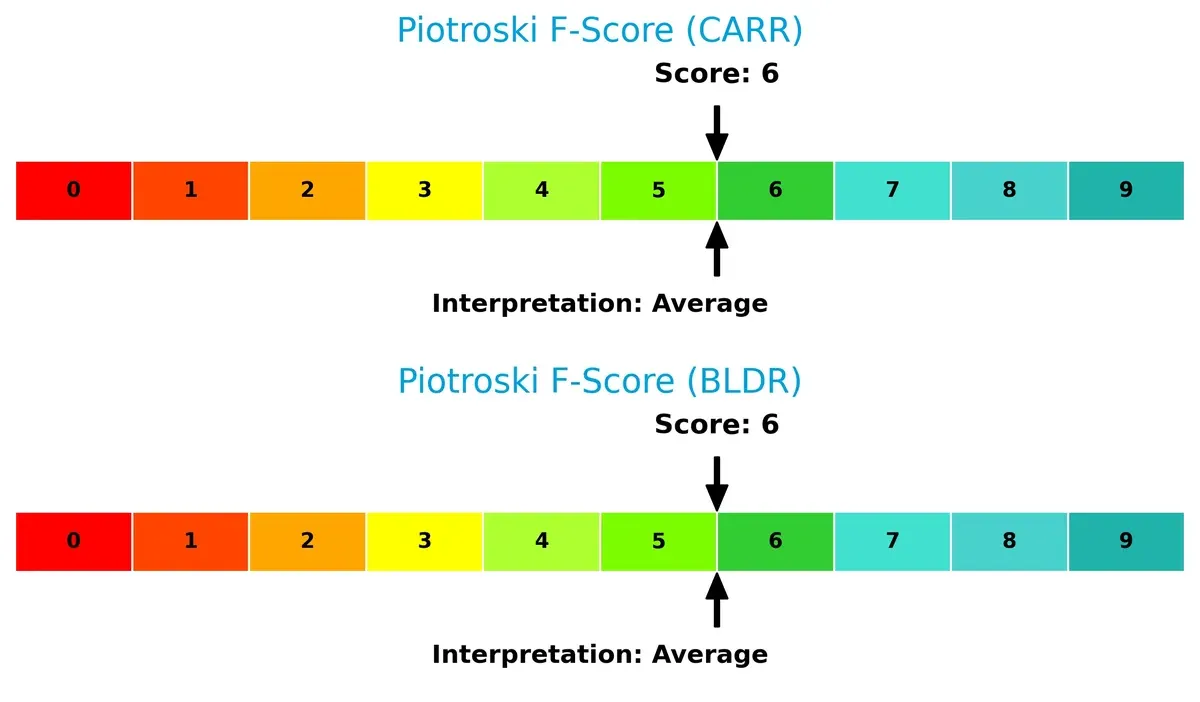
Neither Carrier nor Builders FirstSource demonstrates peak financial robustness. Investors should monitor operational efficiency and profitability trends closely to avoid deterioration in financial quality.
How are the two companies positioned?
This section dissects Carrier and Builders FirstSource’s operational DNA by comparing their revenue distribution and internal dynamics. The goal is to confront their economic moats and identify which model offers the most resilient competitive advantage today.
Revenue Segmentation: The Strategic Mix
This visual comparison dissects how Carrier Global Corporation and Builders FirstSource, Inc. diversify their income streams and where their primary sector bets lie:
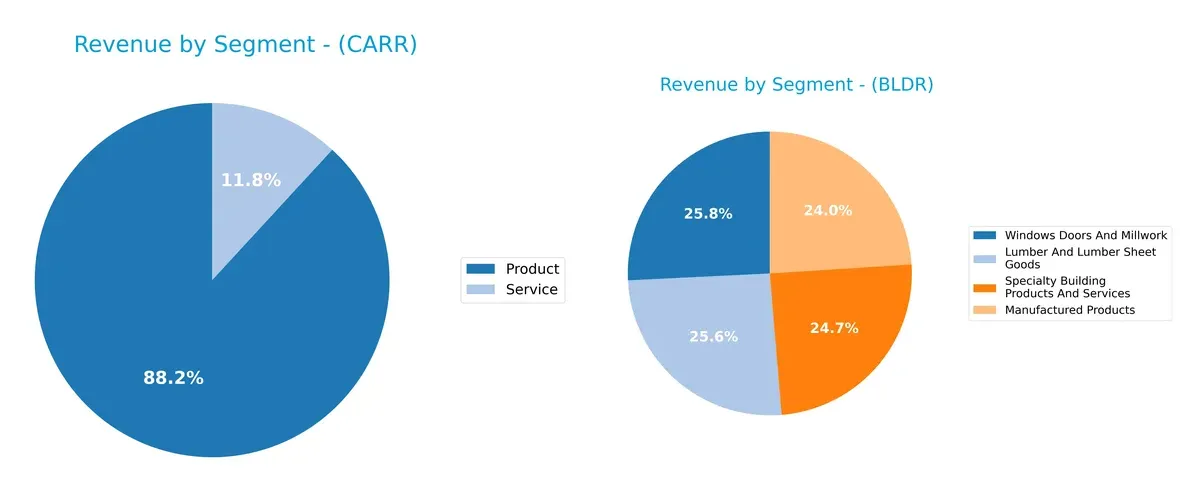
Carrier Global dwarfs Builders FirstSource in total revenue but anchors 88% of its 2025 sales in Products, with Services contributing only 2.6B. Builders FirstSource displays a more balanced mix across four segments, each near 4B in 2024 revenue. Carrier’s heavy product reliance signals concentration risk but benefits from ecosystem lock-in. Builders FirstSource’s segmentation suggests infrastructure dominance and reduced volatility from diversified construction materials.
Strengths and Weaknesses Comparison
This table compares the strengths and weaknesses of Carrier Global Corporation (CARR) and Builders FirstSource, Inc. (BLDR):
CARR Strengths
- Diverse revenue from Products and Services totaling 21.9B USD
- Solid global presence with 11.1B USD US and 10.4B USD international sales
- Favorable interest coverage and fixed asset turnover ratios
BLDR Strengths
- Strong profitability with 25.1% ROE and 13.9% ROIC
- Favorable liquidity ratios: current 1.77 and quick 1.09
- High asset and fixed asset turnover
- Well-diversified building products segments
CARR Weaknesses
- Unfavorable valuation multiples: PE 29.7, PB 3.21
- Neutral profitability with net margin 6.9% and ROIC below WACC
- Moderate liquidity ratios, quick ratio 0.85 below 1
- Debt-to-equity near 1 signals moderate leverage
BLDR Weaknesses
- Unfavorable PB 3.93 and zero dividend yield
- Slightly higher debt-to-equity at 1.01
- Lower net margin 6.6% compared to ROE, indicating possible leverage effects
- Limited geographic presence confined to US regions
Both companies show solid diversification but differ in financial profiles. CARR leverages its global footprint, while BLDR excels in profitability and asset efficiency but faces higher leverage and limited geographic scope. This contrast shapes their strategic focus on innovation, risk management, and market expansion.
The Moat Duel: Analyzing Competitive Defensibility
A structural moat is the only reliable shield protecting long-term profits from relentless competition and market pressure:
Carrier Global Corporation: Intangible Assets and Brand Strength
Carrier relies heavily on its extensive portfolio of patented HVAC and refrigeration technologies. This moat shows up as stable margins but declining ROIC signals creeping value erosion. New digital automation solutions in 2026 could either deepen its moat or face disruption risk.
Builders FirstSource, Inc.: Operational Scale and Efficient Capital Allocation
Builders FirstSource’s moat stems from scale-driven cost advantages and efficient capital use, reflected in a strong, growing ROIC well above WACC. Unlike Carrier, it turns rising profitability into sustained value creation. Expansion in turnkey construction services offers fresh growth avenues in 2026.
Efficiency and Innovation: Scale vs. Intangible Assets
Builders FirstSource holds a wider and deeper moat, demonstrated by consistent ROIC growth and value creation. Carrier’s declining profitability warns of structural challenges. Builders FirstSource is better positioned to defend and expand market share amid industry shifts.
Which stock offers better returns?
Over the past 12 months, Carrier Global Corporation surged 12.04%, showing accelerating momentum, while Builders FirstSource, Inc. declined 36.35% despite recent short-term gains.
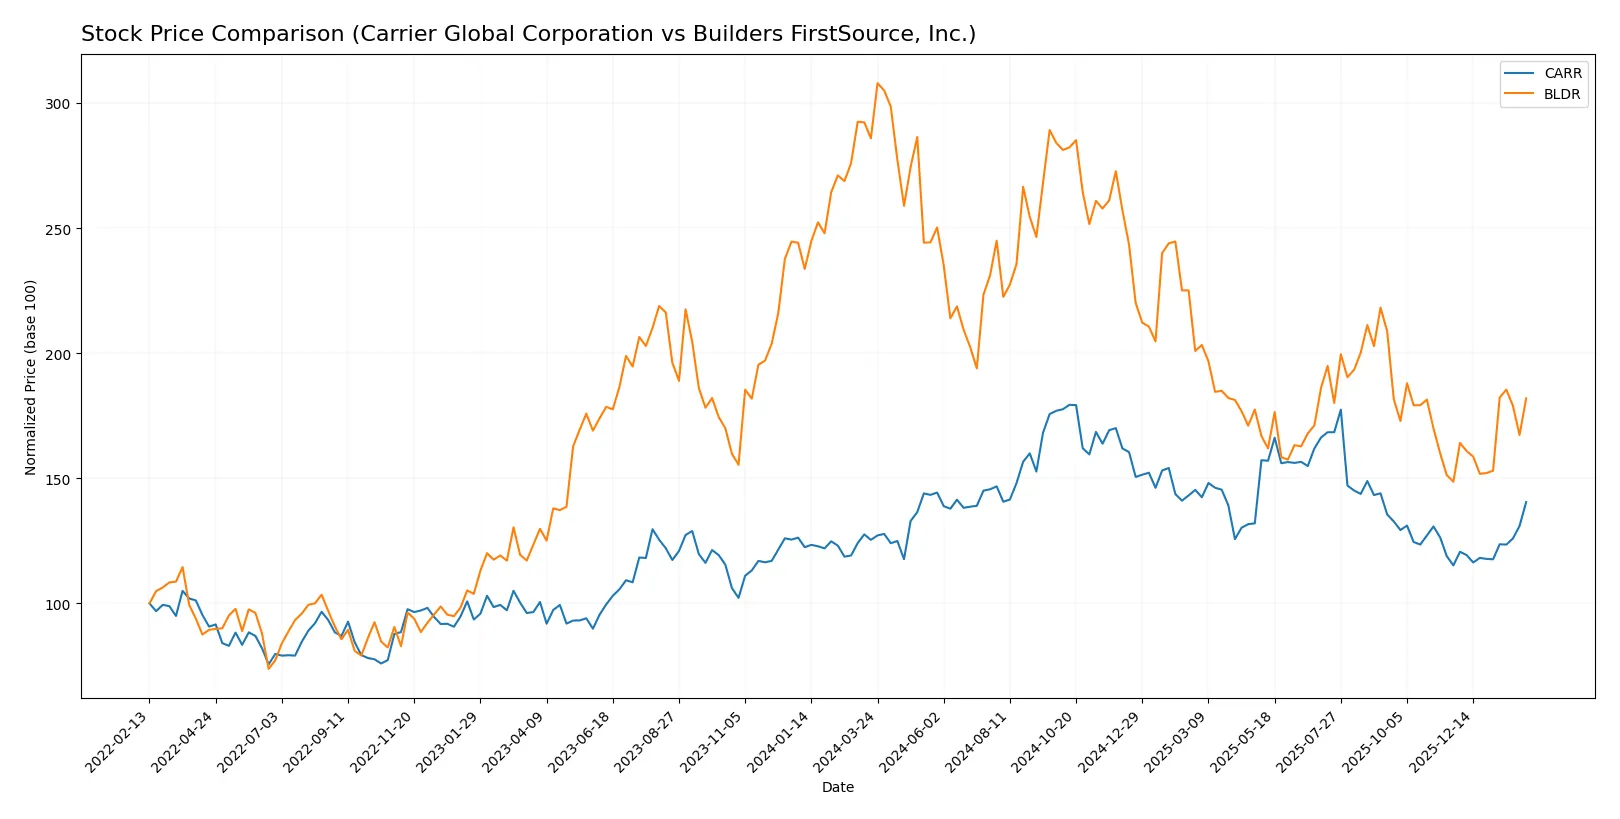
Trend Comparison
Carrier Global’s stock rose 12.04% over the last year, marking a bullish trend with accelerating price increases and a standard deviation of 7.59. The price ranged between 52.41 and 81.61.
Builders FirstSource’s stock dropped 36.35% over the same period, indicating a bearish trend with accelerating losses and a high volatility level of 29.3. The price fluctuated from 101.62 to 210.54.
Comparing both, Carrier Global delivered the highest market performance over the past year, showing sustained strength while Builders FirstSource faced significant declines despite recent recovery signs.
Target Prices
Analysts present a confident target price consensus for both Carrier Global Corporation and Builders FirstSource, Inc.
| Company | Target Low | Target High | Consensus |
|---|---|---|---|
| Carrier Global Corporation | 55 | 74 | 67.88 |
| Builders FirstSource, Inc. | 109.41 | 145 | 128.24 |
Carrier’s consensus target price of 67.88 suggests modest upside from the current 63.92. Builders FirstSource’s consensus of 128.24 indicates a strong potential gain from 124.42.

Don’t Let Luck Decide Your Entry Point
Optimize your entry points with our advanced ProRealTime indicators. You’ll get efficient buy signals with precise price targets for maximum performance. Start outperforming now!
How do institutions grade them?
Here are the recent institutional grades for Carrier Global Corporation and Builders FirstSource, Inc.:
Carrier Global Corporation Grades
The table below summarizes Carrier’s latest ratings from major grading firms.
| Grading Company | Action | New Grade | Date |
|---|---|---|---|
| Citigroup | Maintain | Buy | 2026-02-06 |
| RBC Capital | Maintain | Outperform | 2026-02-06 |
| Wells Fargo | Maintain | Equal Weight | 2026-02-06 |
| JP Morgan | Maintain | Neutral | 2026-01-16 |
| Citigroup | Maintain | Buy | 2026-01-12 |
| Mizuho | Maintain | Outperform | 2026-01-05 |
| UBS | Maintain | Buy | 2026-01-05 |
| Barclays | Maintain | Overweight | 2025-12-10 |
| RBC Capital | Maintain | Outperform | 2025-12-05 |
| Wells Fargo | Maintain | Equal Weight | 2025-12-04 |
Builders FirstSource, Inc. Grades
Below is a summary of Builders FirstSource’s current grades from recognized institutions.
| Grading Company | Action | New Grade | Date |
|---|---|---|---|
| DA Davidson | Maintain | Neutral | 2026-02-02 |
| Stephens & Co. | Downgrade | Equal Weight | 2026-01-20 |
| Barclays | Maintain | Overweight | 2026-01-15 |
| UBS | Maintain | Buy | 2026-01-06 |
| Stifel | Maintain | Hold | 2025-12-16 |
| Jefferies | Downgrade | Hold | 2025-12-15 |
| Barclays | Maintain | Overweight | 2025-12-08 |
| DA Davidson | Maintain | Neutral | 2025-11-03 |
| UBS | Maintain | Buy | 2025-10-31 |
| Barclays | Maintain | Overweight | 2025-10-31 |
Which company has the best grades?
Carrier Global Corporation consistently receives Buy and Outperform ratings from several top firms, signaling stronger institutional confidence. Builders FirstSource shows more mixed grades, including downgrades and Neutral or Hold ratings. This divergence may affect investor sentiment and portfolio positioning.
Risks specific to each company
The following categories identify critical pressure points and systemic threats facing Carrier Global Corporation and Builders FirstSource, Inc. in the 2026 market environment:
1. Market & Competition
Carrier Global Corporation
- Operates in HVAC and refrigeration, facing intense global competition and innovation pressure.
Builders FirstSource, Inc.
- Competes in building materials with strong regional rivals and fluctuating housing demand.
2. Capital Structure & Debt
Carrier Global Corporation
- Moderate debt with a debt-to-assets ratio of 34.1%, interest coverage at 5.33x, signaling manageable leverage.
Builders FirstSource, Inc.
- Higher leverage, debt-to-assets at 40.9%, but stronger interest coverage at 7.68x; riskier debt profile.
3. Stock Volatility
Carrier Global Corporation
- Beta at 1.34 indicates moderate sensitivity to market swings.
Builders FirstSource, Inc.
- Higher beta of 1.55 shows greater stock price volatility and risk exposure.
4. Regulatory & Legal
Carrier Global Corporation
- Subject to environmental and safety regulations in HVAC and refrigeration sectors.
Builders FirstSource, Inc.
- Faces building codes, environmental regulations, and labor laws affecting supply and costs.
5. Supply Chain & Operations
Carrier Global Corporation
- Global supply chain complexity could cause disruptions, especially in component sourcing.
Builders FirstSource, Inc.
- Supply chain tied closely to lumber and raw materials, vulnerable to pricing and availability swings.
6. ESG & Climate Transition
Carrier Global Corporation
- Increasing pressure to improve energy efficiency and reduce carbon footprint in HVAC products.
Builders FirstSource, Inc.
- Needs to address sustainable sourcing and waste reduction amid rising ESG investor scrutiny.
7. Geopolitical Exposure
Carrier Global Corporation
- Global operations expose it to trade tensions and tariffs affecting manufacturing and sales.
Builders FirstSource, Inc.
- Primarily US-focused, limiting direct geopolitical risks but sensitive to domestic policy shifts.
Which company shows a better risk-adjusted profile?
Builders FirstSource faces higher leverage and more volatile stock but delivers stronger returns on equity and invested capital, indicating efficient capital use. Carrier Global’s moderate leverage and stable operations come with valuation concerns and a lower interest coverage ratio. Carrier’s Altman Z-Score at 2.61 and Builders FirstSource’s at 2.94 place both in the grey zone for bankruptcy risk, but Builders FirstSource’s stronger capital efficiency and interest coverage tilt the risk-adjusted profile slightly in its favor. Recent data on Builders FirstSource’s superior ROIC (13.9% vs. 5.8%) underscores its better financial resilience despite elevated leverage.
Final Verdict: Which stock to choose?
Carrier Global Corporation’s superpower lies in its operational efficiency and solid interest coverage, signaling disciplined capital use. However, its declining profitability and ROIC below WACC are points of vigilance. It fits portfolios seeking steady industrial exposure but with a tolerance for value erosion risks.
Builders FirstSource commands a strategic moat through robust return on invested capital and improving profitability, supported by a favorable debt profile. Relative to Carrier, it offers stronger value creation and income growth, suiting investors focused on growth at a reasonable price with moderate risk appetite.
If you prioritize sustainable value creation and improving returns, Builders FirstSource outshines Carrier due to its expanding moat and healthier financial metrics. However, if you seek operational stability within industrials and can withstand margin pressures, Carrier might provide a steadier, albeit challenged, income stream.
Disclaimer: Investment carries a risk of loss of initial capital. The past performance is not a reliable indicator of future results. Be sure to understand risks before making an investment decision.
Go Further
I encourage you to read the complete analyses of Carrier Global Corporation and Builders FirstSource, Inc. to enhance your investment decisions: