Brown-Forman Corporation, represented by tickers BF-A and BF-B, stands as a giant in the beverages industry, specializing in premium alcoholic products like whiskey, vodka, and champagne. Despite being part of the same company, these two classes of shares offer different investment dynamics. This comparison explores their market roles, innovation strategies, and risk profiles to help you decide which share class better fits your portfolio goals. Let’s uncover the most compelling choice for your investment.

Table of contents
Companies Overview
I will begin the comparison between Brown-Forman Corporation BF-A and BF-B by providing an overview of these two companies and their main differences.
Brown-Forman Corporation BF-A Overview
Brown-Forman Corporation BF-A operates in the beverages industry, focusing on manufacturing, distilling, bottling, importing, exporting, marketing, and selling a diverse portfolio of alcoholic beverages. Its product range includes spirits, wines, whiskey-based liqueurs, ready-to-drink cocktails, vodkas, and champagnes. The company serves retail customers, distributors, and government entities, with operations spanning the US, Germany, Australia, the UK, Mexico, and other international markets.
Brown-Forman Corporation BF-B Overview
Brown-Forman Corporation BF-B shares the same mission and market positioning as BF-A, with an emphasis on a broad assortment of alcoholic beverages, including bourbons, brandy, and liqueurs. It also engages in the sale of used barrels and provides contract bottling services. Headquartered in Louisville, Kentucky, BF-B operates globally and targets a similar client base, including retailers, wholesalers, and provincial governments across multiple countries.
Key similarities and differences
Both BF-A and BF-B represent Brown-Forman Corporation with nearly identical business models centered on premium alcoholic beverage production and distribution. They share the same CEO, employee count of 5,700, and global operational footprint. The main differences lie in their market capitalization and trading details, where BF-A has a slightly higher market cap of 12.7B USD compared to BF-B’s 12.6B USD, and BF-B experiences significantly higher trading volumes.
Income Statement Comparison
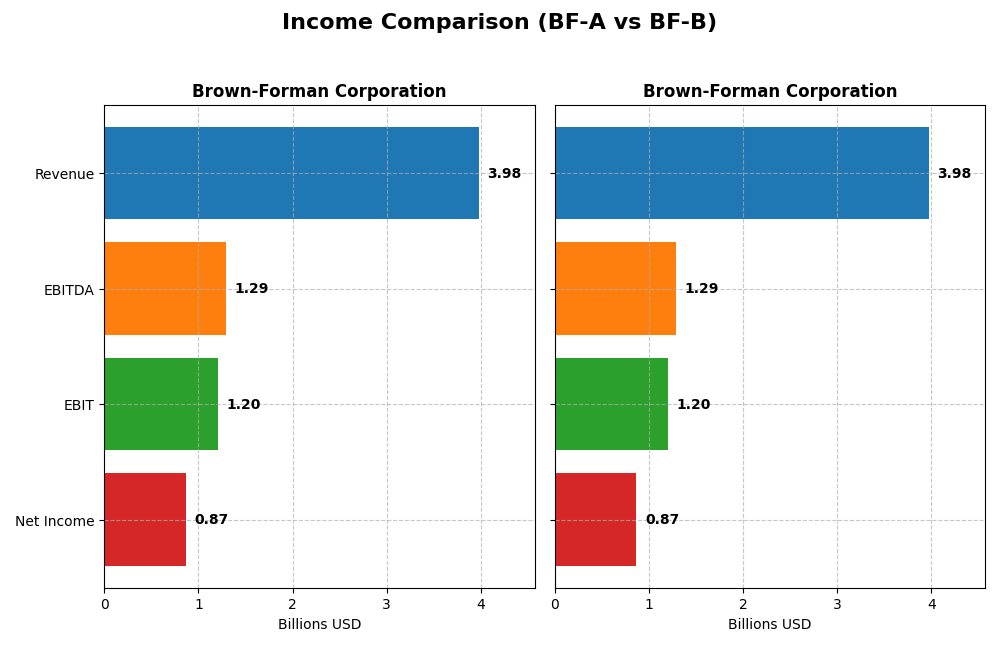
The table below presents a side-by-side comparison of key income statement metrics for Brown-Forman Corporation class A and class B shares for the fiscal year 2025.
| Metric | Brown-Forman Corporation (BF-A) | Brown-Forman Corporation (BF-B) |
|---|---|---|
| Market Cap | 12.7B | 12.6B |
| Revenue | 3.98B | 3.98B |
| EBITDA | 1.29B | 1.29B |
| EBIT | 1.20B | 1.20B |
| Net Income | 869M | 869M |
| EPS | 1.84 | 1.84 |
| Fiscal Year | 2025 | 2025 |
Income Statement Interpretations
Brown-Forman Corporation (BF-A)
Over 2021-2025, BF-A showed a revenue growth of 14.85% but a net income decline of 3.77%. Margins remain favorable, with a gross margin of 58.94% and net margin of 21.86%. However, in 2025, revenue fell 4.86%, net margin declined 10.8%, and earnings per share dropped 14.42%, indicating recent pressure on profitability.
Brown-Forman Corporation (BF-B)
BF-B experienced similar trends from 2021 to 2025, with a 14.85% increase in revenue but a 3.77% drop in net income. Margins are stable and favorable, mirroring BF-A’s gross margin of 58.94% and net margin of 21.86%. In 2025, revenue and net margin decreased by 4.86% and 10.8%, respectively, alongside a 14.42% EPS decline, reflecting weakening earnings.
Which one has the stronger fundamentals?
Both BF-A and BF-B share identical income statement profiles, showing favorable margins but recent declines in revenue, net margin, and EPS. Their overall income statement evaluations are unfavorable due to persistent net income and margin contractions over the period. Thus, neither outperforms the other in fundamental income metrics based on available data.
Financial Ratios Comparison
The following table compares key financial ratios for Brown-Forman Corporation’s BF-A and BF-B classes for the fiscal year 2025, providing a snapshot of their recent financial performance.
| Ratios | Brown-Forman BF-A | Brown-Forman BF-B |
|---|---|---|
| ROE | 21.76% | 21.76% |
| ROIC | 12.16% | 12.16% |
| P/E | 18.95 | 18.95 |
| P/B | 4.12 | 4.12 |
| Current Ratio | 3.88 | 3.88 |
| Quick Ratio | 1.56 | 1.56 |
| D/E | 0.68 | 0.68 |
| Debt-to-Assets | 33.80% | 33.80% |
| Interest Coverage | 9.07 | 9.07 |
| Asset Turnover | 0.49 | 0.49 |
| Fixed Asset Turnover | 3.63 | 3.63 |
| Payout Ratio | 48.33% | 48.33% |
| Dividend Yield | 2.55% | 2.55% |
Interpretation of the Ratios
Brown-Forman Corporation (BF-A)
Brown-Forman Corporation’s 2025 ratios show a generally favorable financial profile, with strong net margin (21.86%) and return on equity (21.76%), indicating efficient profitability and shareholder value creation. However, concerns arise from an unfavorable price-to-book ratio (4.12) and current ratio (3.88), suggesting valuation premium and liquidity management issues. The company pays dividends with a stable yield of 2.55%, supported by solid coverage, though attention to payout sustainability remains prudent.
Brown-Forman Corporation (BF-B)
The BF-B class shares present an identical ratio profile to BF-A, reflecting the same favorable profitability metrics and cautious valuation signals. The 2.55% dividend yield is consistent, backed by free cash flow coverage, but the elevated price-to-book and current ratios warrant monitoring. Overall, BF-B exhibits a balanced approach to dividends and shareholder returns, blending income with moderate financial leverage and liquidity considerations.
Which one has the best ratios?
Both BF-A and BF-B share the same financial strengths and weaknesses, with 57.14% of ratios favorable and 21.43% unfavorable. Neither class distinctly outperforms the other, as they mirror each other’s operational efficiency, profitability, and dividend yield. Investors should consider that valuation and liquidity ratios are areas for vigilance in both share classes.
Strategic Positioning
This section compares the strategic positioning of the two companies, including Market position, Key segments, and exposure to disruption:
BF-A
- Established market player in alcoholic beverages, facing typical industry competitive pressures.
- Diverse product portfolio with whiskey, tequila, ready-to-drink, vodka, wine, and bulk sales.
- Operates in traditional beverage industry; limited direct exposure to technological disruption.
BF-B
- Established market player in alcoholic beverages, facing typical industry competitive pressures.
- Diverse product portfolio with whiskey, tequila, ready-to-drink, vodka, wine, and bulk sales.
- Operates in traditional beverage industry; limited direct exposure to technological disruption.
BF-A vs BF-B Positioning
Both BF-A and BF-B share identical diversified product portfolios and market reach, with similar competitive pressures. Neither shows differentiation in technological disruption exposure, reflecting a concentrated focus on established beverage segments.
Which has the best competitive advantage?
Both BF-A and BF-B exhibit a slightly favorable moat with value creation but declining profitability trends. Their competitive advantages appear equivalent based on ROIC exceeding WACC and similar financial profiles.
Stock Comparison
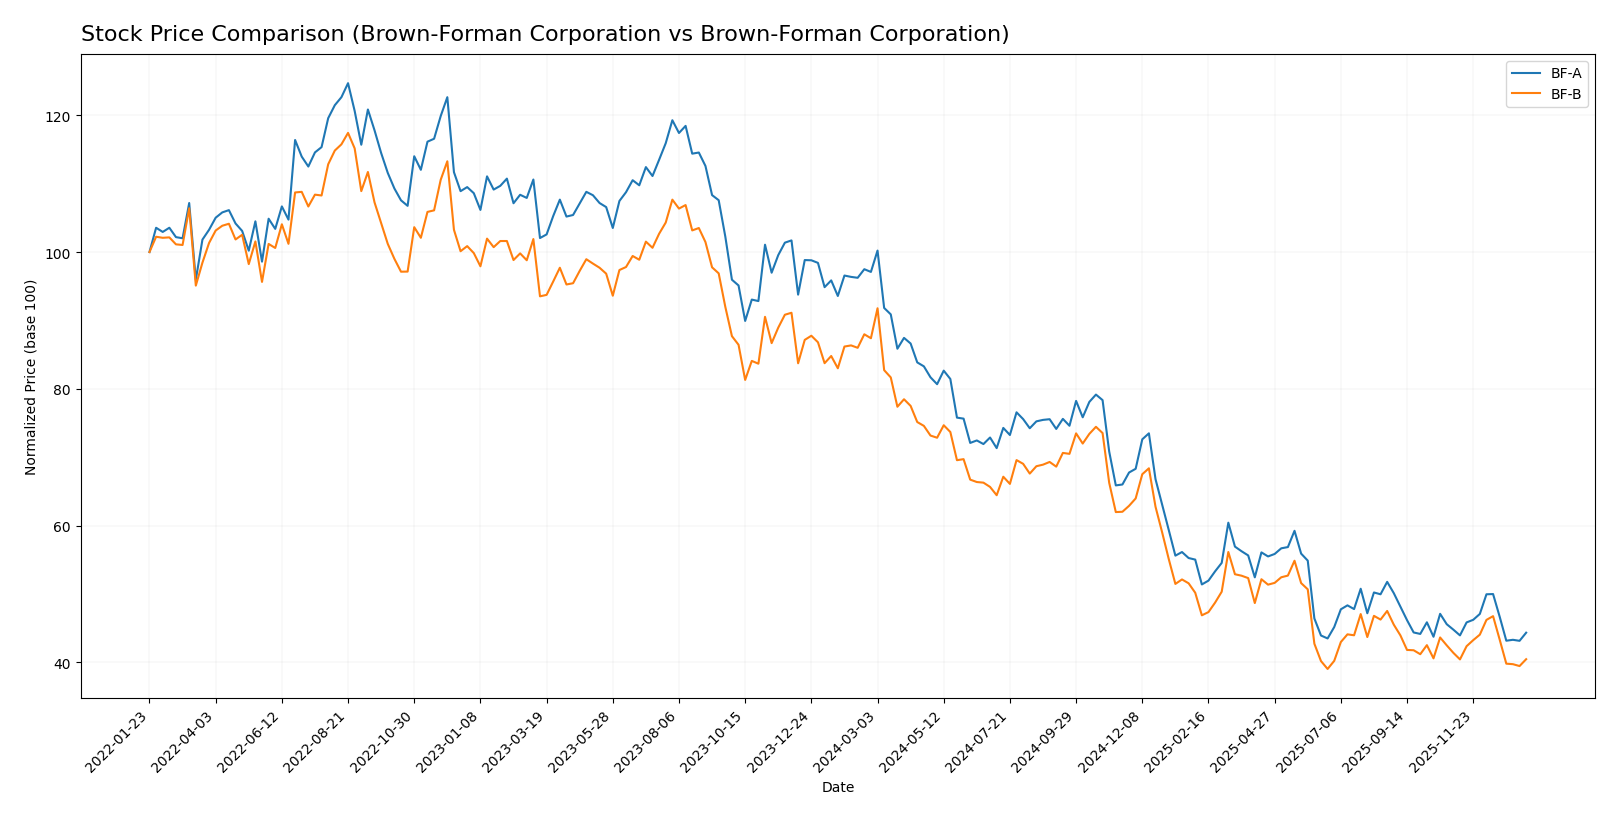
The stock prices of Brown-Forman Corporation’s BF-A and BF-B classes have shown significant declines over the past 12 months, characterized by accelerating bearish trends and varying buyer-seller dynamics in recent weeks.
Trend Analysis
Brown-Forman BF-A experienced a 54.33% price decrease over the past year, reflecting a bearish trend with accelerating downward momentum. The stock ranged between 60.68 and 26.13, showing notable volatility with a 9.02 standard deviation.
Brown-Forman BF-B declined by 53.7% in 12 months, also displaying a bearish trend with acceleration. Its price fluctuated from 60.37 to 25.68, accompanied by a standard deviation of 8.84, indicating high volatility similar to BF-A.
Comparing the two, BF-A had a slightly larger price drop, thus BF-B has delivered marginally better market performance over the analyzed period. Both stocks trend bearish with accelerating declines.
Target Prices
The current analyst consensus for Brown-Forman Corporation’s class A shares suggests a stable target price.
| Company | Target High | Target Low | Consensus |
|---|---|---|---|
| Brown-Forman Corporation | 30 | 30 | 30 |
Analysts expect Brown-Forman’s BF-A shares to reach $30, indicating modest upside potential from the current price of $26.85. No verified target price data is available for BF-B shares.
Analyst Opinions Comparison
This section compares analysts’ ratings and grades for Brown-Forman Corporation’s two share classes:
Rating Comparison
BF-A Rating
- Rating: A- indicating a very favorable assessment of financial standing.
- Discounted Cash Flow Score: 3, reflecting a moderate view on valuation.
- ROE Score: 5, showing very favorable efficiency in generating profit.
- ROA Score: 5, indicating very favorable asset utilization.
- Debt To Equity Score: 2, a moderate rating for financial risk management.
- Overall Score: 4, a favorable overall financial standing score.
BF-B Rating
- Rating: B also indicating a very favorable assessment of financial standing.
- Discounted Cash Flow Score: 3, reflecting a moderate view on valuation.
- ROE Score: 5, showing very favorable efficiency in generating profit.
- ROA Score: 5, indicating very favorable asset utilization.
- Debt To Equity Score: 2, a moderate rating for financial risk management.
- Overall Score: 3, a moderate overall financial standing score.
Which one is the best rated?
Based strictly on provided data, BF-A is better rated overall with a higher rating (A-) and a favorable overall score (4) compared to BF-B’s rating (B) and moderate overall score (3). Both share similar strong profitability and moderate financial risk scores.
Scores Comparison
Here is a comparison of the key financial scores for Brown-Forman Corporation’s two share classes:
BF-A Scores
- Altman Z-Score: 4.26, indicating a safe financial zone with low bankruptcy risk.
- Piotroski Score: 7, showing strong financial health and solid investment potential.
BF-B Scores
- Altman Z-Score: 4.23, indicating a safe financial zone with low bankruptcy risk.
- Piotroski Score: 7, showing strong financial health and solid investment potential.
Which company has the best scores?
Both BF-A and BF-B share classes have very similar scores, each with an Altman Z-Score above 4 in the safe zone and a Piotroski Score of 7, reflecting strong financial health and low bankruptcy risk.
Grades Comparison
Here is the grades comparison of Brown-Forman Corporation’s two stock classes based on recent analyst ratings:
Brown-Forman Corporation (BF-A) Grades
The following table shows recent grades and actions from reputable financial institutions for BF-A shares:
| Grading Company | Action | New Grade | Date |
|---|---|---|---|
| Morgan Stanley | maintain | Equal Weight | 2024-06-06 |
| Bernstein | upgrade | Outperform | 2023-09-10 |
| Barclays | maintain | Equal Weight | 2023-08-31 |
| RBC Capital | maintain | Sector Perform | 2023-08-30 |
| Roth MKM | maintain | Neutral | 2023-08-30 |
| JP Morgan | maintain | Neutral | 2023-08-23 |
| Morgan Stanley | upgrade | Overweight | 2023-08-22 |
| Deutsche Bank | maintain | Hold | 2023-08-20 |
| Barclays | maintain | Equal Weight | 2023-07-19 |
| RBC Capital | maintain | Perform | 2023-06-08 |
Overall, BF-A grades show a pattern centered around hold, equal weight, or neutral ratings, with occasional upgrades signaling moderate positive sentiment.
Brown-Forman Corporation (BF-B) Grades
The table below presents recent analyst grades and actions for BF-B shares:
| Grading Company | Action | New Grade | Date |
|---|---|---|---|
| Citigroup | downgrade | Sell | 2025-12-17 |
| Evercore ISI Group | maintain | In Line | 2025-12-05 |
| JP Morgan | maintain | Underweight | 2025-12-05 |
| Barclays | maintain | Overweight | 2025-11-28 |
| Needham | maintain | Hold | 2025-10-16 |
| Barclays | maintain | Overweight | 2025-10-07 |
| Barclays | maintain | Overweight | 2025-09-02 |
| JP Morgan | maintain | Underweight | 2025-09-02 |
| Needham | maintain | Hold | 2025-08-29 |
| UBS | maintain | Neutral | 2025-08-29 |
The BF-B grades reveal a more mixed but cautious stance, including a recent downgrade to sell and several underweight and hold ratings, implying some concerns.
Which company has the best grades?
BF-A has generally received more favorable grades, including upgrades to outperform and overweight, compared to BF-B’s more mixed and cautious ratings with a recent sell downgrade. This discrepancy may influence investor perception of relative risk and potential returns for each share class.
Strengths and Weaknesses
Below is a comparison of key strengths and weaknesses for Brown-Forman Corporation’s two classes of shares, BF-A and BF-B, based on the most recent financial and market data.
| Criterion | Brown-Forman BF-A | Brown-Forman BF-B |
|---|---|---|
| Diversification | Strong portfolio with whiskey as core (2.83B USD in 2025), plus tequila, ready-to-drink, wine, vodka segments | Identical product diversification and revenue streams as BF-A |
| Profitability | Favorable net margin (21.86%) and ROE (21.76%), but declining ROIC trend (-27%) | Same profitability profile and declining ROIC trend as BF-A |
| Innovation | Moderate innovation evidenced by expanding ready-to-drink and tequila sales | Matches BF-A’s innovation level and product mix |
| Global presence | Strong global brand in whiskey and spirits with expanding ready-to-drink segment | Equivalent global presence and market reach as BF-A |
| Market Share | Leading share in whiskey market segment; asset turnover low (0.49) indicating room for operational efficiency improvement | Same market share and operational metrics as BF-A |
Both share classes reflect the same underlying company fundamentals, showing solid profitability and diversified product lines. The main caution is the declining ROIC trend, which suggests pressure on profitability sustainability. Operational efficiency improvements could further enhance value creation.
In summary, Brown-Forman’s shares offer exposure to a well-diversified and profitable spirits company with a strong global footprint. However, investors should monitor the declining ROIC trend and asset utilization metrics for signs of future profitability challenges.
Risk Analysis
Below is a comparison table of key risks for Brown-Forman Corporation’s two share classes (BF-A and BF-B) based on the most recent data from 2025:
| Metric | Brown-Forman BF-A | Brown-Forman BF-B |
|---|---|---|
| Market Risk | Low beta (0.414) suggests lower volatility vs. market | Low beta (0.414) suggests lower volatility vs. market |
| Debt level | Moderate debt/equity ratio (0.68), neutral risk | Moderate debt/equity ratio (0.68), neutral risk |
| Regulatory Risk | Moderate, industry sensitive to alcohol regulations | Moderate, industry sensitive to alcohol regulations |
| Operational Risk | Medium, supply chain and production complexity | Medium, supply chain and production complexity |
| Environmental Risk | Moderate, increasing focus on sustainable production | Moderate, increasing focus on sustainable production |
| Geopolitical Risk | Exposure to multiple international markets, moderate | Exposure to multiple international markets, moderate |
The most likely and impactful risks for Brown-Forman are regulatory changes impacting alcohol sales and moderate operational risks related to supply chain disruptions. Both share classes show stable financial health with safe Altman Z-Scores above 4, indicating low bankruptcy risk, but valuations reflected in P/B ratios could imply caution.
Which Stock to Choose?
Brown-Forman Corporation BF-A shows a declining income trend over the past year with unfavorable revenue and net margin growth, but maintains favorable profitability ratios and a slightly favorable MOAT status, supported by a strong A- rating and balanced debt metrics.
Brown-Forman Corporation BF-B mirrors BF-A’s income challenges and profitability profile, holding the same slightly favorable MOAT status but with a lower overall rating of B, reflecting moderate scores on valuation ratios and similar debt levels.
For risk-averse investors focused on financial stability and quality, BF-A’s stronger rating and favorable profitability metrics might appear more suitable, while those tolerating moderate valuation risks could consider BF-B given its comparable income and MOAT profiles but lower market expectations.
Disclaimer: Investment carries a risk of loss of initial capital. The past performance is not a reliable indicator of future results. Be sure to understand risks before making an investment decision.
Go Further
I encourage you to read the complete analyses of Brown-Forman Corporation to enhance your investment decisions: