Home > Comparison > Financial Services > WTW vs BRO
The strategic rivalry between Willis Towers Watson and Brown & Brown shapes the insurance brokerage landscape in 2026. Willis Towers Watson operates as a global advisory and risk management powerhouse, blending consulting with advanced analytics. In contrast, Brown & Brown excels as a diversified U.S.-centric brokerage with strong retail and wholesale segments. This analysis will identify which model delivers superior risk-adjusted returns for a diversified portfolio amid evolving sector dynamics.
Table of contents
Companies Overview
Willis Towers Watson and Brown & Brown command significant stakes in the global insurance brokerage sector.
Willis Towers Watson: Global Advisory Powerhouse
Willis Towers Watson operates as a leading advisory, broking, and solutions company worldwide. Its core revenue stems from specialized services in Health, Wealth and Career, and Risk and Broking segments. In 2026, the company sharpens its strategic focus on delivering tailored consulting, risk management, and benefits outsourcing, strengthening its competitive edge in complex insurance and talent management solutions.
Brown & Brown: Diversified Insurance Distributor
Brown & Brown stands as a prominent insurance marketer and broker across the U.S. and select international markets. Revenue flows from four segments: Retail, National Programs, Wholesale Brokerage, and Services, serving diverse commercial and personal insurance needs. The latest strategic emphasis lies in expanding programmatic insurance offerings and enhancing third-party claims and medical management services, deepening client relationships and operational breadth.
Strategic Collision: Similarities & Divergences
Both firms excel in insurance brokerage but diverge in business philosophies: Willis Towers Watson leans on a consultative, solutions-driven model, while Brown & Brown focuses on distribution and program specialization. Their primary battleground is risk management and benefits solutions for corporate clients. Willis Towers Watson offers a broader global advisory profile; Brown & Brown boasts a nimble, segmented U.S.-centric distribution network, shaping distinct investment appeals.
Income Statement Comparison
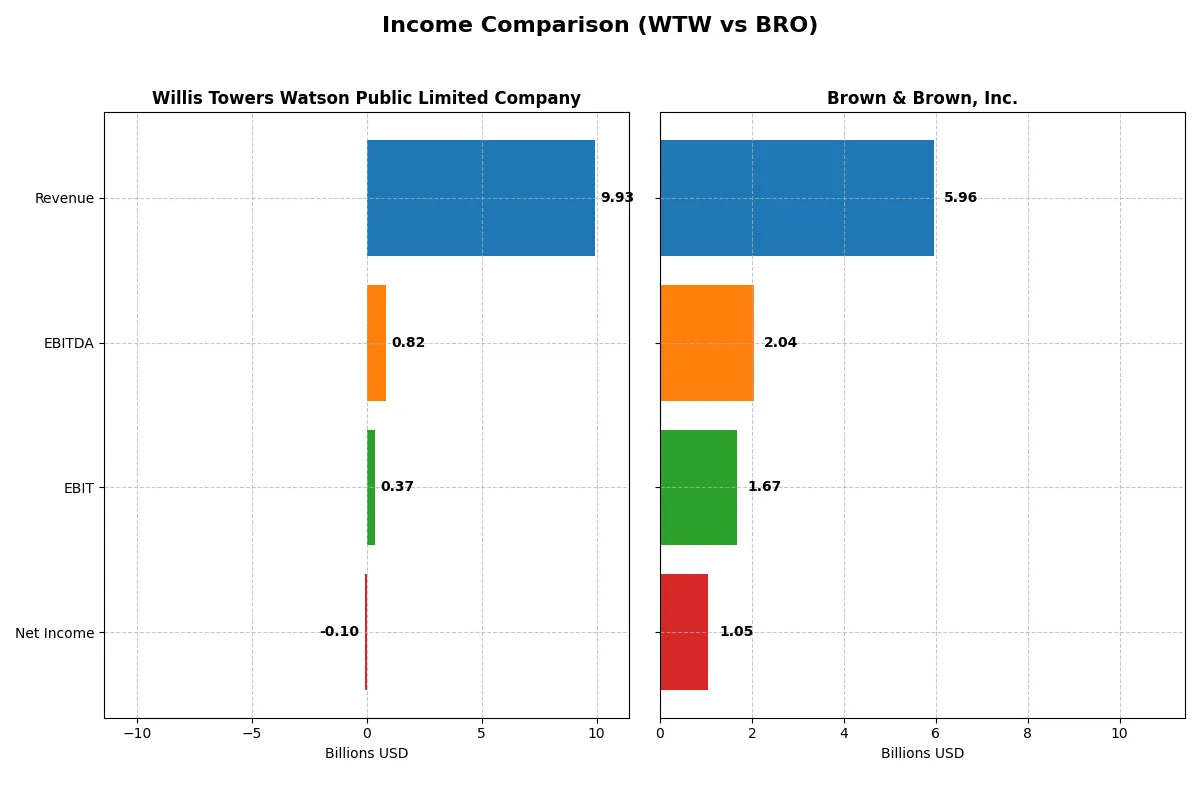
This data dissects the core profitability and scalability of both corporate engines to reveal who dominates the bottom line:
| Metric | Willis Towers Watson (WTW) | Brown & Brown (BRO) |
|---|---|---|
| Revenue | 9.93B | 5.96B |
| Cost of Revenue | 5.50B | 734M |
| Operating Expenses | 3.80B | 3.53B |
| Gross Profit | 4.43B | 5.22B |
| EBITDA | 823M | 2.04B |
| EBIT | 367M | 1.67B |
| Interest Expense | 263M | 297M |
| Net Income | -98M | 1.05B |
| EPS | -0.96 | 3.37 |
| Fiscal Year | 2024 | 2025 |
Income Statement Analysis: The Bottom-Line Duel
This income statement comparison exposes which company operates more efficiently and delivers superior profitability under current market conditions.
Willis Towers Watson Public Limited Company Analysis
WTW’s revenue grew moderately from $8.6B in 2020 to nearly $10B in 2024, but net income sharply declined to a loss of $98M in 2024. Gross margin stays solid at 44.6%, yet net margin turns negative, signaling rising costs and operational challenges. The 2024 plunge in EBIT and net income suggests worsening efficiency and margin pressure.
Brown & Brown, Inc. Analysis
BRO’s revenue surged from $3B in 2021 to $6B in 2025, while net income improved to $1.05B despite a slight net margin dip to 17.7%. The company sustains an impressive gross margin near 88% and EBIT margin above 28%, reflecting strong operational control and scalable profitability. Its 2025 financials display robust growth momentum and margin strength.
Margin Strength vs. Profitability Resilience
BRO clearly outperforms WTW with higher margins, consistent net income growth, and superior operational leverage. WTW’s recent losses and margin deterioration contrast sharply with BRO’s expanding scale and profitability. For investors, BRO’s profile offers a more attractive balance of growth and fundamental profitability.
Financial Ratios Comparison
These vital ratios act as a diagnostic tool to expose the underlying fiscal health, valuation premiums, and capital efficiency of the companies compared below:
| Ratios | Willis Towers Watson (WTW) | Brown & Brown (BRO) |
|---|---|---|
| ROE | -1.23% (2024) | 15.43% (2024) |
| ROIC | -3.49% (2024) | 9.09% (2024) |
| P/E | -326.03 (2024) | 28.97 (2024) |
| P/B | 4.02 (2024) | 4.47 (2024) |
| Current Ratio | 1.20 (2024) | 1.10 (2024) |
| Quick Ratio | 1.20 (2024) | 1.10 (2024) |
| D/E (Debt-to-Equity) | 0.75 (2024) | 0.63 (2024) |
| Debt-to-Assets | 21.43% (2024) | 23.05% (2024) |
| Interest Coverage | 2.38 (2024) | 6.80 (2024) |
| Asset Turnover | 0.36 (2024) | 0.27 (2024) |
| Fixed Asset Turnover | 8.66 (2024) | 9.07 (2024) |
| Payout Ratio | -361% (2024) | 15.51% (2024) |
| Dividend Yield | 1.11% (2024) | 0.54% (2024) |
| Fiscal Year | 2024 | 2024 |
Efficiency & Valuation Duel: The Vital Signs
Financial ratios serve as a company’s DNA, exposing hidden risks and operational strengths critical for investment insights.
Willis Towers Watson Public Limited Company
Willis Towers Watson shows weak profitability with negative ROE and margins, signaling operational struggles. Its P/E ratio appears favorable but is distorted by losses, while a high P/B ratio suggests overvaluation. Dividend yield is modest at 1.11%, indicating a cautious shareholder return via dividends rather than aggressive buybacks or reinvestment.
Brown & Brown, Inc.
Brown & Brown posts strong net margins at 17.7%, reflecting efficient core operations. Its P/E of 23.44 is neutral, implying fair valuation relative to earnings. Despite favorable debt metrics and interest coverage, the company yields a lower dividend at 0.79%, highlighting potential reinvestment into growth or operational improvements.
Balanced Risk vs. Operational Efficiency
Both stocks show slightly unfavorable overall ratio profiles but differ in risk and reward balance. Willis Towers Watson struggles with profitability and valuation disconnects, while Brown & Brown delivers solid margins and healthier debt management. Investors seeking operational efficiency might prefer Brown & Brown’s profile, whereas those focusing on valuation nuances should note Willis Towers Watson’s complexities.
Which one offers the Superior Shareholder Reward?
I compare Willis Towers Watson (WTW) and Brown & Brown (BRO) by their distribution strategies and shareholder returns. WTW yields 1.39% with a 33% payout ratio, supported by strong free cash flow (FCF) coverage above 80%. BRO offers a lower 0.79% yield and a 15.5% payout ratio but leads in buyback intensity, reflected in consistent FCF reinvestment and steady dividend growth. WTW’s higher dividend yield and sustainable payout ratio provide reliable income, while BRO’s lean payout and aggressive buybacks fuel capital appreciation. I find WTW’s balanced yield and buyback mix more attractive for 2026 investors seeking total return with less risk.
Comparative Score Analysis: The Strategic Profile
The radar chart reveals the fundamental DNA and trade-offs of Willis Towers Watson and Brown & Brown, highlighting their core strategic strengths and weaknesses:
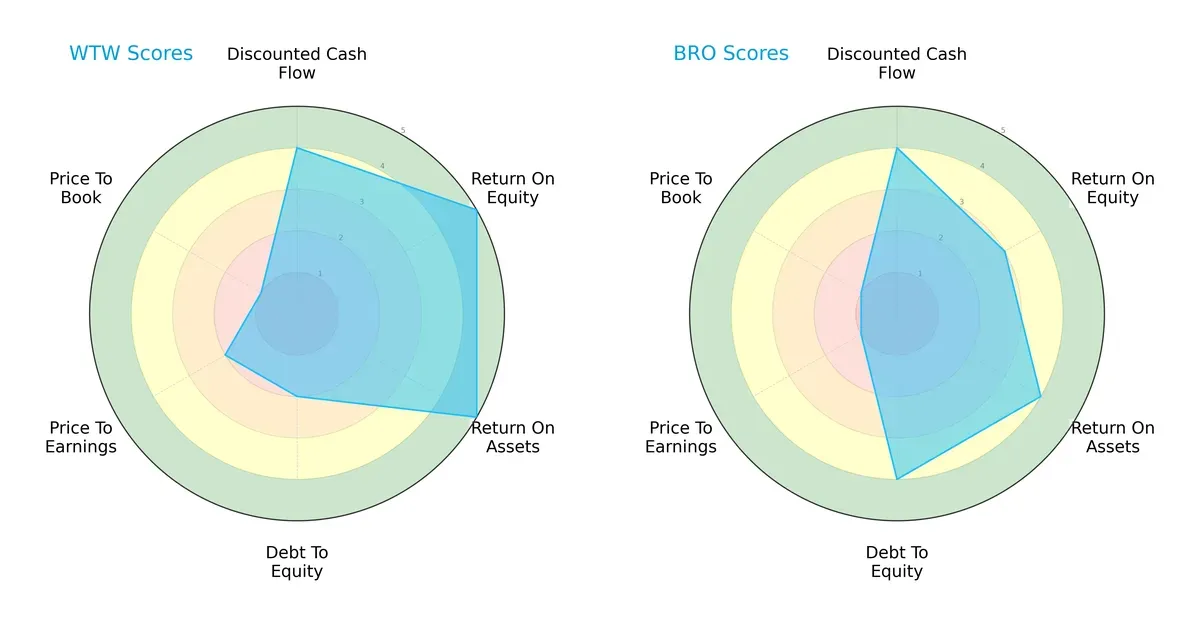
Willis Towers Watson excels in return on equity (5) and return on assets (5), showing robust profitability and asset use. Brown & Brown boasts a stronger debt-to-equity score (4), indicating superior financial stability. Both share a favorable discounted cash flow score (4), but Willis Towers Watson’s valuation scores lag, especially price-to-book (1). Willis Towers Watson’s profile relies on operational efficiency, while Brown & Brown presents a more balanced financial risk posture.
Bankruptcy Risk: Solvency Showdown
Willis Towers Watson and Brown & Brown both sit in the Altman Z-Score distress zone, signaling elevated bankruptcy risk in this cycle:
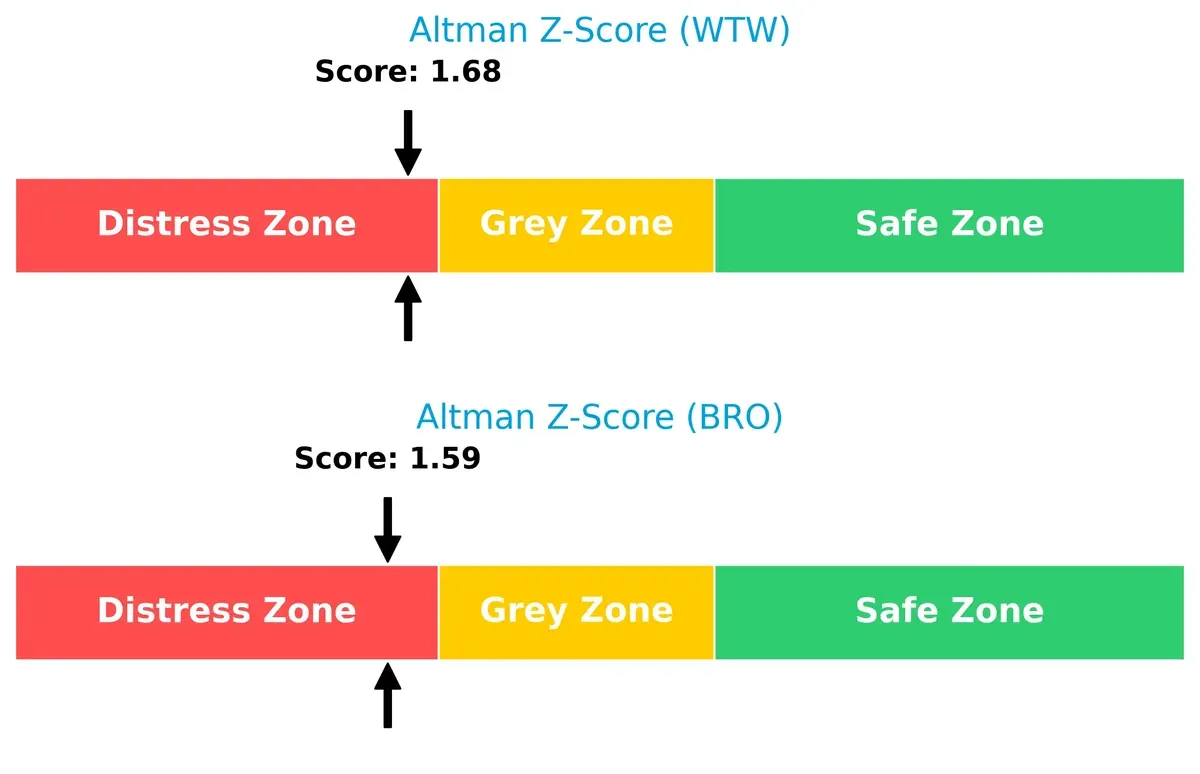
The scores—1.68 for Willis Towers Watson and 1.59 for Brown & Brown—indicate both firms face significant financial stress. Historically, companies in this zone require careful monitoring as their survival hinges on swift capital and operational adjustments.
Financial Health: Quality of Operations
Both companies share an average Piotroski F-Score of 6, reflecting moderate financial health without clear red flags:
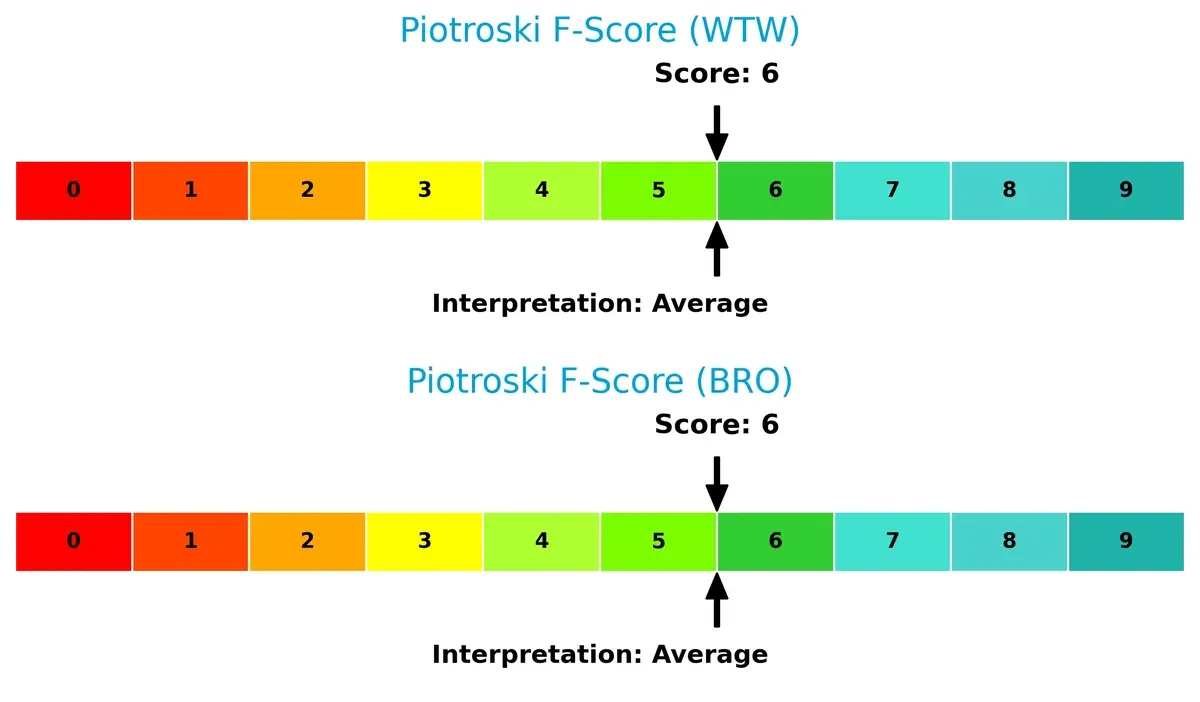
A score of 6 suggests that Willis Towers Watson and Brown & Brown maintain reasonable profitability, leverage, and liquidity metrics. Neither shows peak financial strength, but both avoid severe distress signals, indicating operational resilience amid sector challenges.
How are the two companies positioned?
This section dissects WTW and BRO’s operational DNA by comparing revenue distribution and internal dynamics—strengths and weaknesses. The goal is to confront their economic moats and identify the more resilient competitive advantage in today’s market.
Revenue Segmentation: The Strategic Mix
This visual comparison dissects how Willis Towers Watson and Brown & Brown diversify their income streams and reveals their primary sector bets for 2024:
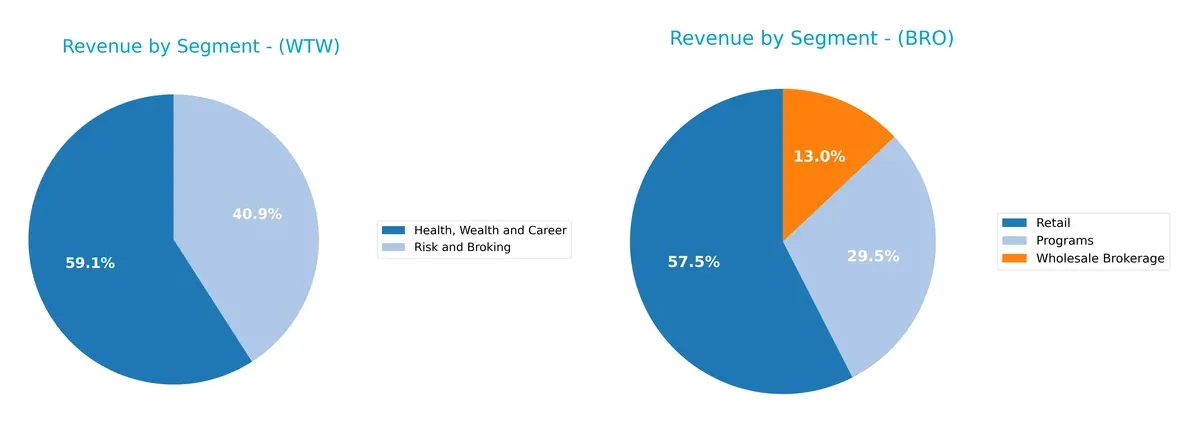
Willis Towers Watson anchors its revenue in Health, Wealth and Career with $5.85B, complemented by $4.05B from Risk and Broking, showing a balanced dual-segment focus. Brown & Brown leans heavily on Retail at $2.73B, with $1.4B in Programs and $616M in Wholesale Brokerage, reflecting a more diversified but retail-centric approach. Willis Towers Watson’s model suggests strong ecosystem lock-in, while Brown & Brown faces moderate concentration risk due to retail reliance.
Strengths and Weaknesses Comparison
This table compares the Strengths and Weaknesses of Willis Towers Watson (WTW) and Brown & Brown (BRO):
WTW Strengths
- Diverse revenue streams from Health, Wealth, Career, and Risk and Broking segments
- Strong global presence with significant US and UK markets
- Favorable quick ratio and low debt-to-assets ratio
- Positive fixed asset turnover ratio indicates efficient asset use
BRO Strengths
- High net margin shows strong profitability
- Favorable debt-to-equity and debt-to-assets ratios signal conservative leverage
- Strong interest coverage ratio indicates solid ability to service debt
- Leading revenue in US market with national programs and retail segments
WTW Weaknesses
- Unfavorable profitability metrics: negative net margin, ROE, and ROIC
- Weak interest coverage and asset turnover ratios
- Unfavorable price-to-book ratio suggests valuation concerns
- Slightly unfavorable overall financial ratios
BRO Weaknesses
- Zero or unavailable key profitability ratios like ROE and ROIC
- Unfavorable liquidity ratios including current and quick ratios
- Low dividend yield and unfavorable asset turnover metrics
- Slightly unfavorable overall financial ratios
WTW benefits from broad diversification and global scale but struggles with profitability and operational efficiency. BRO shows strong profitability and conservative leverage but faces challenges in liquidity and some efficiency metrics. These contrasting profiles reflect differing strategic and financial positions in the market.
The Moat Duel: Analyzing Competitive Defensibility
A structural moat is the only reliable shield protecting long-term profits from relentless competition erosion. Let’s dissect the moats of Willis Towers Watson and Brown & Brown:
Willis Towers Watson Public Limited Company: Intangible Assets & Global Reach
WTW’s moat stems from its deep expertise and sophisticated actuarial services, reflected in stable gross margins near 45%. However, declining ROIC signals value destruction, risking moat erosion unless innovation or market expansion in 2026 reverses this trend.
Brown & Brown, Inc.: Scalable Distribution & Cost Advantage
BRO’s competitive edge lies in its vast retail and wholesale brokerage network, driving high gross margins above 87% and strong EBIT margins at 28%. Despite a recent dip in net margin growth, its revenue and profit growth remain robust, suggesting durable moat potential for market disruption ahead.
Distribution Network Strength vs. Intangible Expertise Resilience
WTW’s intangible asset moat falters under declining profitability, while BRO’s scalable distribution model delivers superior financial returns and growth. I believe Brown & Brown possesses the deeper moat, better equipped to defend and expand its market share in 2026.
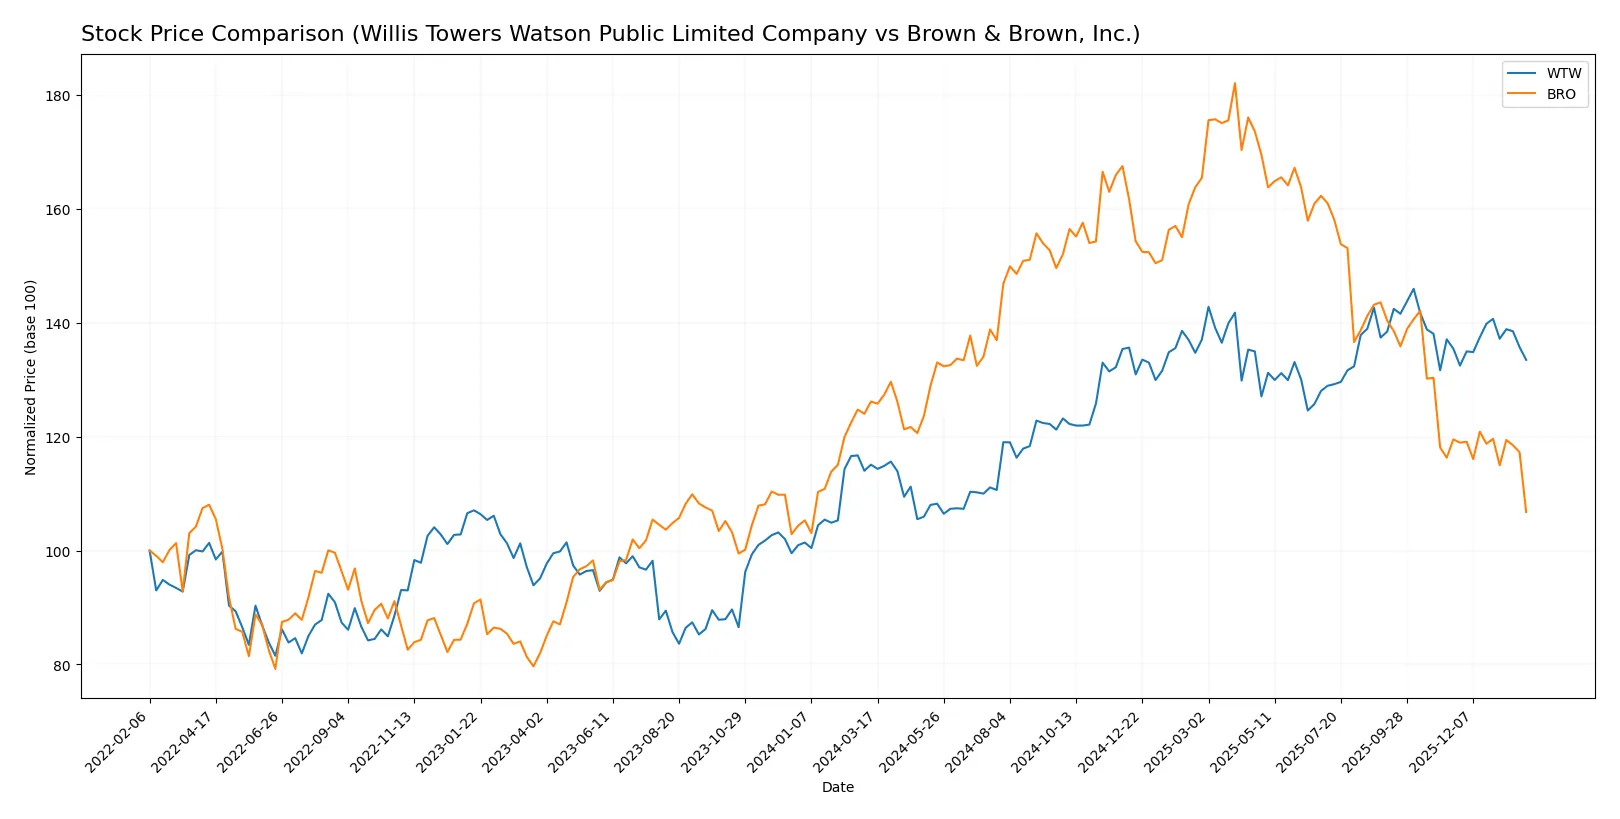
Which stock offers better returns?
The past year shows Willis Towers Watson’s stock rising 16%, with decelerating momentum and a volatile range between 251 and 347. Brown & Brown’s shares fell 15%, also with slowing decline and less volatility.
Trend Comparison
Willis Towers Watson’s stock gained 15.99% over the past year, marking a bullish trend with decelerating price acceleration and high volatility (std dev 26.11). Recent months show a mild -1.45% dip, indicating a near-neutral short-term slope.
Brown & Brown’s stock declined 15.37% over the year, reflecting a bearish trend with decelerating losses and moderate volatility (std dev 12.3). The recent period deepened the decline by -10.66%, showing stronger negative momentum.
Willis Towers Watson outperformed Brown & Brown by delivering positive returns versus a significant drop. The former’s bullish long-term trend contrasts sharply with the latter’s sustained bearish trajectory.
Target Prices
Analysts show confident upside potential for Willis Towers Watson and limited upside for Brown & Brown.
| Company | Target Low | Target High | Consensus |
|---|---|---|---|
| Willis Towers Watson Public Limited Company | 318 | 398 | 367.22 |
| Brown & Brown, Inc. | 88 | 89 | 88.5 |
Willis Towers Watson’s consensus target exceeds its current price of 317.47, indicating expected upside. Brown & Brown’s target consensus at 88.5 contrasts with its current 72.1 price, signaling a more conservative growth projection.

Don’t Let Luck Decide Your Entry Point
Optimize your entry points with our advanced ProRealTime indicators. You’ll get efficient buy signals with precise price targets for maximum performance. Start outperforming now!
How do institutions grade them?
Institutional grading data for Willis Towers Watson Public Limited Company and Brown & Brown, Inc. reveal their latest analyst ratings:
Willis Towers Watson Public Limited Company Grades
This table summarizes recent institutional grades for Willis Towers Watson:
| Grading Company | Action | New Grade | Date |
|---|---|---|---|
| Cantor Fitzgerald | Maintain | Neutral | 2026-01-14 |
| Wells Fargo | Maintain | Overweight | 2026-01-13 |
| Barclays | Maintain | Underweight | 2026-01-08 |
| Evercore ISI Group | Maintain | Outperform | 2026-01-07 |
| Keefe, Bruyette & Woods | Maintain | Outperform | 2026-01-06 |
| Keefe, Bruyette & Woods | Maintain | Outperform | 2025-12-12 |
| Wells Fargo | Maintain | Overweight | 2025-12-12 |
| Barclays | Maintain | Underweight | 2025-11-20 |
| TD Cowen | Maintain | Buy | 2025-11-10 |
| Keefe, Bruyette & Woods | Maintain | Outperform | 2025-11-04 |
Brown & Brown, Inc. Grades
Below are recent institutional grades for Brown & Brown:
| Grading Company | Action | New Grade | Date |
|---|---|---|---|
| BMO Capital | Maintain | Market Perform | 2026-01-29 |
| Keefe, Bruyette & Woods | Upgrade | Market Perform | 2026-01-29 |
| UBS | Maintain | Neutral | 2026-01-29 |
| Morgan Stanley | Maintain | Equal Weight | 2026-01-29 |
| Wells Fargo | Maintain | Equal Weight | 2026-01-28 |
| Mizuho | Maintain | Neutral | 2026-01-28 |
| Truist Securities | Maintain | Buy | 2026-01-28 |
| Jefferies | Maintain | Hold | 2026-01-28 |
| Citigroup | Downgrade | Neutral | 2026-01-28 |
| B of A Securities | Maintain | Neutral | 2026-01-27 |
Which company has the best grades?
Willis Towers Watson displays a broader range of positive ratings, including multiple “Outperform” and “Buy” grades. Brown & Brown’s ratings cluster around “Market Perform” and “Neutral,” with fewer upgrades. Investors may interpret Willis Towers Watson’s stronger grades as greater institutional confidence.
Risks specific to each company
The following categories identify the critical pressure points and systemic threats facing both firms in the 2026 market environment:
1. Market & Competition
Willis Towers Watson Public Limited Company
- Faces margin pressure with negative net margin and ROIC, signaling competitive challenges.
Brown & Brown, Inc.
- Maintains strong net margin (17.7%) but zero ROE and ROIC suggest operational efficiency issues.
2. Capital Structure & Debt
Willis Towers Watson Public Limited Company
- Moderate debt-to-equity (0.75) and favorable debt-to-assets (21.4%) but weak interest coverage (1.4) raises refinancing risks.
Brown & Brown, Inc.
- Zero reported debt metrics, strong interest coverage (5.62), indicating conservative leverage and financial stability.
3. Stock Volatility
Willis Towers Watson Public Limited Company
- Lower beta (0.635) implies less sensitivity to market swings, offering relative stability.
Brown & Brown, Inc.
- Higher beta (0.812) indicates more exposure to market volatility, increasing risk for investors.
4. Regulatory & Legal
Willis Towers Watson Public Limited Company
- Operates globally with exposure to complex regulations in multiple jurisdictions including UK and US.
Brown & Brown, Inc.
- US-centric operations reduce regulatory complexity but still face evolving insurance compliance risks.
5. Supply Chain & Operations
Willis Towers Watson Public Limited Company
- Large workforce (49K) and diverse service offerings increase operational complexity and cost risks.
Brown & Brown, Inc.
- Smaller workforce (17.4K) and focus on distribution reduce operational risk but limit scale advantages.
6. ESG & Climate Transition
Willis Towers Watson Public Limited Company
- Increasing pressure to integrate ESG into advisory services may require costly technology upgrades.
Brown & Brown, Inc.
- ESG integration still nascent; slower adaptation risks reputational damage amid rising investor scrutiny.
7. Geopolitical Exposure
Willis Towers Watson Public Limited Company
- Headquarters in UK and global footprint expose it to Brexit fallout and international trade tensions.
Brown & Brown, Inc.
- Primarily US-based, limiting direct geopolitical risks but vulnerable to domestic policy shifts.
Which company shows a better risk-adjusted profile?
Brown & Brown’s conservative capital structure and stronger profitability present a more favorable risk-adjusted profile. Willis Towers Watson’s negative profitability and weaker interest coverage signal higher financial vulnerability. Both companies fall in the Altman Z distress zone, but WTW’s slightly higher leverage and operational complexity raise red flags. Recent data show WTW’s interest coverage at a low 1.4, just above danger levels, while BRO’s coverage at 5.62 provides a clear cushion. Investors seeking stability should lean toward Brown & Brown given these risk factors.
Final Verdict: Which stock to choose?
Willis Towers Watson (WTW) showcases a superpower in operational resilience, maintaining solid cash flow and efficiency despite recent profitability challenges. Its main point of vigilance lies in its declining return on invested capital, signaling potential value erosion. WTW fits best in portfolios aiming for turnaround or contrarian growth plays.
Brown & Brown (BRO) commands a strategic moat through its robust recurring revenue and strong gross margins. It offers better income stability and interest coverage than WTW, appealing to investors favoring steadier cash generation. BRO suits GARP portfolios seeking growth with a margin of safety.
If you prioritize operational turnaround and are comfortable with elevated risk, WTW presents a compelling scenario due to its cash flow robustness amid profitability headwinds. However, if you seek consistent income and safer growth, BRO offers better stability and recurring revenue strength despite its recent stock weakness. Both require careful monitoring of their evolving fundamentals.
Disclaimer: Investment carries a risk of loss of initial capital. The past performance is not a reliable indicator of future results. Be sure to understand risks before making an investment decision.
Go Further
I encourage you to read the complete analyses of Willis Towers Watson Public Limited Company and Brown & Brown, Inc. to enhance your investment decisions: