Home > Comparison > Financial Services > MMC vs BRO
The strategic rivalry between Marsh & McLennan Companies, Inc. and Brown & Brown, Inc. shapes the landscape of insurance brokerage. Marsh & McLennan operates as a diversified professional services leader focused on risk and consulting solutions. Brown & Brown emphasizes a broader retail and wholesale insurance brokerage model with specialized national programs. This analysis will assess which corporate strategy delivers superior risk-adjusted returns for a diversified portfolio in financial services.

Table of contents
Companies Overview
Marsh & McLennan and Brown & Brown stand as pivotal players in the insurance brokerage sector, shaping risk management strategies globally.
Marsh & McLennan Companies, Inc.: Global Risk and Consulting Powerhouse
Marsh & McLennan dominates as a professional services firm offering risk management and consulting solutions worldwide. Its core revenue stems from insurance broking, risk advisory, and consulting services. In 2026, the company sharpens its strategic focus on integrating risk and consulting to deliver comprehensive solutions across industries, leveraging a workforce of 90K employees.
Brown & Brown, Inc.: Diversified Insurance Brokerage Specialist
Brown & Brown operates as a prominent insurance broker with a diverse portfolio across retail, national programs, wholesale brokerage, and services. It generates revenue primarily through selling property, casualty, and specialty insurance products, supported by an independent agent network. The firm emphasizes expanding its national programs and services segments to deepen market penetration and operational efficiency.
Strategic Collision: Similarities & Divergences
Both firms prioritize insurance brokerage but diverge in scale and service breadth. Marsh & McLennan integrates consulting tightly with risk services, while Brown & Brown pursues segmented growth via independent agents. Their primary battleground lies in capturing commercial and specialty insurance clients. Marsh & McLennan’s global consulting edge contrasts with Brown & Brown’s focused distribution model, shaping distinct risk and return profiles for investors.
Income Statement Comparison
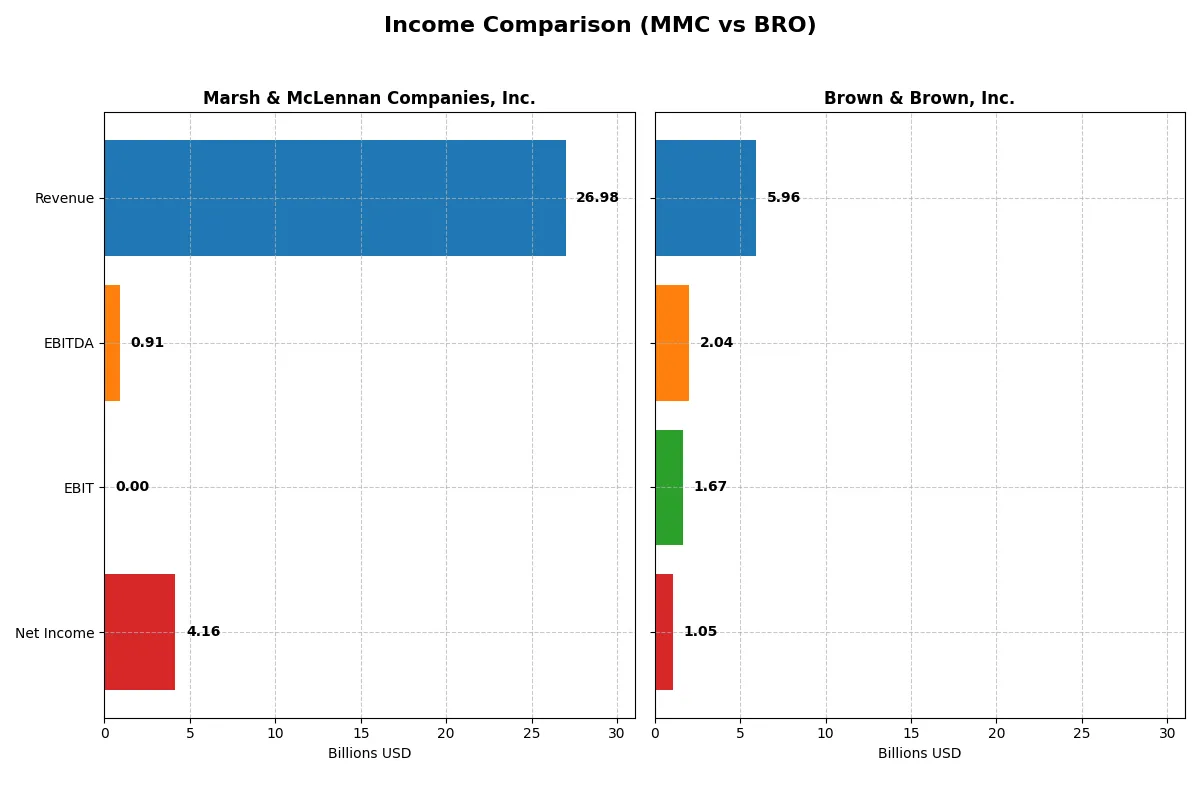
This data dissects the core profitability and scalability of both corporate engines to reveal who dominates the bottom line:
| Metric | Marsh & McLennan Companies, Inc. (MMC) | Brown & Brown, Inc. (BRO) |
|---|---|---|
| Revenue | 27B | 6B |
| Cost of Revenue | 0 | 734M |
| Operating Expenses | 20.8B | 3.53B |
| Gross Profit | 0 | 5.22B |
| EBITDA | 910M | 2.04B |
| EBIT | 0 | 1.67B |
| Interest Expense | 960M | 297M |
| Net Income | 4.16B | 1.05B |
| EPS | 8.48 | 3.40 |
| Fiscal Year | 2025 | 2025 |
Income Statement Analysis: The Bottom-Line Duel
This income statement comparison reveals which company runs a more efficient and profitable business engine over recent years.
Marsh & McLennan Companies, Inc. Analysis
Marsh & McLennan’s revenue grew steadily from $19.8B in 2021 to $27B in 2025, with net income rising from $3.14B to $4.16B. The net margin held firm around 15%, despite a drop in reported gross profit in 2025. Operating income expanded, but margin compression signals emerging cost pressures and efficiency challenges.
Brown & Brown, Inc. Analysis
Brown & Brown nearly doubled revenue from $3B in 2021 to $6B in 2025, with net income climbing from $574M to $1.05B. The firm maintains a strong gross margin near 88% and a net margin above 17%. Recent years show robust top-line momentum and operating margin expansion, though net margin dipped slightly in 2025.
Scale Growth vs. Margin Resilience
Brown & Brown outpaces Marsh & McLennan in revenue and net income growth, driven by superior margin expansion and operational efficiency. Marsh & McLennan’s scale dwarfs Brown & Brown, but margin erosion and flat gross profit raise caution. Investors favor Brown & Brown’s higher margin profile and faster growth for long-term profitability.
Financial Ratios Comparison
These vital ratios act as a diagnostic tool to expose the underlying fiscal health, valuation premiums, and capital efficiency of the companies analyzed:
| Ratios | Marsh & McLennan Companies, Inc. (MMC) | Brown & Brown, Inc. (BRO) |
|---|---|---|
| ROE | 7.18% | 8.38% |
| ROIC | 12.1% | 5.89% |
| P/E | 21.90 | 23.44 |
| P/B | 157.32 | 1.97 |
| Current Ratio | 1.10 | 1.04 |
| Quick Ratio | 1.10 | 1.04 |
| D/E (Debt-to-Equity) | 37.04 | 0.64 |
| Debt-to-Assets | 36.53% | 27.00% |
| Interest Coverage | 6.48 | 5.71 |
| Asset Turnover | 0.46 | 0.20 |
| Fixed Asset Turnover | 0 | 9.36 |
| Payout Ratio | 40.8% | 18.4% |
| Dividend Yield | 1.87% | 0.79% |
| Fiscal Year | 2025 | 2025 |
Efficiency & Valuation Duel: The Vital Signs
Financial ratios serve as a company’s DNA, unveiling hidden risks and operational strengths critical to investor insight.
Marsh & McLennan Companies, Inc.
Marsh & McLennan posts a moderate ROE near 7.18%, signaling average profitability relative to equity. Its valuation appears stretched, with an EV/Sales above 4 and EV/EBITDA exceeding 120, suggesting premium pricing. The company’s negative free cash flow to equity points to reinvestment over dividends, focusing on growth and operational expansion.
Brown & Brown, Inc.
Brown & Brown shows a modest ROE of 8.38%, slightly outperforming Marsh & McLennan but still below ideal benchmarks. Its P/E ratio of 23.44 and EV/Sales near 4.9 indicate a fairly priced stock. The firm maintains a small dividend yield of 0.79%, balancing shareholder returns with steady reinvestment in business efficiency and asset turnover.
Moderate Premium vs. Reinvestment Discipline
Brown & Brown offers a better balance of valuation and profitability, with fewer stretched metrics than Marsh & McLennan. Investors seeking moderate risk with a lean dividend might prefer Brown’s profile. Those favoring reinvestment-driven growth must weigh Marsh’s stretched valuation against its operational ambitions.
Which one offers the Superior Shareholder Reward?
I compare Marsh & McLennan Companies (MMC) and Brown & Brown (BRO) on dividend yield, payout ratio, and buyback intensity. MMC yields 1.87% with a 41% payout, supporting dividends well with free cash flow. BRO yields 0.79% with an 18% payout, retaining more for growth and buybacks. MMC’s higher payout is sustainable, backed by strong cash flow and consistent buybacks. BRO’s modest yield and lower payout ratio suggest a growth-focused reinvestment strategy with active buybacks enhancing returns. I conclude MMC offers the superior total shareholder reward for 2026, balancing income and capital return more reliably.
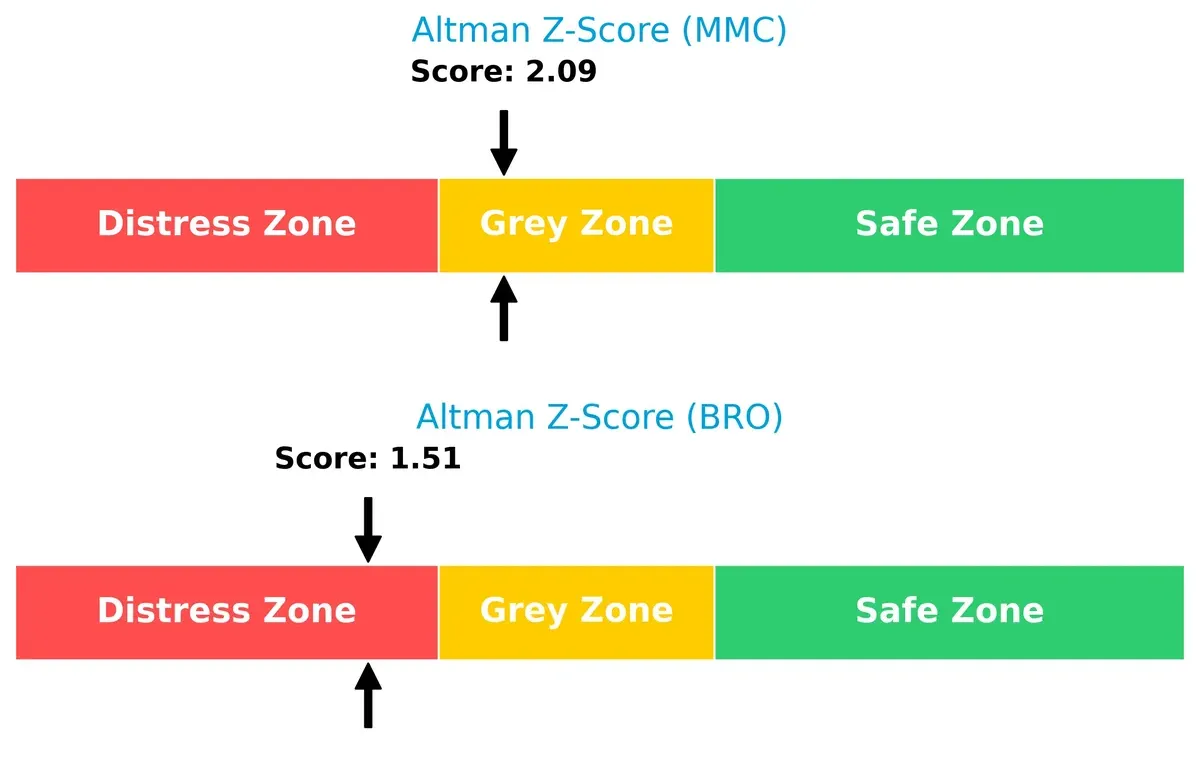
Bankruptcy Risk: Solvency Showdown
I compare Marsh & McLennan’s Altman Z-Score of 2.09 in the grey zone against Brown & Brown’s weaker 1.51 in the distress zone. This gap highlights Marsh’s relatively safer financial footing for long-term survival in this cycle:
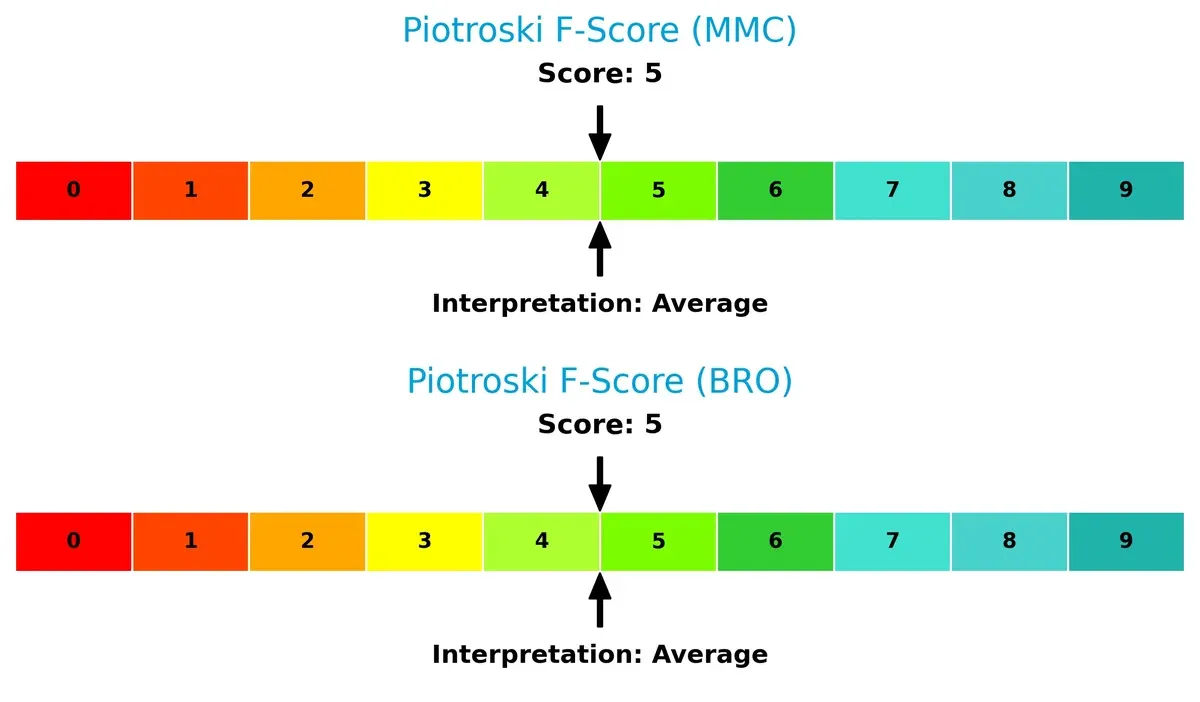
Financial Health: Quality of Operations
Both firms score a 5 on the Piotroski F-Score, indicating average financial health. Neither shows strong red flags, but they also lack the robust financial quality seen in top-tier peers:
How are the two companies positioned?
This section dissects MMC and BRO’s operational DNA by comparing revenue distribution and internal dynamics, including strengths and weaknesses. The goal is to confront their economic moats and determine which model offers the most resilient competitive advantage today.
Revenue Segmentation: The Strategic Mix
The following visual comparison dissects how Marsh & McLennan and Brown & Brown diversify their income streams and where their primary sector bets lie:
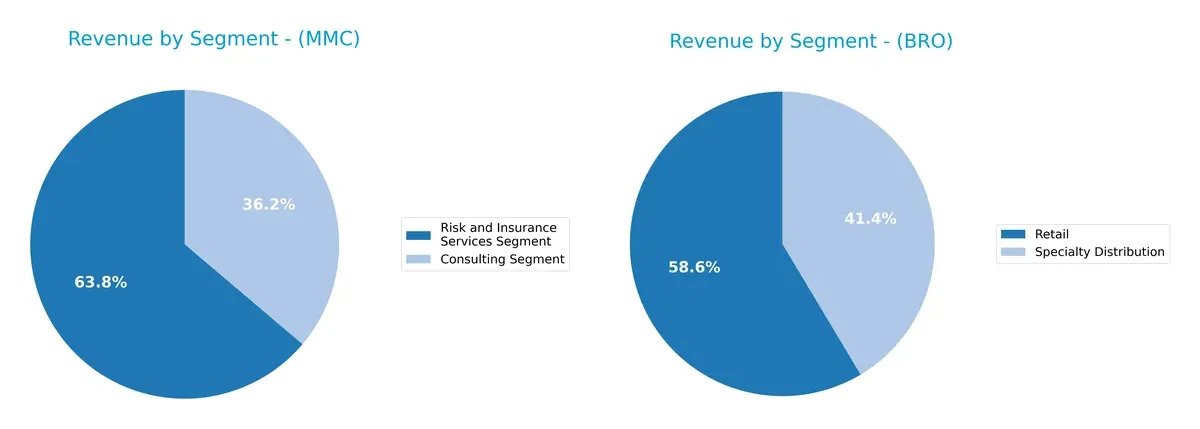
Marsh & McLennan anchors its revenue in two robust segments: $17.3B from Risk and Insurance Services and $9.8B from Consulting. This balanced mix reduces concentration risk and supports ecosystem lock-in through consulting integration. Brown & Brown pivots primarily on Retail at $3.4B, with Specialty Distribution adding $2.4B, revealing a less diversified but focused brokerage strategy. Marsh’s broader base signals a stronger moat against market volatility.
Strengths and Weaknesses Comparison
This table compares the Strengths and Weaknesses of Marsh & McLennan Companies, Inc. (MMC) and Brown & Brown, Inc. (BRO):
MMC Strengths
- Diversified revenue with significant consulting and insurance segments
- Strong global presence across US, UK, and other regions
- Large market share in risk and insurance services
BRO Strengths
- Favorable net margin and interest coverage ratios
- Balanced retail and specialty distribution segments
- Favorable debt to assets and quick ratio metrics
MMC Weaknesses
- Missing key financial ratios data limits assessment
- No explicit profitability or innovation metrics provided
BRO Weaknesses
- Unfavorable ROE and asset turnover ratios
- Low dividend yield may concern income investors
Overall, MMC shows broad diversification and global reach but lacks disclosed profitability metrics, creating transparency challenges. BRO presents solid profitability ratios but reveals weaknesses in return efficiency, which may affect capital allocation strategies.
The Moat Duel: Analyzing Competitive Defensibility
A structural moat is the sole barrier protecting long-term profits from relentless competitive erosion. Let’s dissect the key sources for Marsh & McLennan and Brown & Brown:
Marsh & McLennan Companies, Inc.: Diversified Advisory Expertise Moat
I see MMC’s moat rooted in its intangible assets—strong brand reputation and diverse consulting expertise. This manifests as stable net margins near 15%, despite uneven gross profit trends. Expansion in global risk advisory deepens its moat in 2026, but margin pressure demands close monitoring.
Brown & Brown, Inc.: Niche Brokerage Scale Moat
BRO’s moat leans on cost advantages and scalable distribution in niche insurance markets, outperforming MMC in gross margin (88%) and EBIT margin (28%). However, declining ROIC signals weakening profitability. Growth opportunities in specialty insurance remain, but sustaining value creation is a challenge.
Moat Strength Showdown: Diversification vs. Scale Efficiency
MMC’s intangible asset moat offers broader diversification and margin resilience, while BRO’s scale-driven moat currently faces profitability erosion. I consider MMC’s moat deeper and better positioned to defend market share amid evolving industry pressures.
Which stock offers better returns?
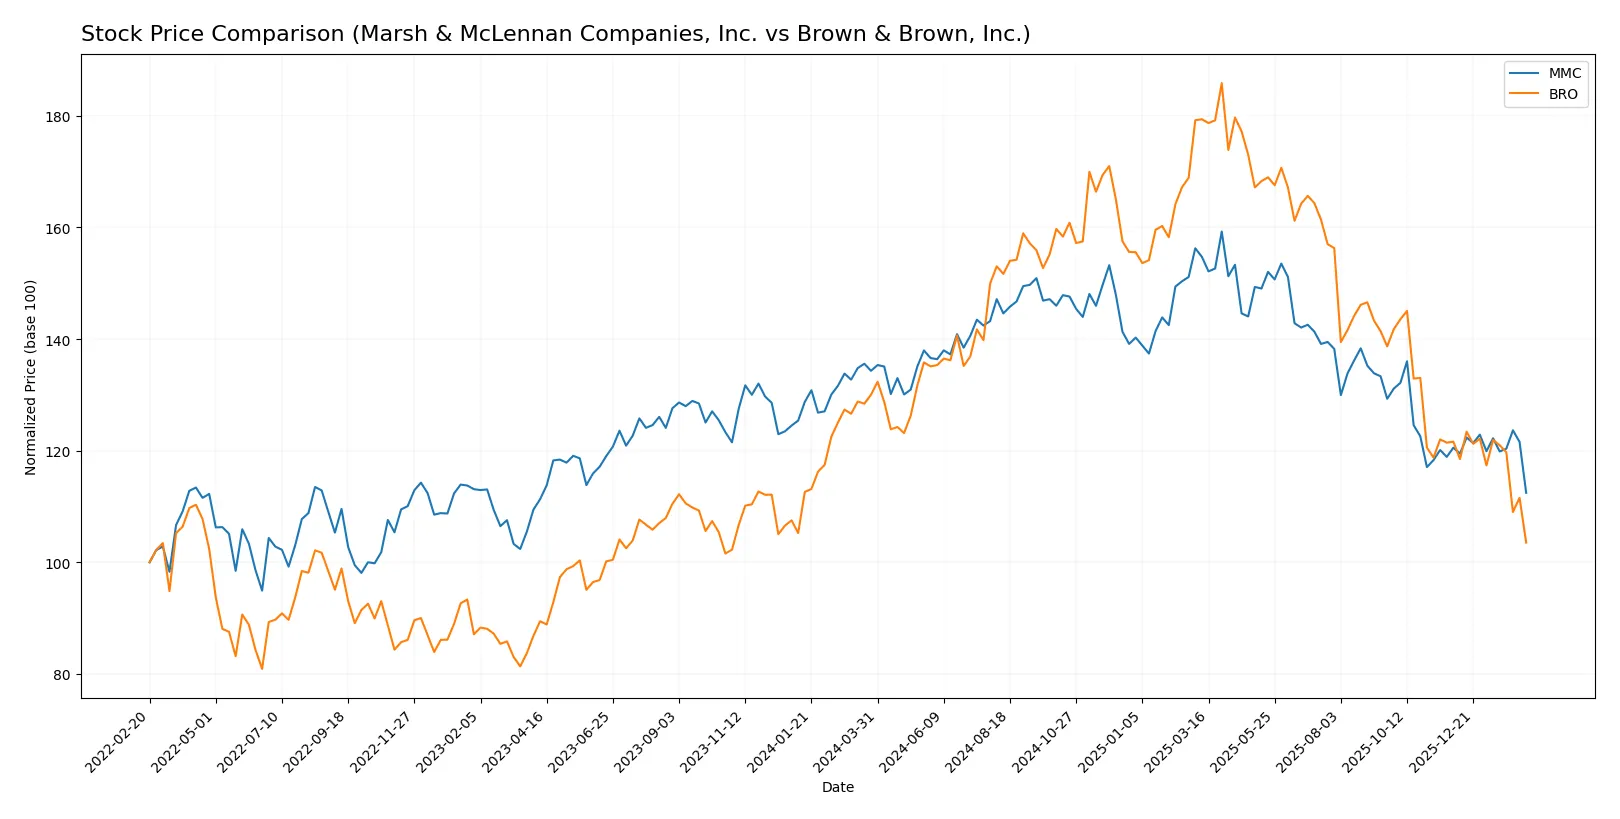
Over the past year, both Marsh & McLennan Companies and Brown & Brown experienced significant price declines, reflecting bearish trends with decelerating momentum and differing trading dynamics.
Trend Comparison
Marsh & McLennan Companies’ stock fell 16.28% over the past 12 months, showing a bearish trend with deceleration and a volatility of 16.46. The price ranged from 242.39 to 171.14.
Brown & Brown’s stock declined 20.38% over the same period, also bearish and decelerating, with lower volatility at 12.75. Its price fluctuated between 122.93 and 68.47.
Marsh & McLennan outperformed Brown & Brown by 4.1 percentage points, delivering the relatively higher market returns despite both showing sustained downward trends.
Target Prices
Analysts show a bullish consensus for Marsh & McLennan Companies and a moderate outlook for Brown & Brown.
| Company | Target Low | Target High | Consensus |
|---|---|---|---|
| Marsh & McLennan Companies, Inc. | 190 | 257 | 211.1 |
| Brown & Brown, Inc. | 88 | 89 | 88.5 |
Marsh & McLennan’s consensus target sits 15% above its current price of $182.7, signaling upside potential. Brown & Brown’s target exceeds its $68.5 price by nearly 29%, reflecting stronger relative optimism.

Don’t Let Luck Decide Your Entry Point
Optimize your entry points with our advanced ProRealTime indicators. You’ll get efficient buy signals with precise price targets for maximum performance. Start outperforming now!
How do institutions grade them?
Marsh & McLennan Companies, Inc. Grades
The following table summarizes recent analyst grades from major financial institutions on MMC:
| Grading Company | Action | New Grade | Date |
|---|---|---|---|
| Cantor Fitzgerald | Maintain | Overweight | 2026-01-14 |
| Wells Fargo | Maintain | Equal Weight | 2026-01-13 |
| Barclays | Maintain | Overweight | 2026-01-08 |
| Evercore ISI Group | Maintain | Outperform | 2026-01-07 |
| JP Morgan | Maintain | Overweight | 2026-01-07 |
| Keefe, Bruyette & Woods | Maintain | Market Perform | 2026-01-06 |
| Citigroup | Maintain | Neutral | 2025-12-04 |
| Barclays | Upgrade | Overweight | 2025-11-20 |
| B of A Securities | Downgrade | Underperform | 2025-11-03 |
| TD Cowen | Maintain | Hold | 2025-11-03 |
Brown & Brown, Inc. Grades
Below is a summary of recent analyst grades from recognized firms for BRO:
| Grading Company | Action | New Grade | Date |
|---|---|---|---|
| Wells Fargo | Maintain | Equal Weight | 2026-02-13 |
| Keefe, Bruyette & Woods | Upgrade | Market Perform | 2026-01-29 |
| BMO Capital | Maintain | Market Perform | 2026-01-29 |
| Morgan Stanley | Maintain | Equal Weight | 2026-01-29 |
| UBS | Maintain | Neutral | 2026-01-29 |
| Truist Securities | Maintain | Buy | 2026-01-28 |
| Jefferies | Maintain | Hold | 2026-01-28 |
| Mizuho | Maintain | Neutral | 2026-01-28 |
| Wells Fargo | Maintain | Equal Weight | 2026-01-28 |
| Citigroup | Downgrade | Neutral | 2026-01-28 |
Which company has the best grades?
Marsh & McLennan holds a stronger consensus with multiple Overweight and Outperform ratings versus Brown & Brown’s more mixed Market Perform and Equal Weight grades. This divergence may influence investor perceptions of relative growth potential and risk.
Risks specific to each company
The following categories identify the critical pressure points and systemic threats facing both firms in the 2026 market environment:
1. Market & Competition
Marsh & McLennan Companies, Inc. (MMC)
- Large market cap provides competitive resilience but faces intense pressure from global consulting firms.
Brown & Brown, Inc. (BRO)
- Smaller market cap and niche segments increase vulnerability to competitive shifts and pricing pressures.
2. Capital Structure & Debt
Marsh & McLennan Companies, Inc. (MMC)
- No detailed debt ratios available, increasing uncertainty around leverage risk.
Brown & Brown, Inc. (BRO)
- Debt-to-assets at 27%, interest coverage at 5.62x, reflecting manageable financial risk.
3. Stock Volatility
Marsh & McLennan Companies, Inc. (MMC)
- Beta of 0.75 suggests below-market volatility, offering defensive qualities.
Brown & Brown, Inc. (BRO)
- Beta of 0.79 indicates slightly higher volatility but still below market average.
4. Regulatory & Legal
Marsh & McLennan Companies, Inc. (MMC)
- Operates globally with exposure to complex regulations in risk consulting and insurance advisory.
Brown & Brown, Inc. (BRO)
- Diverse geographic footprint includes Bermuda and Cayman Islands, increasing regulatory complexity.
5. Supply Chain & Operations
Marsh & McLennan Companies, Inc. (MMC)
- Service business model limits traditional supply chain risks but relies heavily on talent retention.
Brown & Brown, Inc. (BRO)
- Operational risk linked to managing multiple segments including claims administration and wholesale brokerage.
6. ESG & Climate Transition
Marsh & McLennan Companies, Inc. (MMC)
- As a risk advisory leader, MMC faces pressure to integrate climate risk into advisory services.
Brown & Brown, Inc. (BRO)
- ESG risks less transparent but growing importance in underwriting and client sustainability demands.
7. Geopolitical Exposure
Marsh & McLennan Companies, Inc. (MMC)
- Global operations expose MMC to geopolitical tensions affecting consulting and insurance markets.
Brown & Brown, Inc. (BRO)
- Exposure in multiple jurisdictions adds complexity but also diversification benefits.
Which company shows a better risk-adjusted profile?
Marsh & McLennan’s missing financial ratio data raises caution, yet its global scale and lower stock volatility offer risk advantages. Brown & Brown’s moderate debt and distress-zone Altman Z-score highlight financial fragility despite favorable operational metrics. The single biggest risk for MMC is regulatory complexity, while BRO’s financial distress signals higher bankruptcy risk. Given these factors, MMC presents a stronger risk-adjusted profile supported by its defensive beta and diversified service lines.
Final Verdict: Which stock to choose?
Marsh & McLennan Companies, Inc. (MMC) showcases a superpower in its resilience and operational cash flow generation despite recent earnings volatility. Its point of vigilance lies in a weakening free cash flow to equity, signaling cautious capital allocation. MMC suits an aggressive growth portfolio focused on long-term value creation.
Brown & Brown, Inc. (BRO) boasts a strategic moat through its consistent gross margins and recurring revenue safety, underpinning stable profitability. While its financial health faces pressure from declining ROIC and distress zone bankruptcy signals, BRO offers better safety relative to MMC. It fits a GARP (Growth at a Reasonable Price) portfolio seeking steady income with moderate risk.
If you prioritize aggressive growth and operational cash flow strength, MMC is the compelling choice due to its capacity to generate firm-level free cash flow. However, if you seek stability combined with a durable competitive moat, BRO offers better safety despite its value destruction trend. Both carry risks that require careful portfolio fitment and risk tolerance assessment.
Disclaimer: Investment carries a risk of loss of initial capital. The past performance is not a reliable indicator of future results. Be sure to understand risks before making an investment decision.
Go Further
I encourage you to read the complete analyses of Marsh & McLennan Companies, Inc. and Brown & Brown, Inc. to enhance your investment decisions: