Home > Comparison > Financial Services > BRO vs ERIE
The strategic rivalry between Brown & Brown, Inc. and Erie Indemnity Company shapes the competitive landscape of insurance brokerage. Brown & Brown operates a diversified, multi-segment brokerage model with broad geographic reach, while Erie Indemnity functions as a specialized managing attorney-in-fact focused on underwriting and policy services. This analysis pits Brown & Brown’s scale and service diversity against Erie’s operational focus to identify which offers superior risk-adjusted returns in the evolving insurance sector.

Table of contents
Companies Overview
Brown & Brown and Erie Indemnity dominate distinct niches within the US insurance brokerage market.
Brown & Brown, Inc.: Multifaceted Insurance Brokerage Leader
Brown & Brown stands as a diversified insurance broker operating across multiple international markets. Its revenue flows from four segments: Retail, National Programs, Wholesale Brokerage, and Services. In 2026, the firm emphasizes expanding its specialty insurance offerings and enhancing third-party claims administration, leveraging a broad product suite to serve commercial, public, and individual clients.
Erie Indemnity Company: Focused Managing Attorney-in-Fact
Erie Indemnity serves as the managing attorney-in-fact for Erie Insurance Exchange subscribers in the US. It generates revenue mainly through underwriting, policy issuance, and renewals, alongside sales and administrative support. Its 2026 strategy centers on optimizing underwriting processes and strengthening agent compensation and sales support to deepen customer loyalty and operational efficiency.
Strategic Collision: Similarities & Divergences
Both companies operate in the insurance brokerage sector but embrace distinct models—Brown & Brown favors a segmented, product-diversification strategy, while Erie Indemnity focuses on a tightly integrated managing attorney-in-fact role. Their primary battleground lies in market share within property and casualty insurance. Investors will note Brown & Brown’s expansive scale contrasts with Erie’s tightly controlled, niche operational focus.
Income Statement Comparison
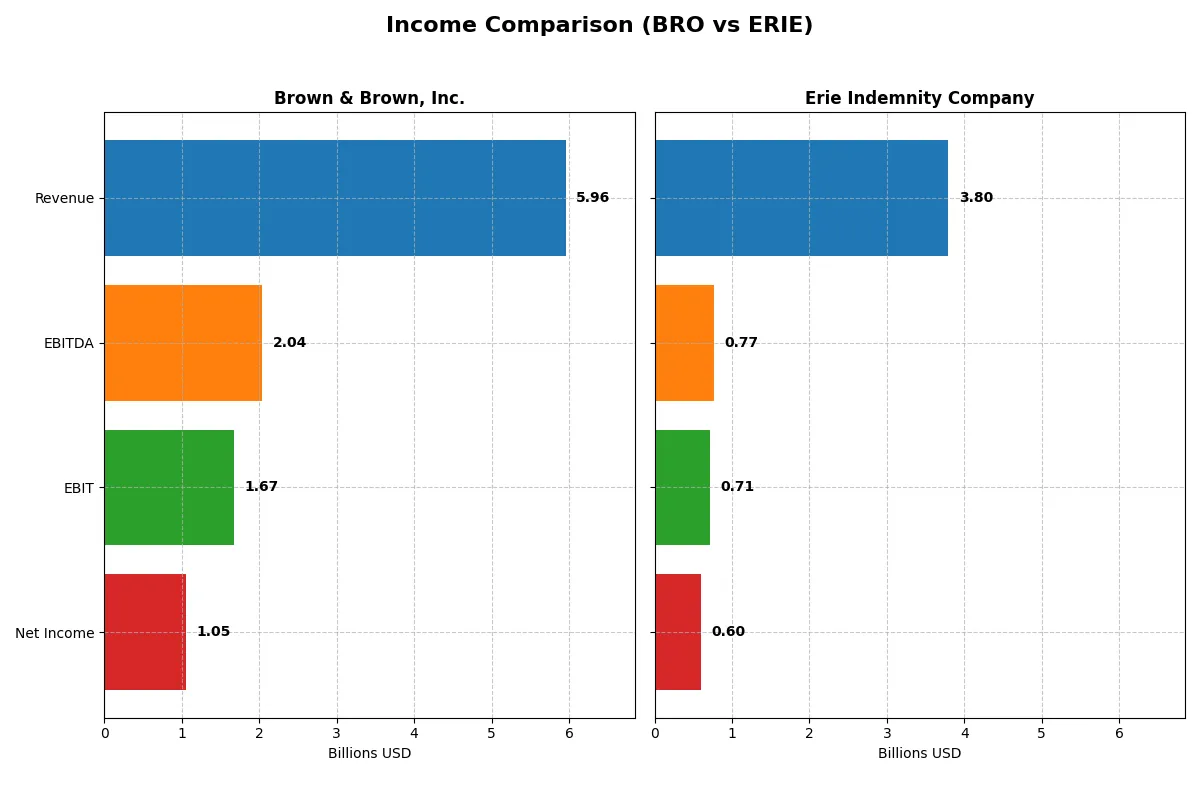
The following data dissects the core profitability and scalability of both corporate engines to reveal who dominates the bottom line:
| Metric | Brown & Brown, Inc. (BRO) | Erie Indemnity Company (ERIE) |
|---|---|---|
| Revenue | 5.96B | 3.80B |
| Cost of Revenue | 734M | 3.12B |
| Operating Expenses | 3.53B | 0 |
| Gross Profit | 5.22B | 676M |
| EBITDA | 2.04B | 766M |
| EBIT | 1.67B | 710M |
| Interest Expense | 297M | 0 |
| Net Income | 1.05B | 600M |
| EPS | 3.37 | 12.89 |
| Fiscal Year | 2025 | 2024 |
Income Statement Analysis: The Bottom-Line Duel
The following income statement comparison uncovers which company runs its financial engine with superior efficiency and profitability.
Brown & Brown, Inc. Analysis
Brown & Brown’s revenue nearly doubled from 3B in 2021 to 6B in 2025, with net income rising 79% to 1.05B. Its gross margin stands exceptionally high at 87.7%, showcasing formidable pricing power and operational control. Despite a 17.7% net margin, recent EPS dipped 8.7%, signaling some pressure on bottom-line momentum.
Erie Indemnity Company Analysis
Erie’s revenue advanced steadily from 2.5B in 2020 to 3.8B in 2024, while net income more than doubled to 600M. Its gross margin remains modest at 17.8%, but it sustains a strong net margin of 15.8%. Erie’s consistent EPS growth of 34.6% last year highlights robust earnings momentum and efficient capital deployment.
Margin Dominance vs. Earnings Momentum
Brown & Brown boasts a commanding gross margin and superior scale, but Erie posts stronger net margin growth and EPS acceleration. Numerically, Brown leads in absolute profits, yet Erie’s rapid earnings surge and expanding margins offer a compelling growth profile. Investors seeking stable profitability may favor Brown, while those chasing dynamic earnings growth might lean toward Erie.
Financial Ratios Comparison
These vital ratios act as a diagnostic tool to expose the underlying fiscal health, valuation premiums, and capital efficiency of the companies compared below:
| Ratios | Brown & Brown, Inc. (BRO) | Erie Indemnity Company (ERIE) |
|---|---|---|
| ROE | 15.4% (2024) | 30.2% (2024) |
| ROIC | 9.1% (2024) | 25.6% (2024) |
| P/E | 29.0 (2024) | 31.7 (2024) |
| P/B | 4.47 (2024) | 9.58 (2024) |
| Current Ratio | 1.10 (2024) | 1.43 (2024) |
| Quick Ratio | 1.10 (2024) | 1.43 (2024) |
| D/E | 0.63 (2024) | 0.004 (2024) |
| Debt-to-Assets | 23.1% (2024) | 0.26% (2024) |
| Interest Coverage | 6.8 (2024) | 0 (2024) |
| Asset Turnover | 0.27 (2024) | 1.31 (2024) |
| Fixed Asset Turnover | 9.07 (2024) | 7.39 (2024) |
| Payout ratio | 15.5% (2024) | 39.6% (2024) |
| Dividend yield | 0.54% (2024) | 1.25% (2024) |
| Fiscal Year | 2024 | 2024 |
Efficiency & Valuation Duel: The Vital Signs
Financial ratios act as the company’s DNA, exposing hidden risks and revealing operational excellence behind headline figures.
Brown & Brown, Inc.
Brown & Brown shows a solid net margin of 17.7%, signaling efficient core profitability despite an unfavorable zero ROE and ROIC. Its P/E ratio at 23.44 remains neutral, indicating fair valuation. Shareholder returns lean on dividends with a low yield of 0.79%, suggesting modest income but possible reinvestment elsewhere.
Erie Indemnity Company
Erie posts a robust ROE of 30.21% and ROIC of 25.61%, demonstrating strong capital efficiency and profitability. However, its P/E of 31.72 and PB of 9.58 paint an expensive valuation picture. The company balances this with a 1.25% dividend yield and healthy liquidity, supporting steady shareholder returns.
Premium Valuation vs. Operational Safety
Erie offers superior profitability and operational efficiency but trades at a premium, increasing valuation risk. Brown & Brown presents a more moderate valuation with weaker returns but stable dividend income. Investors seeking growth may favor Erie, while those prioritizing income and valuation discipline might prefer Brown & Brown.
Which one offers the Superior Shareholder Reward?
I observe that Brown & Brown (BRO) offers a modest dividend yield near 0.79% with a conservative payout ratio around 18%, supported by strong free cash flow coverage of 7.47x. Its buyback activity appears restrained but consistent, preserving capital for steady returns. Erie Indemnity (ERIE) delivers a higher dividend yield of approximately 1.25% but pays out nearly 40% of earnings, with dividend coverage just 1.69x, suggesting less cushion. Erie’s buybacks are less evident, indicating a heavier reliance on dividends for shareholder reward. Historically, BRO’s balanced approach combining dividends and buybacks signals more sustainable capital allocation. In 2026, I favor BRO for superior total shareholder return due to its disciplined payout and reinvestment strategy amidst market cycles.
Comparative Score Analysis: The Strategic Profile
The radar chart reveals the fundamental DNA and trade-offs of Brown & Brown, Inc. and Erie Indemnity Company, highlighting their core financial strengths and weaknesses:
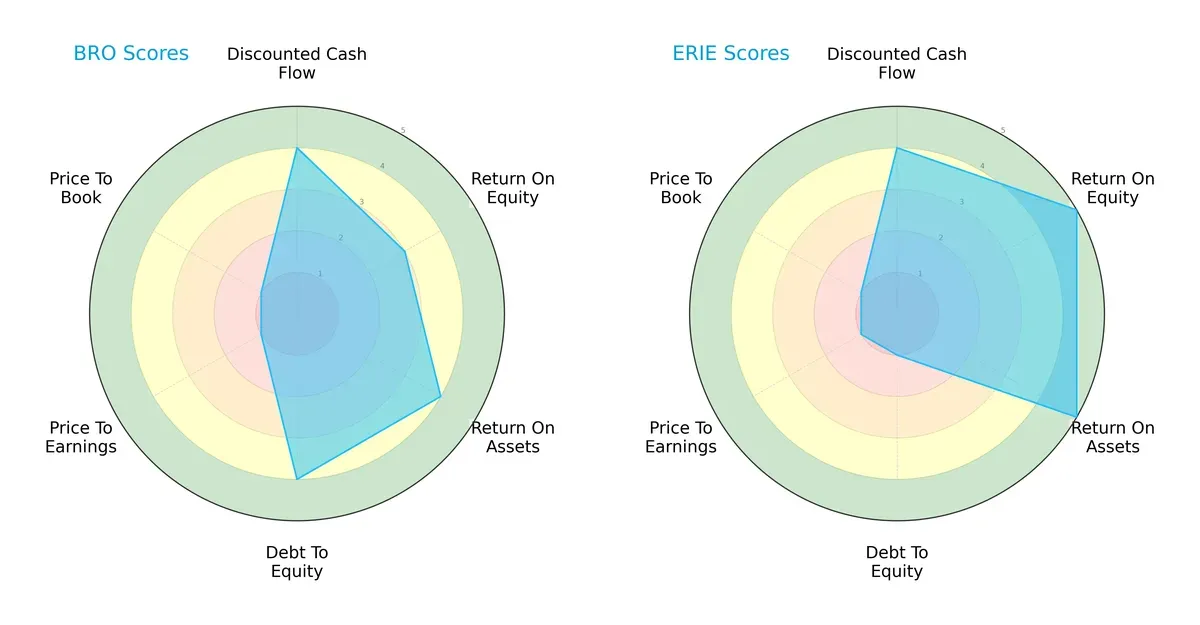
Brown & Brown shows balanced strength in debt management (score 4) and asset efficiency (score 4) with moderate equity returns (score 3). Erie excels in profitability metrics with top ROE (5) and ROA (5) scores but carries a high financial risk due to a weak debt-to-equity score (1). Brown & Brown offers a more stable financial profile, while Erie relies heavily on operational efficiency despite leverage concerns.
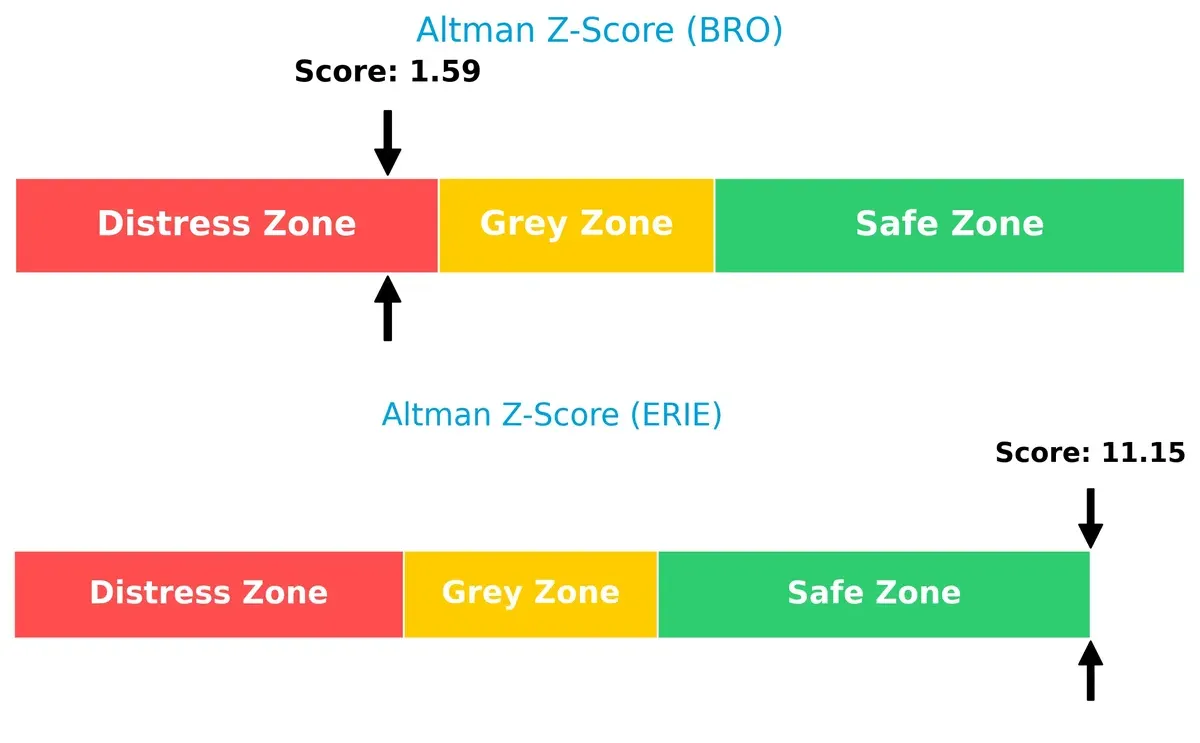
Bankruptcy Risk: Solvency Showdown
Erie’s Altman Z-Score of 11.15 places it firmly in the safe zone, signaling robust long-term solvency. Brown & Brown’s 1.59 score situates it in the distress zone, indicating higher bankruptcy risk in this cycle:
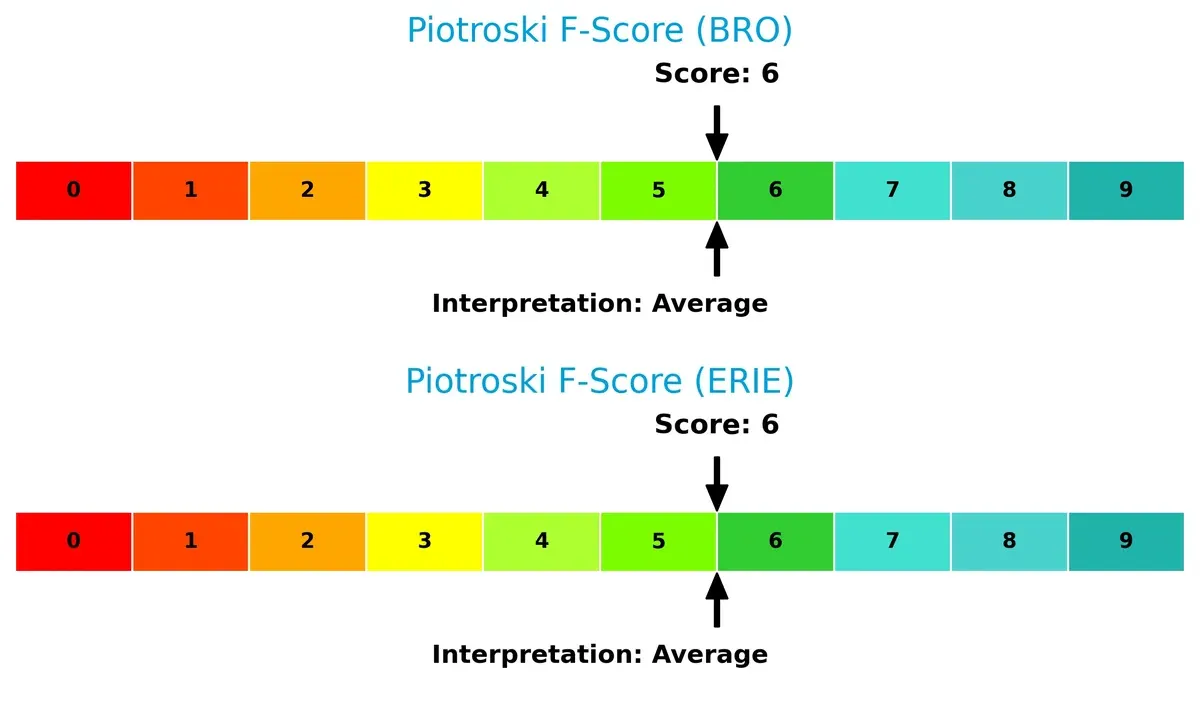
Financial Health: Quality of Operations
Both firms share an average Piotroski F-Score of 6, suggesting moderate financial health. Neither shows glaring internal red flags, but there’s room for improvement to reach peak operational strength:
How are the two companies positioned?
This section dissects the operational DNA of Brown & Brown and Erie by comparing their revenue distribution and internal dynamics, including strengths and weaknesses. The goal is to confront their economic moats to identify which model offers the most resilient competitive advantage today.
Revenue Segmentation: The Strategic Mix
The following visual comparison dissects how Brown & Brown, Inc. and Erie Indemnity Company diversify their income streams and where their primary sector bets lie:
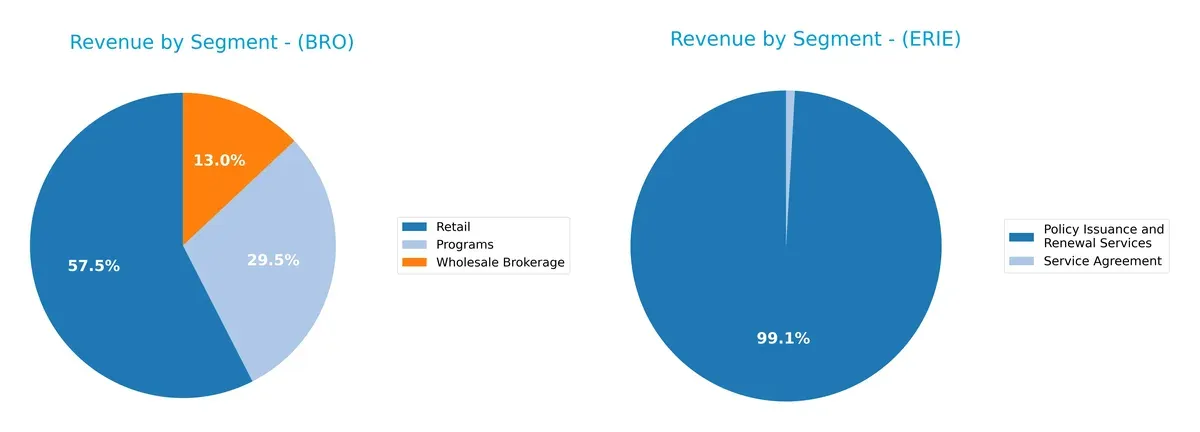
Brown & Brown anchors its revenue with a diversified mix: Retail leads at $2.73B, supported by Programs at $1.4B and Wholesale Brokerage at $616M. Erie Indemnity dwarfs others with $2.89B from Policy Issuance and Renewal Services, while Service Agreement revenue is negligible at $26M. Brown & Brown’s diversified model reduces concentration risk. Erie’s heavy reliance on a single segment signals strong ecosystem lock-in but exposes it to sector-specific volatility.
Strengths and Weaknesses Comparison
This table compares the strengths and weaknesses of Brown & Brown, Inc. (BRO) and Erie Indemnity Company (ERIE):
BRO Strengths
- Diverse revenue streams in Programs, Retail, Wholesale Brokerage
- Strong net margin at 17.7%
- Favorable debt to equity and interest coverage ratios
- Established presence in US, UK, Canada, Ireland
ERIE Strengths
- High net margin at 15.82% and ROE at 30.21%
- Strong ROIC above WACC at 25.61%
- Excellent liquidity with quick ratio 1.43
- High asset turnover and fixed asset turnover
- Favorable debt ratios and infinite interest coverage
BRO Weaknesses
- Unfavorable ROE and ROIC at 0%
- Unavailable WACC data
- Poor liquidity ratios at 0
- Low dividend yield 0.79%
- Unfavorable asset turnover and fixed asset turnover
ERIE Weaknesses
- High P/E at 31.72 and high P/B at 9.58
- Neutral current ratio at 1.43
- Moderate dividend yield at 1.25%
BRO shows strength in diversified revenue and solid debt management but suffers from weak profitability metrics and liquidity. ERIE demonstrates robust profitability and operational efficiency but faces valuation concerns and moderate liquidity. Each company’s financial profile suggests distinct strategic priorities.
The Moat Duel: Analyzing Competitive Defensibility
A structural moat is the only safeguard preserving long-term profits from relentless competitive pressure. Let’s dissect how two brokers defend their turf:
Brown & Brown, Inc.: Diversified Broker with Intangible Asset Strength
Brown & Brown leverages broad geographic reach and deep client relationships as intangible assets. Its 28% EBIT margin shows operational resilience. However, declining ROIC signals looming pressure on capital efficiency in 2026.
Erie Indemnity Company: High-ROIC Value Creator with Cost Advantage
Erie’s moat centers on superior capital allocation and underwriting discipline, reflected in a robust 20% ROIC above WACC and expanding margins. I see Erie’s growing profitability underpinning stronger competitive durability versus Brown & Brown.
Capital Efficiency vs. Operational Breadth: Erie’s Sharper Moat Wins
Erie Indemnity’s rising ROIC and value creation mark a deeper moat than Brown & Brown’s eroding capital returns. Erie is better equipped to defend market share through disciplined growth and superior profitability.
Which stock offers better returns?
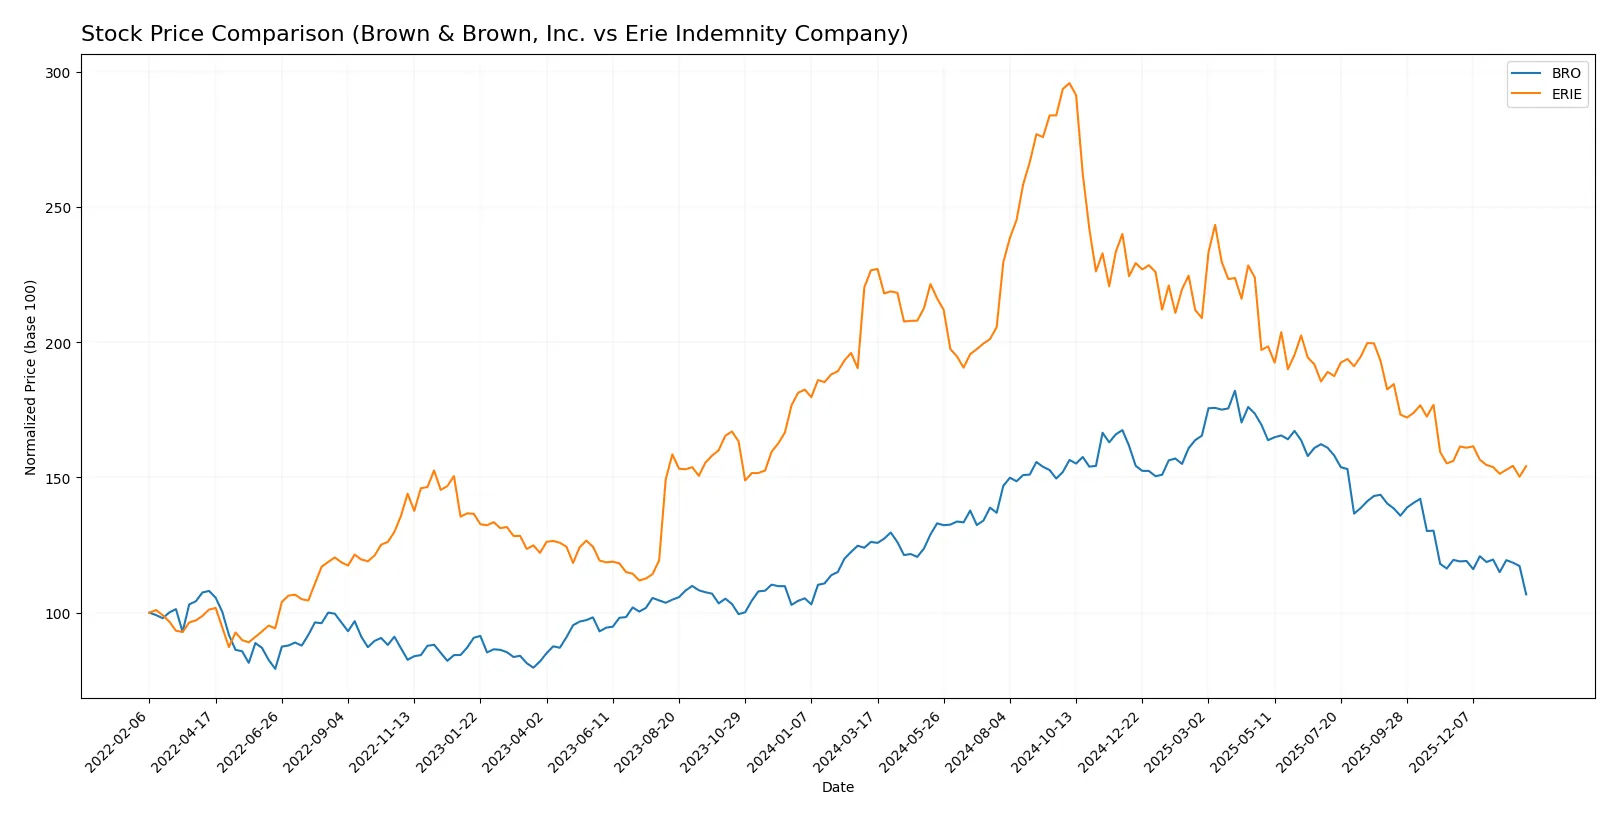
The past year showed marked declines for both stocks, with Brown & Brown, Inc. and Erie Indemnity Company experiencing pronounced bearish trends and varying degrees of deceleration.
Trend Comparison
Brown & Brown, Inc. fell 15.37% over the past 12 months, confirming a bearish trend with decelerating losses. The stock ranged from a high of 122.93 to a low of 72.1, showing moderate volatility (12.3 std dev).
Erie Indemnity Company dropped 31.95% in the same period, also bearish with deceleration. It exhibited significant price swings between 542.86 and 275.85, reflected in a high volatility level (62.78 std dev).
Erie’s stock performance declined more steeply than Brown & Brown’s, delivering the lower market return over the last year. Brown & Brown showed relatively better price stability and a smaller loss.
Target Prices
Analysts show a clear consensus on Brown & Brown, Inc.’s target price, reflecting steady confidence.
| Company | Target Low | Target High | Consensus |
|---|---|---|---|
| Brown & Brown, Inc. | 88 | 89 | 88.5 |
The target consensus at 88.5 indicates a potential 22.8% upside from the current 72.1 stock price, suggesting room for growth. No verified target price data is available for Erie Indemnity Company.

Don’t Let Luck Decide Your Entry Point
Optimize your entry points with our advanced ProRealTime indicators. You’ll get efficient buy signals with precise price targets for maximum performance. Start outperforming now!
How do institutions grade them?
The following tables summarize the latest institutional grades for Brown & Brown, Inc. and Erie Indemnity Company:
Brown & Brown, Inc. Grades
The table below shows recent grading updates from reputable financial institutions for Brown & Brown, Inc.:
| Grading Company | Action | New Grade | Date |
|---|---|---|---|
| BMO Capital | maintain | Market Perform | 2026-01-29 |
| Keefe, Bruyette & Woods | upgrade | Market Perform | 2026-01-29 |
| UBS | maintain | Neutral | 2026-01-29 |
| Morgan Stanley | maintain | Equal Weight | 2026-01-29 |
| Wells Fargo | maintain | Equal Weight | 2026-01-28 |
| Mizuho | maintain | Neutral | 2026-01-28 |
| Truist Securities | maintain | Buy | 2026-01-28 |
| Jefferies | maintain | Hold | 2026-01-28 |
| Citigroup | downgrade | Neutral | 2026-01-28 |
| B of A Securities | maintain | Neutral | 2026-01-27 |
Erie Indemnity Company Grades
No reliable institutional grades are available for Erie Indemnity Company.
Which company has the best grades?
Brown & Brown, Inc. receives a spectrum of grades, mostly in the neutral to market perform range, with isolated buy and hold ratings. Erie Indemnity lacks institutional grading data, limiting comparative insight. Investors face more clarity on Brown & Brown’s current market perception.
Risks specific to each company
The following categories identify the critical pressure points and systemic threats facing both firms in the 2026 market environment:
1. Market & Competition
Brown & Brown, Inc.
- Operates in a highly fragmented insurance brokerage market with strong independent agents. Faces pricing pressure amid rising digital competition.
Erie Indemnity Company
- Focuses on managing Erie Insurance Exchange policies with a concentrated regional footprint. Faces less direct national competition but limited scale.
2. Capital Structure & Debt
Brown & Brown, Inc.
- Favorable debt-to-equity position and solid interest coverage (5.62x). No available WACC data limits full risk assessment.
Erie Indemnity Company
- Minimal debt and excellent interest coverage (infinite). Low debt-to-assets ratio (0.26%) indicates strong balance sheet.
3. Stock Volatility
Brown & Brown, Inc.
- Beta of 0.812 suggests moderate sensitivity to market swings, with a price range of $71.32–125.68.
Erie Indemnity Company
- Low beta of 0.373 signals defensive stock behavior. Price fluctuates between $270.07–456.93, showing resilience.
4. Regulatory & Legal
Brown & Brown, Inc.
- Exposure to multi-jurisdictional insurance regulations across US, Bermuda, UK, and Canada increases compliance complexity.
Erie Indemnity Company
- Primarily US-focused regulatory environment reduces complexity but subject to evolving insurance laws in Pennsylvania and neighboring states.
5. Supply Chain & Operations
Brown & Brown, Inc.
- Diverse operational segments and reliance on independent agents create operational risks but spread exposure.
Erie Indemnity Company
- Centralized operations as managing attorney-in-fact streamline processes, limiting operational complexity but increasing dependence on Erie Insurance Exchange.
6. ESG & Climate Transition
Brown & Brown, Inc.
- No explicit ESG data provided; exposure to climate-related insurance risks in property and casualty lines is material.
Erie Indemnity Company
- No detailed ESG disclosures; regional operations may limit climate transition risks but also reduce diversification.
7. Geopolitical Exposure
Brown & Brown, Inc.
- Operates internationally including Bermuda and UK, exposing it to geopolitical risks such as Brexit and regulatory divergence.
Erie Indemnity Company
- Operations solely in the US limit geopolitical risk, focusing exposure on domestic political and economic factors.
Which company shows a better risk-adjusted profile?
Brown & Brown faces significant risks from international regulatory complexity and operational dispersion but maintains solid capital structure. Erie Indemnity displays a stronger financial footing with minimal debt, lower volatility, and simpler regulatory exposure. However, Erie’s valuation metrics appear stretched, increasing market risk. Erie’s Altman Z-Score firmly in the safe zone contrasts with Brown & Brown’s distress zone, indicating Erie’s superior financial stability. The key risk for Brown & Brown is its financial distress signal, while Erie’s elevated valuation multiples pose valuation risk. Overall, Erie offers a better risk-adjusted profile, supported by its robust balance sheet and lower market sensitivity.
Final Verdict: Which stock to choose?
Brown & Brown, Inc. (BRO) shines as a cash-generating machine with solid income quality and favorable operating margins. Its main point of vigilance lies in declining ROIC trends and a current ratio that signals liquidity caution. BRO suits portfolios aiming for aggressive growth with tolerance for operational risks.
Erie Indemnity Company (ERIE) boasts a durable moat backed by a robust ROIC well above its WACC, signaling efficient capital use and strong competitive positioning. It offers better financial stability and a cleaner balance sheet than BRO. ERIE aligns well with GARP investors seeking steady growth balanced with reasonable risk.
If you prioritize strong economic moats and stable capital efficiency, ERIE outshines as the compelling choice due to its durable competitive advantage and safer financial profile. However, if your strategy leans toward aggressive growth and cash flow strength despite some operational headwinds, BRO could offer attractive upside potential. Both present distinct analytical scenarios depending on your risk appetite and investment horizon.
Disclaimer: Investment carries a risk of loss of initial capital. The past performance is not a reliable indicator of future results. Be sure to understand risks before making an investment decision.
Go Further
I encourage you to read the complete analyses of Brown & Brown, Inc. and Erie Indemnity Company to enhance your investment decisions: