In the fast-evolving semiconductor industry, Broadcom Inc. (AVGO) and Tower Semiconductor Ltd. (TSEM) stand out as key players with distinct strategies and market footprints. Broadcom’s diverse portfolio spans complex infrastructure solutions, while Tower focuses on specialized analog and mixed-signal foundry services. This comparison highlights their innovation and growth potential, helping you identify which company aligns best with your investment goals in 2026. Let’s explore which stock deserves a spot in your portfolio.
Table of contents
Companies Overview
I will begin the comparison between Broadcom Inc. and Tower Semiconductor Ltd. by providing an overview of these two companies and their main differences.
Broadcom Inc. Overview
Broadcom Inc. is a global technology company specializing in semiconductor and infrastructure software solutions. Headquartered in Palo Alto, California, it operates through four segments: Wired Infrastructure, Wireless Communications, Enterprise Storage, and Industrial & Other. Broadcom offers a diverse product portfolio used in data centers, telecommunications, smartphones, and industrial applications, employing approximately 37,000 people worldwide.
Tower Semiconductor Ltd. Overview
Tower Semiconductor Ltd. is an independent semiconductor foundry headquartered in Migdal Haemek, Israel. It manufactures analog intensive mixed-signal semiconductor devices, providing customizable process technologies and wafer fabrication services. The company serves various markets including consumer electronics, automotive, aerospace, and medical devices, with a workforce of around 5,600 employees and a strong presence in the United States, Japan, and Europe.
Key similarities and differences
Both Broadcom and Tower Semiconductor operate in the semiconductor industry and serve diverse technology markets. However, Broadcom focuses on semiconductor design and infrastructure software with a broad product range, while Tower specializes in foundry manufacturing and customized process technologies. Broadcom is significantly larger by market capitalization and workforce, reflecting its broader scope and integrated business model compared to Tower’s foundry-centric approach.
Income Statement Comparison
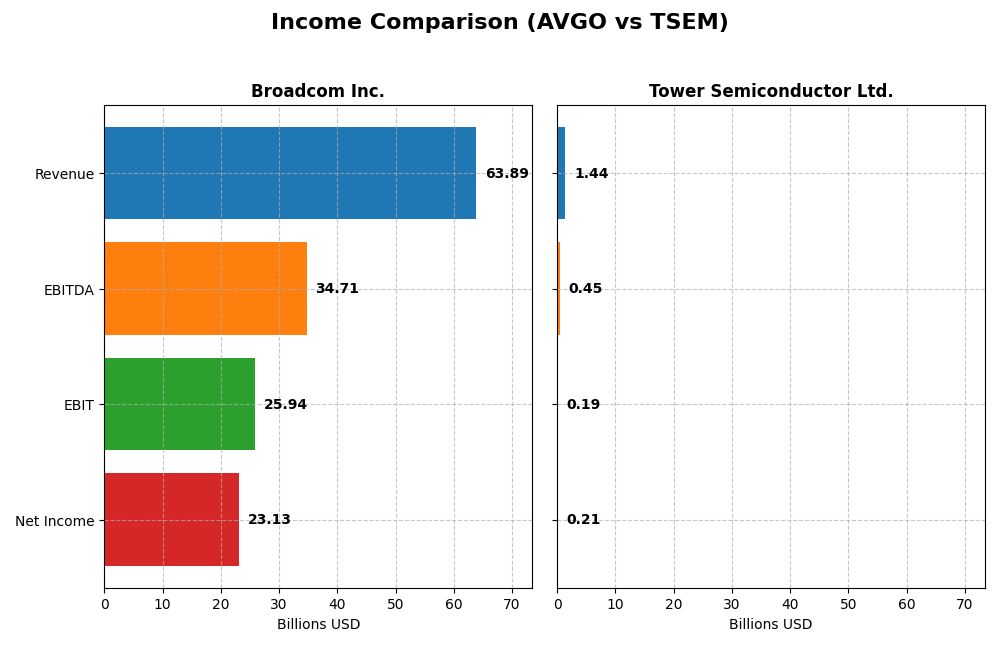
Below is a side-by-side comparison of key income statement metrics for Broadcom Inc. and Tower Semiconductor Ltd. for their most recent fiscal years.
| Metric | Broadcom Inc. (AVGO) | Tower Semiconductor Ltd. (TSEM) |
|---|---|---|
| Market Cap | 1.6T | 13.8B |
| Revenue | 63.9B | 1.44B |
| EBITDA | 34.7B | 451M |
| EBIT | 25.9B | 185M |
| Net Income | 23.1B | 208M |
| EPS | 4.91 | 1.87 |
| Fiscal Year | 2025 | 2024 |
Income Statement Interpretations
Broadcom Inc.
Broadcom Inc. has demonstrated strong revenue growth from $27.45B in 2021 to $63.89B in 2025, with net income rising from $6.44B to $23.13B over the same period. Margins have remained robust, with a gross margin of 67.77% and a net margin of 36.2% in 2025. The latest year showed favorable growth acceleration, including an 87% increase in EBIT and a 217% jump in net margin.
Tower Semiconductor Ltd.
Tower Semiconductor’s revenue grew modestly from $1.27B in 2020 to $1.44B in 2024, while net income increased from $82M to $208M. Margins are comparatively lower, with a 23.64% gross margin and 14.47% net margin in 2024. The most recent year experienced a slowdown, with slight revenue growth of 0.94% and a significant 60% decline in net margin and earnings per share.
Which one has the stronger fundamentals?
Broadcom exhibits stronger fundamentals with high and expanding margins, robust revenue and net income growth, and a very favorable income statement evaluation. Tower Semiconductor shows positive trends over the longer term but suffers from recent margin compression and earnings decline, reflecting mixed income statement results. Overall, Broadcom’s scale and profitability metrics appear more favorable.
Financial Ratios Comparison
The table below summarizes the most recent key financial ratios for Broadcom Inc. and Tower Semiconductor Ltd., providing a snapshot of their profitability, liquidity, leverage, and efficiency for fiscal year 2025 and 2024 respectively.
| Ratios | Broadcom Inc. (2025) | Tower Semiconductor Ltd. (2024) |
|---|---|---|
| ROE | 28.45% | 7.83% |
| ROIC | 16.36% | 6.41% |
| P/E | 73.87 | 27.54 |
| P/B | 21.01 | 2.16 |
| Current Ratio | 1.71 | 6.18 |
| Quick Ratio | 1.58 | 5.23 |
| D/E (Debt-to-Equity) | 0.80 | 0.07 |
| Debt-to-Assets | 38.07% | 5.87% |
| Interest Coverage | 7.94 | 32.64 |
| Asset Turnover | 0.37 | 0.47 |
| Fixed Asset Turnover | 25.25 | 1.11 |
| Payout Ratio | 48.18% | 0% |
| Dividend Yield | 0.65% | 0% |
Interpretation of the Ratios
Broadcom Inc.
Broadcom displays mostly strong financial ratios with favorable net margin at 36.2%, ROE at 28.45%, and ROIC at 16.36%, indicating efficient profitability and capital use. Concerns include high P/E of 73.87 and P/B of 21.01, suggesting overvaluation risk. The company pays dividends, but with a low yield of 0.65%, indicating modest shareholder returns amidst cautious payout levels.
Tower Semiconductor Ltd.
Tower Semiconductor shows mixed ratio performance with a favorable net margin of 14.47% but a weak ROE at 7.83%. The firm benefits from low debt levels and strong interest coverage, but its P/E of 27.54 and zero dividend yield reflect growth focus and limited immediate shareholder returns. The current ratio is unusually high, possibly signaling inefficient working capital use.
Which one has the best ratios?
Broadcom’s ratios generally indicate stronger profitability and capital efficiency compared to Tower Semiconductor, despite concerns about valuation multiples. Tower’s lower leverage and solid interest coverage are positive but offset by weaker profitability and absent dividends. Overall, Broadcom’s financial metrics appear more robust, while Tower shows a more cautious capital structure with room for operational improvement.
Strategic Positioning
This section compares the strategic positioning of Broadcom Inc. and Tower Semiconductor Ltd., including their market position, key segments, and exposure to technological disruption:
Broadcom Inc.
- Leading market position with large scale and competitive pressure in semiconductors
- Diverse segments: infrastructure software and semiconductor solutions drive revenue
- Moderate exposure through semiconductor innovation and firmware integration
Tower Semiconductor Ltd.
- Smaller scale foundry with niche focus, facing moderate competitive pressure
- Focus on analog and mixed-signal semiconductor manufacturing for varied markets
- Exposure via customizable process technologies and wafer fabrication services
Broadcom Inc. vs Tower Semiconductor Ltd. Positioning
Broadcom pursues a diversified approach with software and semiconductor solutions, benefiting from scale but facing complex integration challenges. Tower is more concentrated on analog foundry services, which limits scale but offers specialized technology to diverse end-markets.
Which has the best competitive advantage?
Broadcom demonstrates a very favorable moat with ROIC well above WACC and growing profitability, indicating durable competitive advantages. Tower Semiconductor has a slightly unfavorable moat, currently shedding value despite improving profitability.
Stock Comparison
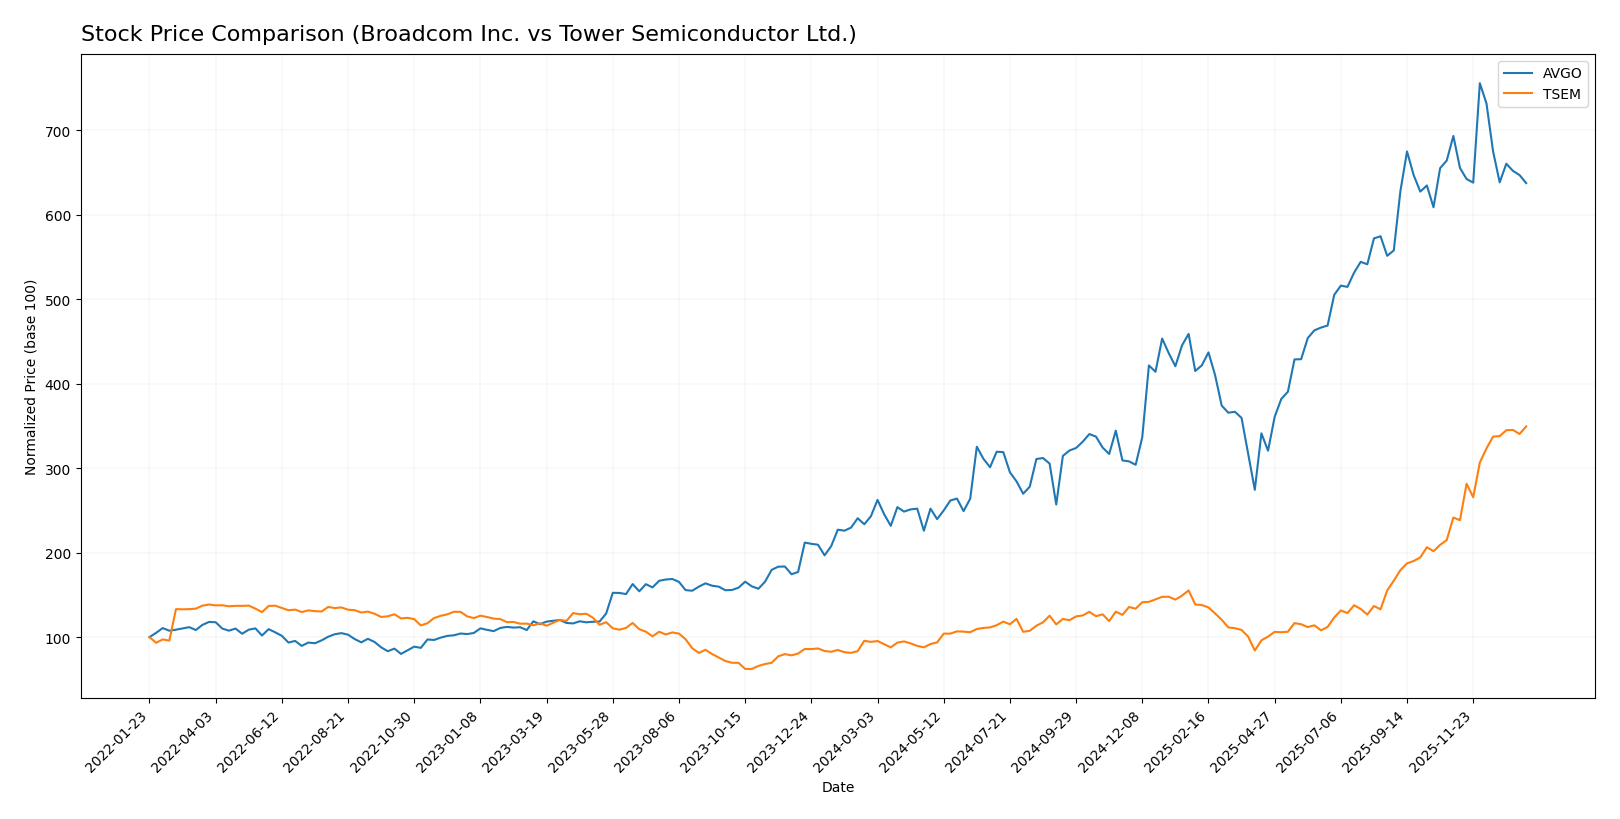
The stock price chart illustrates significant bullish trends for both Broadcom Inc. (AVGO) and Tower Semiconductor Ltd. (TSEM) over the past 12 months, with marked differences in acceleration and recent trading momentum.
Trend Analysis
Broadcom Inc. (AVGO) experienced a strong bullish trend with a 162.18% price increase over the past year, showing deceleration despite a high volatility of 78.56. The stock peaked at 402.96 and bottomed at 120.47.
Tower Semiconductor Ltd. (TSEM) delivered a more pronounced bullish trend with a 270.3% gain and accelerating momentum, supported by lower volatility of 23.65. Its price ranged from 29.65 to a high of 123.2.
Comparing both, TSEM outperformed AVGO with the highest market performance, driven by accelerating gains and stronger recent buyer dominance.
Target Prices
The current analyst consensus for target prices indicates potential upside for both Broadcom Inc. and Tower Semiconductor Ltd.
| Company | Target High | Target Low | Consensus |
|---|---|---|---|
| Broadcom Inc. | 510 | 370 | 454.8 |
| Tower Semiconductor Ltd. | 125 | 66 | 96 |
Broadcom’s target consensus of 454.8 suggests a significant upside compared to its current price of 339.89 USD. Tower Semiconductor’s consensus target of 96 is slightly below its current price of 123.2 USD, indicating mixed analyst expectations.
Analyst Opinions Comparison
This section compares analysts’ ratings and financial scores for Broadcom Inc. and Tower Semiconductor Ltd.:
Rating Comparison
Broadcom Inc. Rating
- Rating: B, considered very favorable overall.
- Discounted Cash Flow Score: 3, indicating moderate value.
- ROE Score: 5, very favorable, showing strong equity profit generation.
- ROA Score: 5, very favorable asset utilization.
- Debt To Equity Score: 1, very unfavorable, high financial risk.
- Overall Score: 3, moderate financial standing.
Tower Semiconductor Ltd. Rating
- Rating: B+, also very favorable overall.
- Discounted Cash Flow Score: 3, indicating moderate value.
- ROE Score: 3, moderate efficiency in equity profit generation.
- ROA Score: 4, favorable asset utilization.
- Debt To Equity Score: 4, favorable, indicating lower financial risk.
- Overall Score: 3, moderate financial standing.
Which one is the best rated?
Based strictly on the data, Tower Semiconductor Ltd. holds a slightly better overall rating (B+) and shows lower financial risk with a higher debt-to-equity score. Broadcom Inc. exhibits stronger profitability metrics but carries higher financial risk.
Scores Comparison
Here is the comparison of the Altman Z-Score and Piotroski Score for Broadcom Inc. and Tower Semiconductor Ltd.:
AVGO Scores
- Altman Z-Score: 12.13, indicating a safe zone for bankruptcy risk.
- Piotroski Score: 8, classified as very strong financial health.
TSEM Scores
- Altman Z-Score: 20.26, also in the safe zone for bankruptcy risk.
- Piotroski Score: 7, indicating strong financial health.
Which company has the best scores?
TSEM shows a higher Altman Z-Score than AVGO, both in the safe zone, while AVGO has a slightly better Piotroski Score. Based strictly on these scores, each company leads in one metric.
Grades Comparison
Here is a detailed comparison of the latest grades assigned to Broadcom Inc. and Tower Semiconductor Ltd.:
Broadcom Inc. Grades
The following table summarizes recent grades assigned by verified grading companies for Broadcom Inc.:
| Grading Company | Action | New Grade | Date |
|---|---|---|---|
| Mizuho | Maintain | Outperform | 2026-01-09 |
| Truist Securities | Maintain | Buy | 2025-12-19 |
| UBS | Maintain | Buy | 2025-12-15 |
| Benchmark | Maintain | Buy | 2025-12-12 |
| Rosenblatt | Maintain | Buy | 2025-12-12 |
| Piper Sandler | Maintain | Overweight | 2025-12-12 |
| TD Cowen | Maintain | Buy | 2025-12-12 |
| B of A Securities | Maintain | Buy | 2025-12-12 |
| JP Morgan | Maintain | Overweight | 2025-12-12 |
| Mizuho | Maintain | Outperform | 2025-12-12 |
Broadcom’s grades show a consistent Buy or better consensus, reflecting strong confidence from multiple reputable firms.
Tower Semiconductor Ltd. Grades
The following table summarizes recent grades assigned by verified grading companies for Tower Semiconductor Ltd.:
| Grading Company | Action | New Grade | Date |
|---|---|---|---|
| Benchmark | Maintain | Buy | 2026-01-09 |
| Wedbush | Downgrade | Neutral | 2025-12-31 |
| Benchmark | Maintain | Buy | 2025-11-11 |
| Susquehanna | Maintain | Positive | 2025-11-11 |
| Wedbush | Maintain | Outperform | 2025-11-11 |
| Barclays | Maintain | Equal Weight | 2025-11-11 |
| Benchmark | Maintain | Buy | 2025-09-08 |
| Susquehanna | Maintain | Positive | 2025-08-05 |
| Benchmark | Maintain | Buy | 2025-08-05 |
| Benchmark | Maintain | Buy | 2025-08-04 |
Tower Semiconductor’s grades are generally positive with several Buy and Outperform ratings, but also include a recent Neutral downgrade indicating some caution.
Which company has the best grades?
Broadcom Inc. holds stronger and more consistent Buy and Outperform grades compared to Tower Semiconductor Ltd., which shows some mixed signals including a downgrade to Neutral. This may suggest a higher level of analyst confidence in Broadcom, potentially impacting investor sentiment.
Strengths and Weaknesses
Below is a comparative overview of key strengths and weaknesses for Broadcom Inc. (AVGO) and Tower Semiconductor Ltd. (TSEM) based on the latest financial and strategic data.
| Criterion | Broadcom Inc. (AVGO) | Tower Semiconductor Ltd. (TSEM) |
|---|---|---|
| Diversification | Strong diversification with significant revenue from both Infrastructure Software ($27B) and Semiconductor Solutions ($36.9B) segments. | Less diversified, focused mainly on semiconductor manufacturing. |
| Profitability | High profitability with a net margin of 36.2% and ROIC of 16.36%, clearly creating value. | Moderate profitability; net margin of 14.47%, ROIC at 6.41%, currently shedding value but improving. |
| Innovation | Demonstrates durable competitive advantage with growing ROIC and strong investment in innovation. | Shows growth in ROIC but remains slightly unfavorable in value creation, indicating innovation challenges. |
| Global presence | Global leader with extensive market reach and infrastructure. | Smaller global footprint with niche market focus. |
| Market Share | Large market share in semiconductor solutions and software infrastructure. | Smaller market share, competing in a specialized segment. |
Key takeaways: Broadcom exhibits strong diversification, profitability, and a durable competitive moat, making it a robust choice for investors. Tower Semiconductor, while showing improving profitability, faces value creation challenges and is less diversified, suggesting higher risk for cautious investors.
Risk Analysis
Below is a comparison table highlighting key risks for Broadcom Inc. (AVGO) and Tower Semiconductor Ltd. (TSEM) based on the most recent data from 2025 and 2024 respectively.
| Metric | Broadcom Inc. (AVGO) | Tower Semiconductor Ltd. (TSEM) |
|---|---|---|
| Market Risk | Moderate (Beta 1.22) | Lower (Beta 0.88) |
| Debt level | Moderate (D/E 0.8) | Low (D/E 0.07) |
| Regulatory Risk | Moderate (US tech sector) | Moderate (Global foundry environment) |
| Operational Risk | Moderate (Complex product mix) | Moderate (Specialized foundry services) |
| Environmental Risk | Moderate (Global manufacturing footprint) | Moderate (Manufacturing and compliance) |
| Geopolitical Risk | Moderate (US and global markets) | Higher (Israel base, geopolitical tensions) |
The most impactful risk for Broadcom is its moderately high debt level coupled with valuation concerns, which could amplify market risk amid tech sector volatility. Tower Semiconductor’s lower leverage and solid financial health mitigate debt risk, but its geopolitical exposure due to its Israel headquarters presents a heightened operational and geopolitical risk. Both companies maintain strong financial safety scores, suggesting manageable bankruptcy risk despite these challenges.
Which Stock to Choose?
Broadcom Inc. (AVGO) shows strong income growth with a 23.87% revenue rise in 2025 and favorable profitability metrics, including a 36.2% net margin and a 28.45% ROE. Its debt level is moderate, with a net debt to EBITDA ratio around 1.41, and it holds a very favorable overall rating of B. The company demonstrates a very favorable moat, evidencing durable competitive advantage and efficient capital use.
Tower Semiconductor Ltd. (TSEM) exhibits more modest income growth, with a 0.94% revenue increase in 2024 and mixed profitability indicators—14.47% net margin but an unfavorable 7.83% ROE. It maintains low debt levels and a very favorable rating of B+. However, its moat evaluation is slightly unfavorable, indicating value destruction despite improving ROIC.
Investors focused on growth might find Broadcom’s strong income expansion, profitability, and durable moat more appealing, while those valuing lower debt and recent positive trends could see Tower Semiconductor as a viable consideration. Each stock’s suitability could vary depending on risk tolerance and investment strategy.
Disclaimer: Investment carries a risk of loss of initial capital. The past performance is not a reliable indicator of future results. Be sure to understand risks before making an investment decision.
Go Further
I encourage you to read the complete analyses of Broadcom Inc. and Tower Semiconductor Ltd. to enhance your investment decisions: