Home > Comparison > Technology > AVGO vs TXN
The strategic rivalry between Broadcom Inc. and Texas Instruments Incorporated shapes the semiconductor industry’s evolution. Broadcom operates as a diversified technology powerhouse with a broad product portfolio spanning infrastructure software and semiconductors. Texas Instruments focuses on analog and embedded processing, emphasizing power management and signal processing solutions. This analysis dissects their distinct operational models to reveal which company offers superior risk-adjusted returns for a well-balanced, diversified portfolio.
Table of contents
Companies Overview
Broadcom Inc. and Texas Instruments Incorporated stand as pillars in the semiconductor industry, shaping technology’s future.
Broadcom Inc.: Integrated Semiconductor and Infrastructure Leader
Broadcom Inc. dominates the semiconductor and infrastructure software market with a diverse product portfolio spanning wired infrastructure, wireless communications, and enterprise storage. Its revenue engine relies on supplying complex semiconductor devices and firmware for data centers, telecommunications, and industrial applications. In 2026, Broadcom sharpens its focus on expanding integrated systems and software solutions to capture greater market share in connectivity and data infrastructure.
Texas Instruments Incorporated: Analog and Embedded Processing Pioneer
Texas Instruments leads in analog and embedded processing semiconductors, powering a broad range of electronics worldwide. Its core revenue stems from analog power management products and microcontrollers for industrial, automotive, and personal electronics markets. In 2026, TI emphasizes enhancing its analog and embedded solutions to deepen penetration in automotive and industrial sectors, balancing innovation with stable direct sales and distributor channels.
Strategic Collision: Similarities & Divergences
Both firms command critical semiconductor niches but differ strategically. Broadcom pursues a complex, integrated ecosystem blending hardware and software, while Texas Instruments focuses on specialized analog and embedded chips with broad end-market applications. Their primary battleground lies in industrial and communications infrastructure, where connectivity and control converge. Investment profiles diverge: Broadcom offers scale and integration strength, whereas Texas Instruments delivers focused analog innovation with steady market demand.
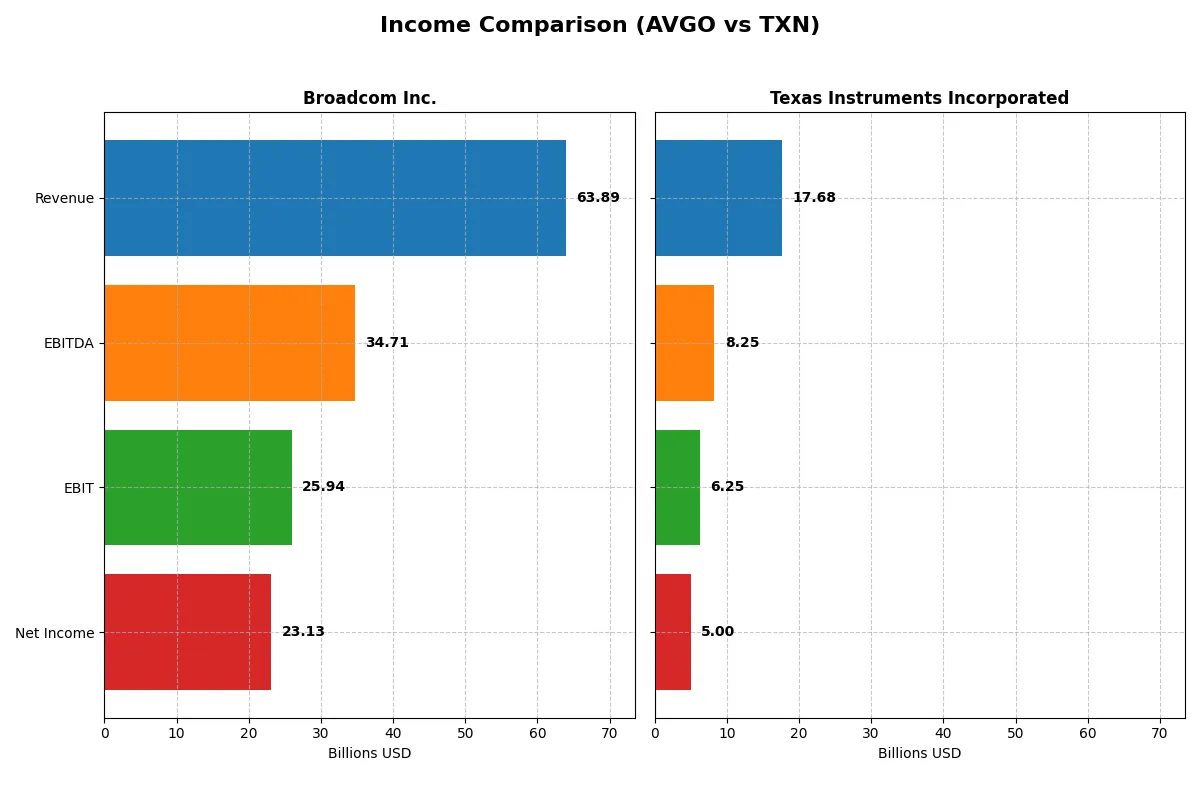
Income Statement Comparison
This data dissects the core profitability and scalability of both corporate engines to reveal who dominates the bottom line:
| Metric | Broadcom Inc. (AVGO) | Texas Instruments (TXN) |
|---|---|---|
| Revenue | 63.9B | 17.7B |
| Cost of Revenue | 20.6B | 7.6B |
| Operating Expenses | 17.8B | 4.1B |
| Gross Profit | 43.3B | 10.1B |
| EBITDA | 34.7B | 8.3B |
| EBIT | 25.9B | 6.3B |
| Interest Expense | 3.2B | 0.5B |
| Net Income | 23.1B | 5.0B |
| EPS | 4.91 | 5.45 |
| Fiscal Year | 2025 | 2025 |
Income Statement Analysis: The Bottom-Line Duel
This income statement comparison will uncover which company operates more efficiently and generates stronger profitability in recent years.
Broadcom Inc. Analysis
Broadcom’s revenue surged from 27.5B in 2021 to 63.9B in 2025, while net income more than tripled to 23.1B. Its gross margin stands at a robust 67.8%, and net margin hit 36.2% in 2025, signaling strong cost control. The company’s 2025 earnings growth momentum is exceptional, with an 87% EBIT increase and a nearly 288% EPS jump year-over-year.
Texas Instruments Incorporated Analysis
Texas Instruments grew revenue modestly to 17.7B in 2025 from 18.3B in 2021, but net income declined to 5.0B. It maintains a healthy gross margin of 57.0% and a net margin of 28.3% in 2025, though margins contracted over the period. EBIT growth slowed to 4.9% in 2025, while net margin shrank by nearly 8%, reflecting margin pressure despite revenue gains.
Margin Dominance vs. Steady Scale
Broadcom clearly outpaces Texas Instruments in both revenue and net income growth, displaying superior margin expansion and operational leverage. Its aggressive earnings momentum contrasts with Texas Instruments’ more stable but declining profitability. For investors prioritizing dynamic profit growth and margin strength, Broadcom’s profile commands greater attention.
Financial Ratios Comparison
These vital ratios act as a diagnostic tool to expose the underlying fiscal health, valuation premiums, and capital efficiency of the companies compared below:
| Ratios | Broadcom Inc. (AVGO) | Texas Instruments (TXN) |
|---|---|---|
| ROE | 28.4% | 30.7% |
| ROIC | 16.4% | 16.5% |
| P/E | 73.9x | 31.5x |
| P/B | 21.0x | 9.7x |
| Current Ratio | 1.71 | 4.35 |
| Quick Ratio | 1.58 | 2.83 |
| D/E | 0.80 | 0.86 |
| Debt-to-Assets | 38.1% | 40.6% |
| Interest Coverage | 7.94x | 11.1x |
| Asset Turnover | 0.37 | 0.51 |
| Fixed Asset Turnover | 25.3x | 1.44x |
| Payout Ratio | 48.2% | 100.0% |
| Dividend Yield | 0.65% | 3.17% |
| Fiscal Year | 2025 | 2025 |
Efficiency & Valuation Duel: The Vital Signs
Ratios serve as a company’s financial DNA, unveiling hidden risks and operational strengths crucial for informed investment decisions.
Broadcom Inc.
Broadcom delivers strong profitability with a 28.45% ROE and a robust 36.2% net margin, reflecting operational excellence. However, its valuation appears stretched, with a P/E of 73.87 and a P/B of 21.01. The company returns modest dividends (0.65% yield) while aggressively reinvesting in R&D, signaling a growth-focused capital allocation.
Texas Instruments Incorporated
Texas Instruments exhibits slightly higher profitability, posting a 30.73% ROE and a solid 28.28% net margin. Its valuation, with a P/E of 31.53 and P/B of 9.69, remains elevated but more reasonable than Broadcom’s. TI offers a healthy 3.17% dividend yield, balancing shareholder returns with stable operational efficiency and prudent capital management.
Premium Valuation vs. Balanced Shareholder Return
Broadcom shows superior margin efficiency but trades at a steep premium, increasing valuation risk. Texas Instruments provides a better balance of profitability and valuation, coupled with a stronger dividend yield. Investors seeking growth may prefer Broadcom’s reinvestment strategy, while income-focused investors might favor Texas Instruments’ steady payouts.
Which one offers the Superior Shareholder Reward?
Broadcom (AVGO) and Texas Instruments (TXN) both reward shareholders with dividends and buybacks, but their strategies differ markedly. AVGO yields a modest 0.65% with a payout ratio near 48%, supported by strong free cash flow (5.7B per share) and a robust buyback program enhancing total returns. TXN offers a higher dividend yield of roughly 3.2%, with a payout ratio close to 100%, reflecting a commitment to returning nearly all earnings to shareholders. However, TXN’s buyback intensity is lower, and its free cash flow coverage for dividends is weaker. I see Broadcom’s balanced approach—solid dividend, aggressive buybacks, and sustainable payout—delivering superior long-term shareholder reward in 2026.
Comparative Score Analysis: The Strategic Profile
The radar chart reveals the core financial DNA and trade-offs of Broadcom Inc. and Texas Instruments Incorporated, highlighting their strategic strengths and weaknesses:
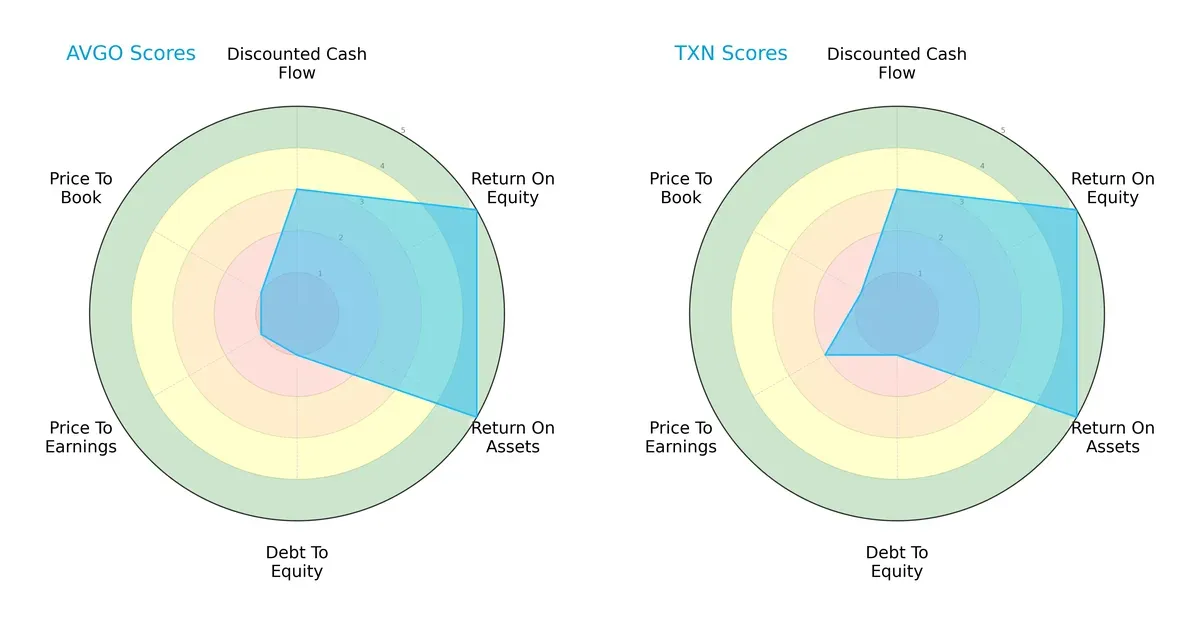
Both firms deliver very favorable returns on equity and assets, signaling efficient capital use. However, both show weak debt-to-equity and valuation metrics, reflecting high leverage and stretched pricing. Texas Instruments edges out slightly on price-to-earnings, indicating a less expensive valuation. Broadcom’s profile is less balanced, relying on operational strength amid financial risk, while Texas Instruments maintains a marginally more balanced valuation stance.
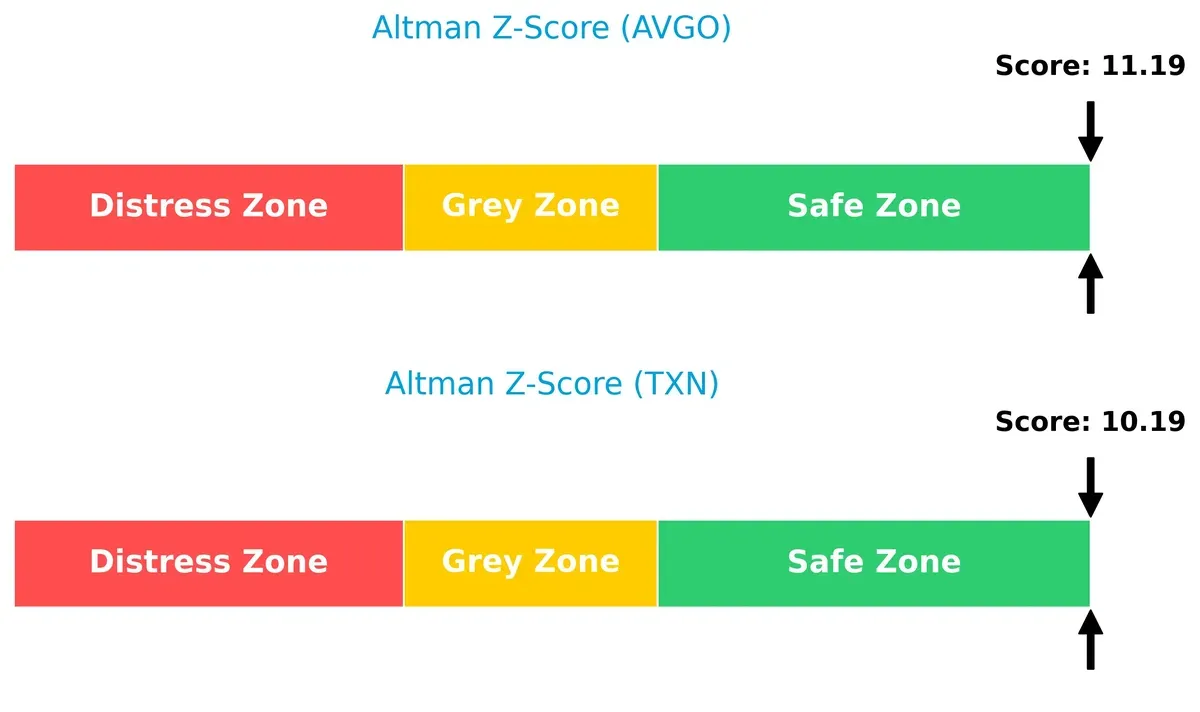
Bankruptcy Risk: Solvency Showdown
Broadcom’s Altman Z-Score of 11.19 surpasses Texas Instruments’ 10.19, both firmly in the safe zone. This suggests both companies demonstrate robust solvency and a very low bankruptcy risk in the current cycle:
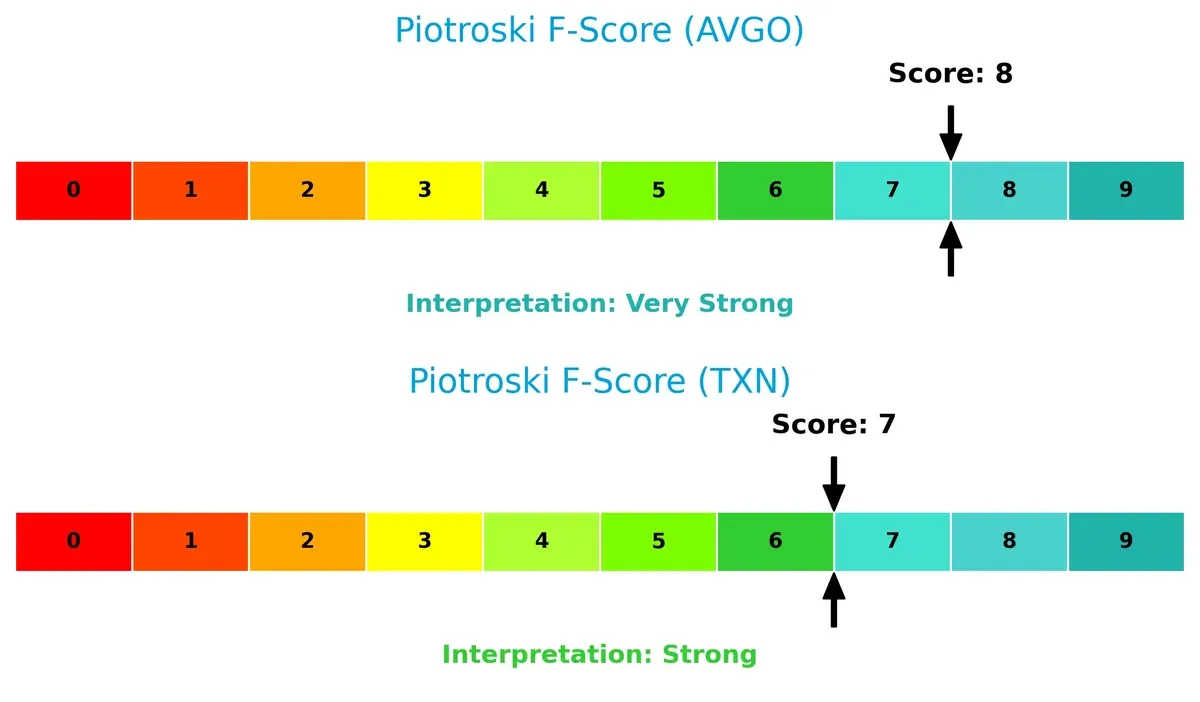
Financial Health: Quality of Operations
Broadcom scores an 8 on the Piotroski F-Score, indicating very strong financial health. Texas Instruments follows closely with a strong 7. Both firms exhibit solid operational quality, but Broadcom shows a slight edge in internal financial metrics:
How are the two companies positioned?
This section dissects AVGO and TXN’s operational DNA by comparing revenue distribution and analyzing their strengths and weaknesses. The goal is to confront their economic moats and reveal which model delivers the most resilient competitive advantage today.
Revenue Segmentation: The Strategic Mix
This visual comparison dissects how Broadcom Inc. and Texas Instruments diversify their income streams and where their primary sector bets lie:
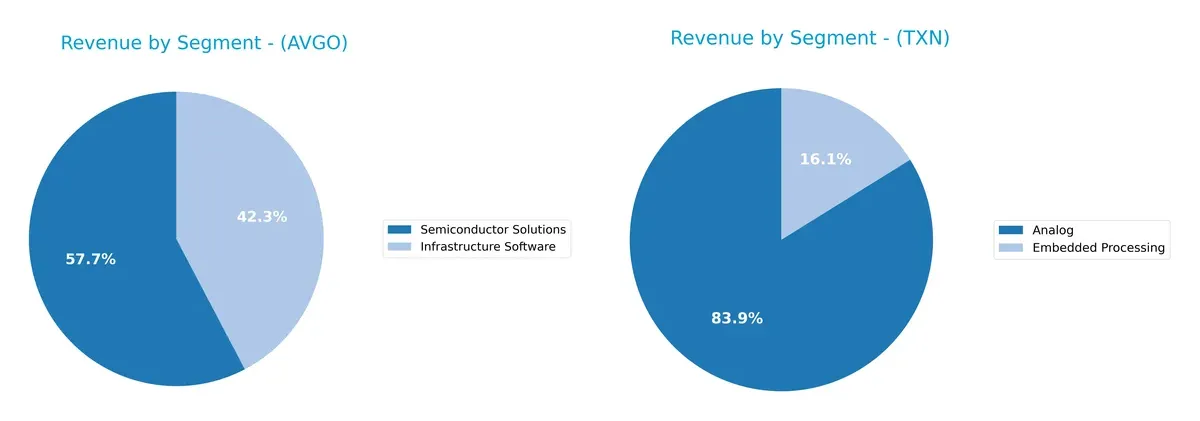
Broadcom pins its revenue on two main segments: Semiconductor Solutions dwarfs Infrastructure Software at $36.9B vs. $27B in 2025. Texas Instruments shows a more balanced mix, with Analog at $14B and Embedded Processing at $2.7B. Broadcom’s concentration in semiconductors signals infrastructure dominance but also heightens concentration risk. Texas Instruments’ spread across Analog and Embedded Processing underpins steadier diversification and ecosystem resilience.
Strengths and Weaknesses Comparison
This table compares the strengths and weaknesses of Broadcom Inc. and Texas Instruments Incorporated:
Broadcom Inc. Strengths
- Strong net margin at 36.2%
- ROE at 28.45% indicates solid profitability
- Favorable quick and current ratios show liquidity
- High fixed asset turnover at 25.25
- Growing revenue in Infrastructure Software and Semiconductor Solutions
- Significant global sales in Asia Pacific and Americas
Texas Instruments Incorporated Strengths
- Strong ROE at 30.73% and ROIC at 16.52%
- Favorable quick ratio and interest coverage
- Diversified revenue with Analog and Embedded Processing segments
- Consistent dividend yield of 3.17%
- Balanced geographic exposure including United States, China, and EMEA
Broadcom Inc. Weaknesses
- High P/E and P/B ratios indicate possible overvaluation
- Asset turnover at 0.37 is low, suggesting less efficient asset use
- Low dividend yield at 0.65%
- Moderate debt levels with neutral debt-to-assets ratio
Texas Instruments Incorporated Weaknesses
- Current ratio at 4.35 flagged as unfavorable, may indicate excess inventory or receivables
- P/E and P/B ratios are unfavorable
- Fixed asset turnover is neutral at 1.44
- Higher debt-to-assets ratio relative to AVGO, still neutral
Broadcom excels in profitability and asset efficiency but faces valuation concerns and lower dividend yield. Texas Instruments shows robust returns, diversified revenue, and stronger dividends but has potential liquidity inefficiencies and valuation weaknesses. Both companies maintain slightly favorable overall financial profiles.
The Moat Duel: Analyzing Competitive Defensibility
A structural moat is the only reliable shield protecting long-term profits from relentless competitive erosion in dynamic markets:
Broadcom Inc.: Integrated Infrastructure Moat
Broadcom’s moat stems from its complex product integration and diversified semiconductor portfolio. It shows high ROIC above WACC and margin stability. Expansion into wireless and enterprise storage deepens this moat in 2026.
Texas Instruments Incorporated: Analog Leadership Moat
Texas Instruments relies on its analog semiconductor dominance, contrasting Broadcom’s broader tech platform. It maintains ROIC above WACC but faces a declining profitability trend. New embedded processing markets offer growth but increase competitive pressure.
Integrated Complexity vs. Analog Focus: The Moat Face-off
Broadcom’s wider, growing moat outpaces Texas Instruments’ narrowing competitive edge. I see Broadcom better positioned to defend and expand market share amid evolving tech demands.
Which stock offers better returns?
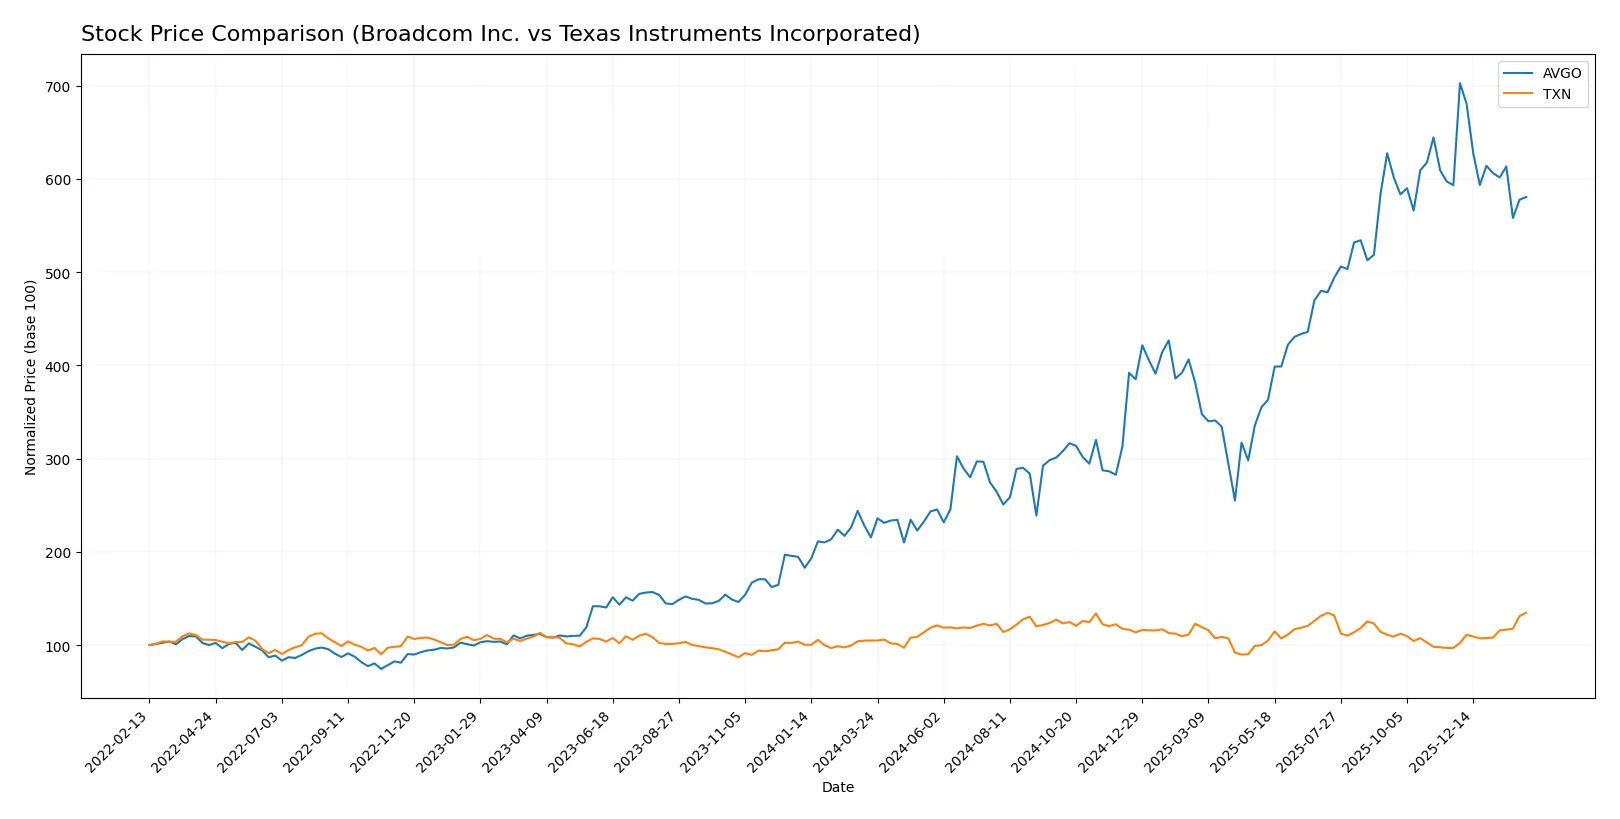
Over the past 12 months, Broadcom Inc. showed a strong overall price increase with a recent mild decline, while Texas Instruments posted steady gains and accelerating momentum.
Trend Comparison
Broadcom Inc. (AVGO) gained 169.46% over the past year, marking a bullish trend with decelerating price growth. Its recent 2.14% drop signals a slight bearish shift.
Texas Instruments (TXN) rose 28.36% overall, maintaining a bullish trend with accelerating gains. Its recent 38.92% surge reflects strong upward momentum.
TXN’s trend shows accelerating strength and recent buyer dominance, while AVGO leads in long-term returns but faces recent weakness. TXN delivered the highest recent market performance.
Target Prices
Analysts present a cautiously optimistic consensus on Broadcom Inc. and Texas Instruments Incorporated.
| Company | Target Low | Target High | Consensus |
|---|---|---|---|
| Broadcom Inc. | 370 | 510 | 450.12 |
| Texas Instruments Inc. | 160 | 260 | 204.64 |
The consensus target prices for Broadcom and Texas Instruments exceed current market prices by roughly 35% and 7.5%, respectively, suggesting room for appreciation with moderate risk.

Don’t Let Luck Decide Your Entry Point
Optimize your entry points with our advanced ProRealTime indicators. You’ll get efficient buy signals with precise price targets for maximum performance. Start outperforming now!
How do institutions grade them?
Here is a summary of the recent grades assigned by major financial institutions for both companies:
Broadcom Inc. Grades
The following table lists Broadcom’s latest stock grades from reputable firms:
| Grading Company | Action | New Grade | Date |
|---|---|---|---|
| Wells Fargo | Upgrade | Overweight | 2026-01-15 |
| Mizuho | Maintain | Outperform | 2026-01-09 |
| Truist Securities | Maintain | Buy | 2025-12-19 |
| UBS | Maintain | Buy | 2025-12-15 |
| Rosenblatt | Maintain | Buy | 2025-12-12 |
| Morgan Stanley | Maintain | Overweight | 2025-12-12 |
| Barclays | Maintain | Overweight | 2025-12-12 |
| Bernstein | Maintain | Outperform | 2025-12-12 |
| Citigroup | Maintain | Buy | 2025-12-12 |
| Mizuho | Maintain | Outperform | 2025-12-12 |
Texas Instruments Incorporated Grades
The following table lists Texas Instruments’ latest stock grades from reputable firms:
| Grading Company | Action | New Grade | Date |
|---|---|---|---|
| Rosenblatt | Maintain | Buy | 2026-02-05 |
| JP Morgan | Maintain | Overweight | 2026-01-28 |
| Cantor Fitzgerald | Maintain | Neutral | 2026-01-28 |
| Wells Fargo | Maintain | Equal Weight | 2026-01-28 |
| Truist Securities | Maintain | Hold | 2026-01-28 |
| Stifel | Maintain | Hold | 2026-01-28 |
| UBS | Maintain | Buy | 2026-01-28 |
| Mizuho | Maintain | Underperform | 2026-01-28 |
| Jefferies | Maintain | Hold | 2026-01-28 |
| Benchmark | Maintain | Buy | 2026-01-28 |
Which company has the best grades?
Broadcom Inc. consistently receives higher grades such as “Buy,” “Outperform,” and “Overweight.” Texas Instruments shows more mixed ratings, including “Hold” and “Underperform.” These disparities may influence investor confidence and portfolio positioning.
Risks specific to each company
The following categories identify the critical pressure points and systemic threats facing both firms in the 2026 market environment:
1. Market & Competition
Broadcom Inc.
- Operates in diverse segments but faces high P/E and P/B ratios indicating market premium risk.
Texas Instruments Incorporated
- Faces moderate valuation risk with lower P/E and P/B but intense analog and embedded processing competition.
2. Capital Structure & Debt
Broadcom Inc.
- Debt-to-equity ratio moderate at 0.8; interest coverage favorable at 8.08x, but debt levels warrant caution.
Texas Instruments Incorporated
- Slightly higher debt-to-equity at 0.86; interest coverage stronger at 11.52x, showing better debt servicing.
3. Stock Volatility
Broadcom Inc.
- Beta at 1.22 signals higher volatility than market average, increasing investment risk.
Texas Instruments Incorporated
- Beta near 1.0 indicates stock volatility closely tracks market, implying more stability.
4. Regulatory & Legal
Broadcom Inc.
- Global semiconductor supply chains expose it to complex trade regulations and antitrust scrutiny.
Texas Instruments Incorporated
- Also subject to semiconductor industry regulation but with less diversified product exposure, reducing complexity.
5. Supply Chain & Operations
Broadcom Inc.
- Complex supply chain across multiple segments increases operational risk amid geopolitical tensions.
Texas Instruments Incorporated
- More focused production in analog and embedded chips simplifies supply chain but still vulnerable to global disruptions.
6. ESG & Climate Transition
Broadcom Inc.
- Faces pressure to reduce carbon footprint in data centers and manufacturing hardware segments.
Texas Instruments Incorporated
- Has initiatives in power management products aiding climate transition, but overall ESG risks remain material.
7. Geopolitical Exposure
Broadcom Inc.
- Significant exposure to US-China tensions due to global tech footprint and supply chain dependencies.
Texas Instruments Incorporated
- Also exposed but with a more conservative global presence, potentially mitigating some geopolitical risks.
Which company shows a better risk-adjusted profile?
Broadcom’s greatest risk lies in its high market valuation and complex supply chain in a volatile geopolitical environment. Texas Instruments faces capital structure risks but benefits from superior interest coverage and lower stock volatility. Texas Instruments shows a better risk-adjusted profile, supported by its safer debt servicing capacity and steadier stock behavior in 2026 market conditions.
Final Verdict: Which stock to choose?
Broadcom Inc. stands out as a cash-generating powerhouse with a robust and expanding economic moat. Its ability to sustain above-average returns on invested capital signals strong management and competitive positioning. A point of vigilance remains its elevated valuation multiples, which may pressure future returns. Broadcom suits aggressive growth portfolios seeking high reward potential.
Texas Instruments offers a strategic moat grounded in steady cash flow and consistent profitability. Its conservative balance sheet and superior dividend yield provide a safety cushion, especially versus Broadcom’s higher financial leverage. However, its declining ROIC trend warrants attention. Texas Instruments fits well in GARP portfolios that balance growth with reasonable risk.
If you prioritize dynamic growth backed by a widening moat, Broadcom is the compelling choice due to its accelerating profitability and efficient capital use. However, if you seek better stability with dependable income, Texas Instruments offers superior financial safety and dividend appeal despite slower growth. Both present solid cases but cater to distinct investor profiles.
Disclaimer: Investment carries a risk of loss of initial capital. The past performance is not a reliable indicator of future results. Be sure to understand risks before making an investment decision.
Go Further
I encourage you to read the complete analyses of Broadcom Inc. and Texas Instruments Incorporated to enhance your investment decisions: