Home > Comparison > Technology > AVGO vs TER
The strategic rivalry between Broadcom Inc. and Teradyne, Inc. shapes the semiconductor sector’s evolution. Broadcom operates as a diversified technology powerhouse with broad semiconductor and infrastructure software solutions. Teradyne, by contrast, focuses on specialized automatic test equipment and industrial automation. This head-to-head pits Broadcom’s scale and integration against Teradyne’s innovation niche. This analysis will determine which company offers a superior risk-adjusted return for a diversified portfolio.

Table of contents
Companies Overview
Broadcom and Teradyne stand as influential competitors in the semiconductor industry, shaping critical tech infrastructure.
Broadcom Inc.: Semiconductor Powerhouse
Broadcom dominates as a global technology company specializing in semiconductor and infrastructure software solutions. It generates revenue through diversified segments, including wired and wireless infrastructure, enterprise storage, and industrial applications. In 2026, Broadcom sharpens its strategic focus on expanding integrated solutions across data centers and telecommunications, leveraging its broad product portfolio to sustain a robust market position.
Teradyne, Inc.: Testing and Automation Leader
Teradyne excels as a designer and manufacturer of automatic test equipment critical for semiconductor and wireless device production. Its core revenue stems from semiconductor test systems, industrial automation, and wireless test solutions. In 2026, Teradyne intensifies its pursuit of innovation in robotics and advanced testing platforms to meet rising industry demand for precision and automation in manufacturing processes.
Strategic Collision: Similarities & Divergences
Both companies operate in semiconductor-related fields but differ sharply in approach. Broadcom focuses on delivering comprehensive semiconductor components and software, while Teradyne emphasizes test equipment and automation for device manufacturing. Their primary battleground is the evolving semiconductor supply chain, where Broadcom supplies components and Teradyne ensures quality through testing. This divergence creates distinct investment profiles—Broadcom as a broad-based semiconductor supplier, Teradyne as a specialized equipment innovator.
Income Statement Comparison
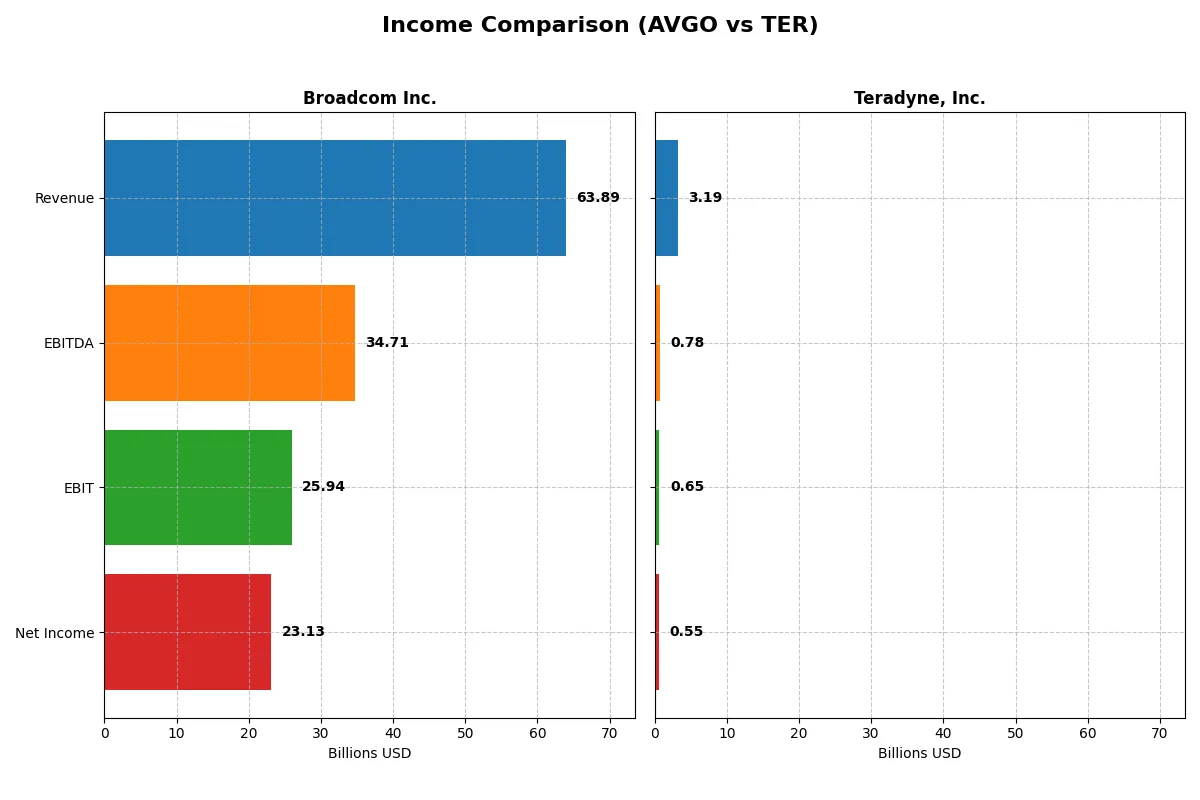
The following data dissects the core profitability and scalability of both corporate engines to reveal who dominates the bottom line:
| Metric | Broadcom Inc. (AVGO) | Teradyne, Inc. (TER) |
|---|---|---|
| Revenue | 63.9B | 3.19B |
| Cost of Revenue | 20.6B | 1.32B |
| Operating Expenses | 17.8B | 1.17B |
| Gross Profit | 43.3B | 1.87B |
| EBITDA | 34.7B | 780M |
| EBIT | 25.9B | 653M |
| Interest Expense | 3.21B | 8.02M |
| Net Income | 23.1B | 554M |
| EPS | 4.91 | 3.49 |
| Fiscal Year | 2025 | 2025 |
Income Statement Analysis: The Bottom-Line Duel
This income statement comparison reveals which company runs its operations with superior efficiency and sustainable profitability.
Broadcom Inc. Analysis
Broadcom’s revenue surged from 27.5B in 2021 to 63.9B in 2025, doubling its top line. Net income exploded from 6.4B to 23.1B, reflecting strong margin expansion. Its gross margin stands at a robust 67.8%, and net margin at 36.2%, both favorable. In 2025, Broadcom accelerated earnings growth, showcasing operational leverage and superior capital allocation.
Teradyne, Inc. Analysis
Teradyne’s revenue declined from 3.7B in 2021 to 3.2B in 2025, a weakening top-line trend. Net income fell from 1.0B to 554M, illustrating margin pressures despite stable gross margin near 58.6%. Its net margin dropped to 17.4%, signaling margin compression. Although Teradyne maintains positive EBIT growth, its overall profitability momentum lags behind industry leaders.
Margin Power vs. Revenue Scale
Broadcom dominates with rapid revenue and profit growth, boasting superior margins and impressive bottom-line expansion. Teradyne, while maintaining operational efficiency, faces declining revenue and shrinking net margins. For investors prioritizing growth and profitability resilience, Broadcom’s profile offers a more compelling fundamental foundation.
Financial Ratios Comparison
These vital ratios act as a diagnostic tool to expose the underlying fiscal health, valuation premiums, and capital efficiency of each company:
| Ratios | Broadcom Inc. (AVGO) | Teradyne, Inc. (TER) |
|---|---|---|
| ROE | 28.4% | 19.8% |
| ROIC | 16.4% | 18.4% |
| P/E | 73.9 | 54.6 |
| P/B | 21.0 | 10.8 |
| Current Ratio | 1.71 | 1.76 |
| Quick Ratio | 1.58 | 1.41 |
| D/E | 0.80 | 0.12 |
| Debt-to-Assets | 38.1% | 8.3% |
| Interest Coverage | 7.94 | 86.4 |
| Asset Turnover | 0.37 | 0.76 |
| Fixed Asset Turnover | 25.3 | 5.0 |
| Payout ratio | 48.2% | 13.8% |
| Dividend yield | 0.65% | 0.25% |
| Fiscal Year | 2025 | 2025 |
Efficiency & Valuation Duel: The Vital Signs
Ratios act as a company’s DNA, revealing hidden risks and signaling operational excellence crucial for investment insight.
Broadcom Inc.
Broadcom exhibits robust profitability with a 28.45% ROE and a strong 36.2% net margin, indicating operational efficiency. Its valuation is stretched, with a P/E of 73.87 and P/B of 21.01, suggesting premium pricing. Dividend yield is modest at 0.65%, reflecting a limited direct shareholder payout amid reinvestment in R&D (17.2% of revenue).
Teradyne, Inc.
Teradyne delivers solid profitability, boasting a 19.82% ROE and a 17.37% net margin, signaling effective capital use. Valuation remains elevated with a P/E of 54.64 and P/B of 10.83, reflecting growth expectations. The dividend yield is low at 0.25%, consistent with reinvestment focused on growth and innovation (15.8% of revenue).
Premium Valuation vs. Operational Safety
Broadcom commands a higher premium valuation, driven by superior margins and returns but at a stretched price. Teradyne shows a more balanced profile with solid profitability and stronger balance sheet metrics. Investors seeking growth with operational safety may lean toward Teradyne’s steadier risk-reward balance.
Which one offers the Superior Shareholder Reward?
I observe Broadcom Inc. (AVGO) combines a solid 2.36 dividend per share with a 48% payout ratio, supported by nearly full free cash flow coverage. Its aggressive buybacks amplify shareholder return, sustaining value in 2026. Teradyne, Inc. (TER) yields a modest 0.49 dividend with only 14% payout, favoring reinvestment into growth and R&D. TER’s buyback program is less intense but debt-light, enhancing balance sheet resilience. I find Broadcom’s balanced, higher-yield distribution and robust buybacks deliver a more attractive total return profile for long-term investors this year.
Comparative Score Analysis: The Strategic Profile
The radar chart reveals the fundamental DNA and trade-offs of Broadcom Inc. and Teradyne, Inc., highlighting their distinct financial strengths and valuation approaches:
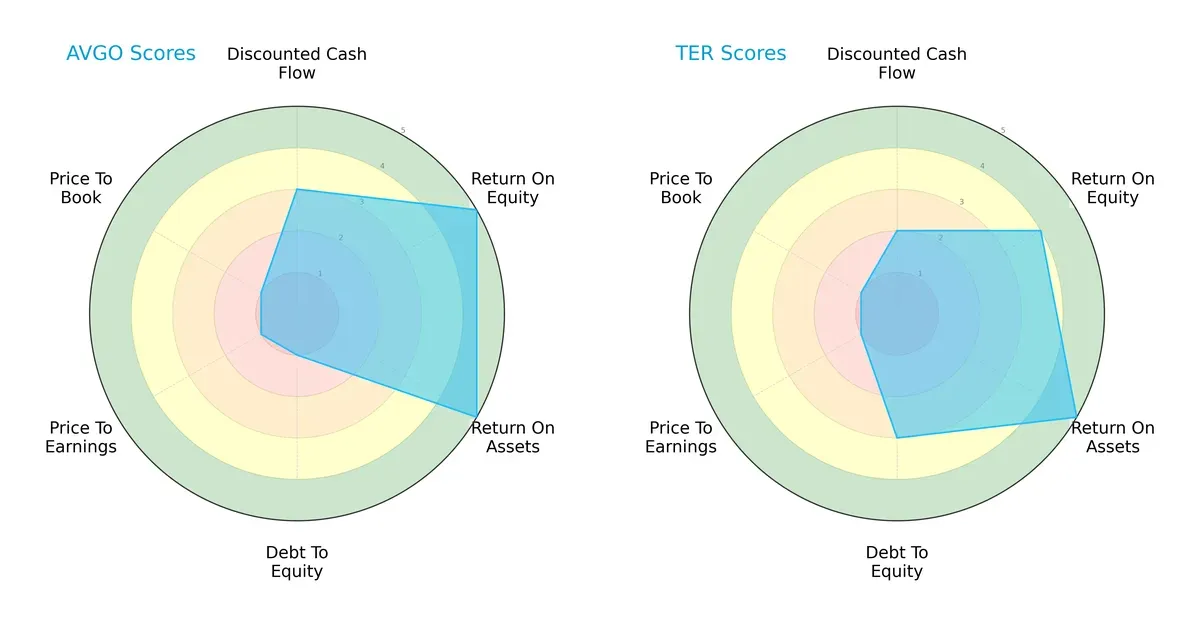
Broadcom excels in profitability with top ROE and ROA scores (5 each), but suffers from high leverage and expensive valuation (debt-to-equity, P/E, and P/B scores all at 1). Teradyne shows a more balanced financial risk profile with moderate debt-to-equity (3) and solid operational efficiency (ROA 5, ROE 4). Teradyne’s lower DCF score (2) signals weaker future cash flow projections compared to Broadcom’s moderate 3. Broadcom relies heavily on operational excellence but risks financial strain, while Teradyne balances growth with prudent leverage.
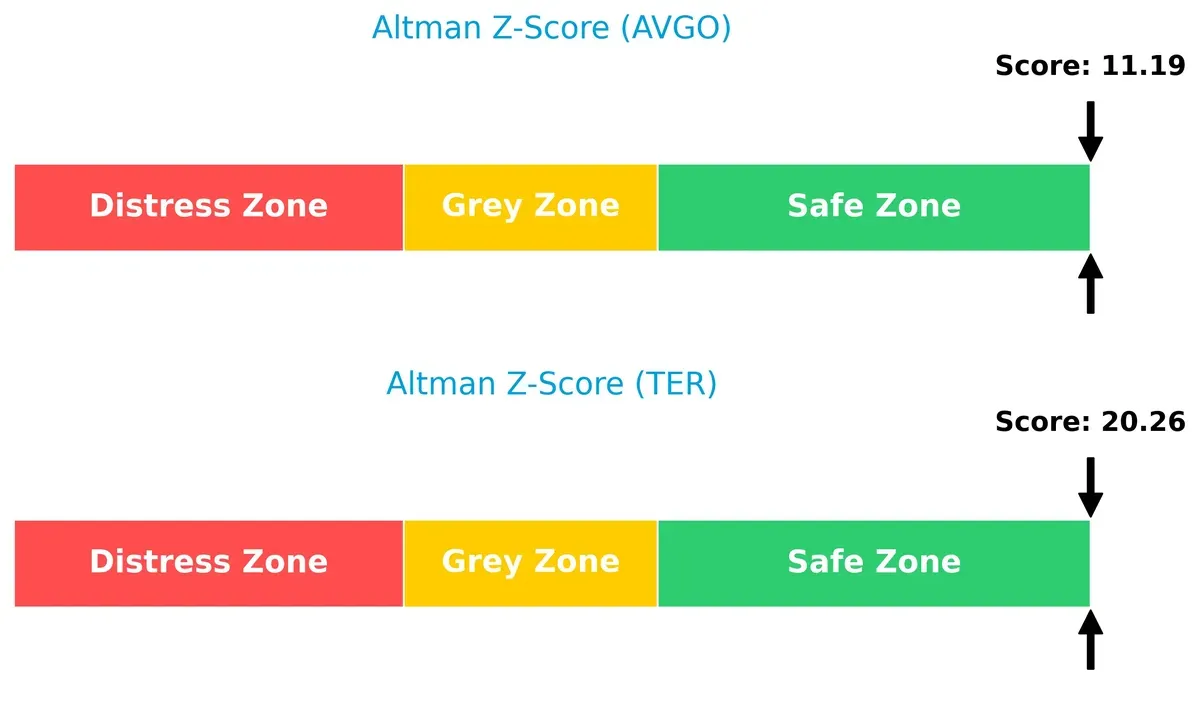
Bankruptcy Risk: Solvency Showdown
Broadcom’s Altman Z-Score of 11.19 versus Teradyne’s 20.26 places both comfortably in the safe zone, but Teradyne’s higher score signals stronger long-term solvency and lower bankruptcy risk in this cycle:
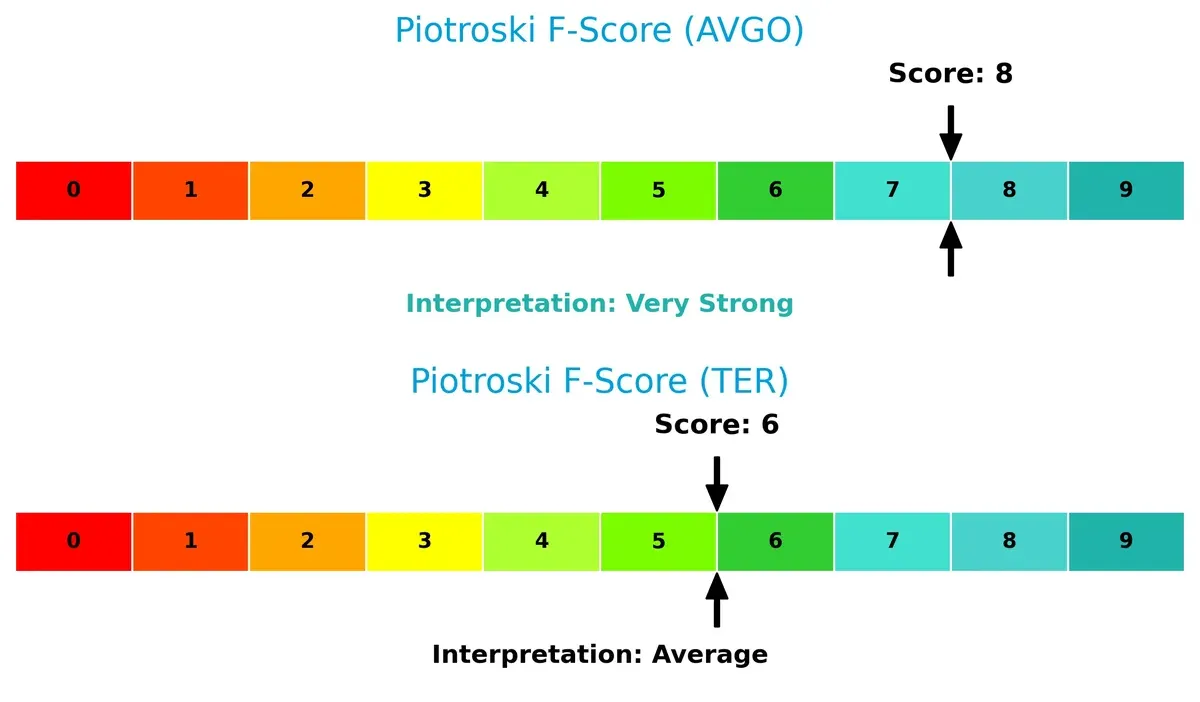
Financial Health: Quality of Operations
Broadcom’s Piotroski F-Score of 8 indicates very strong financial health, outperforming Teradyne’s average score of 6, suggesting Broadcom maintains superior profitability, liquidity, and operational efficiency metrics:
How are the two companies positioned?
This section dissects the operational DNA of Broadcom and Teradyne by comparing their revenue distribution and internal strengths and weaknesses. The final objective is to confront their economic moats to identify which business model offers the most resilient and sustainable competitive advantage today.
Revenue Segmentation: The Strategic Mix
The following visual comparison dissects how Broadcom Inc. and Teradyne, Inc. diversify their income streams and where their primary sector bets lie:
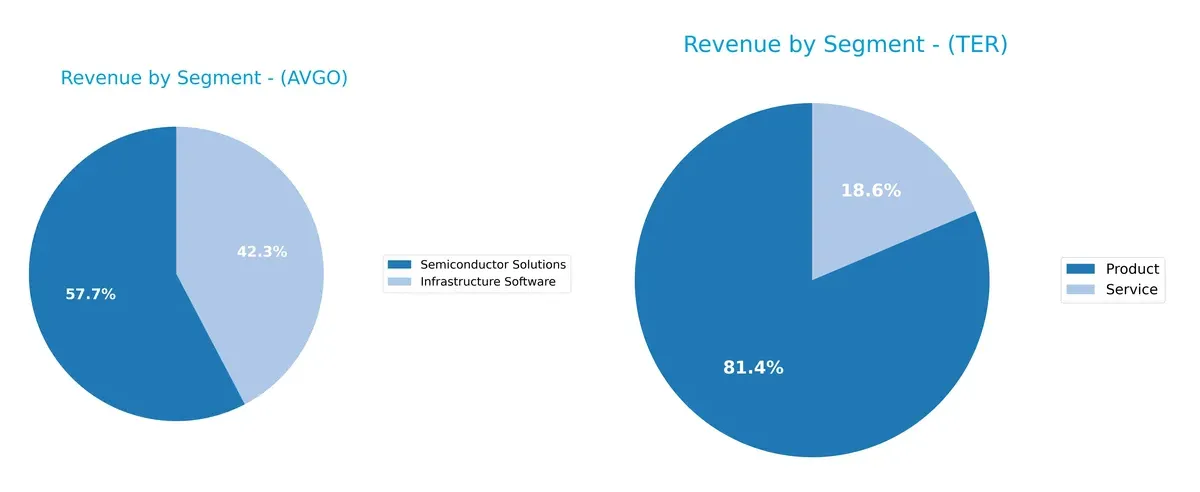
Broadcom anchors its revenue in two dominant segments: Semiconductor Solutions at $36.9B and Infrastructure Software at $27B in 2025. This near-duopoly diversifies risk while leveraging ecosystem lock-in. Teradyne, by contrast, pivots heavily on Product sales, $2.3B in 2024, with Services at $525M as a secondary stream. Teradyne’s narrower segmentation signals concentration risk but reflects focus on automation infrastructure and test equipment specialization.
Strengths and Weaknesses Comparison
This table compares the Strengths and Weaknesses of Broadcom Inc. and Teradyne, Inc.:
Broadcom Inc. Strengths
- High net margin at 36.2%
- Strong ROE of 28.45%
- Robust ROIC of 16.36%
- Solid current and quick ratios above 1.5
- Large diversified revenue from Infrastructure Software and Semiconductor Solutions
- Significant global sales, especially Asia Pacific at $35.9B
Teradyne, Inc. Strengths
- Favorable ROIC at 18.45%
- Strong interest coverage at 81.43
- Low debt-to-assets ratio at 8.32%
- Balanced revenue from Products and Services
- Favorable current and quick ratios above 1.4
- Global presence across multiple Asian and US markets with steady revenue streams
Broadcom Inc. Weaknesses
- Unfavorable high PE of 73.87 and PB of 21.01
- Asset turnover low at 0.37
- Dividend yield low at 0.65%
- Debt-to-equity at 0.8 considered neutral
- WACC neutral at 9.32%
- Heavy reliance on semiconductor sector
Teradyne, Inc. Weaknesses
- Unfavorable WACC at 12.29%
- PE at 54.64 and PB at 10.83 remain high
- Lower net margin at 17.37% compared to peers
- Dividend yield low at 0.25%
- Asset turnover neutral at 0.76
- Less diversification outside product and service lines
Both companies display strong profitability and liquidity metrics. Broadcom’s scale and diversification underpin its strengths, while Teradyne’s low leverage and high interest coverage offer financial stability. Both face valuation concerns and specific operational constraints, influencing their strategic priorities.
The Moat Duel: Analyzing Competitive Defensibility
A structural moat is the only true shield protecting long-term profits from relentless competitive erosion. Let’s dissect the moats behind these two semiconductor giants:
Broadcom Inc.: Intangible Assets and Scale Powerhouse
Broadcom’s moat hinges on its expansive portfolio of proprietary technology and firmware. This manifests in a robust 40.6% EBIT margin and a soaring ROIC that outpaces WACC by 7%, signaling strong value creation. Its aggressive expansion into new wireless and data center markets in 2026 should deepen this moat further.
Teradyne, Inc.: Specialized Automation and Testing Expertise
Teradyne’s competitive edge lies in its niche test equipment and industrial automation platforms. Unlike Broadcom’s scale, Teradyne relies on technical specialization, delivering a solid but lower 20.5% EBIT margin. However, its declining ROIC trend poses risks, though new automation robotics offer growth potential in 2026.
Moat Strength: Proprietary Technology vs. Specialized Niche
Broadcom commands a wider and more durable moat with high profitability and a growing ROIC, reflecting effective capital allocation and scale benefits. Teradyne creates value but faces margin pressure and declining profitability. Broadcom is better positioned to defend and expand its market share over the long term.
Which stock offers better returns?
The past year saw Broadcom Inc. and Teradyne, Inc. deliver strong gains with contrasting recent momentum and trading volume dynamics.
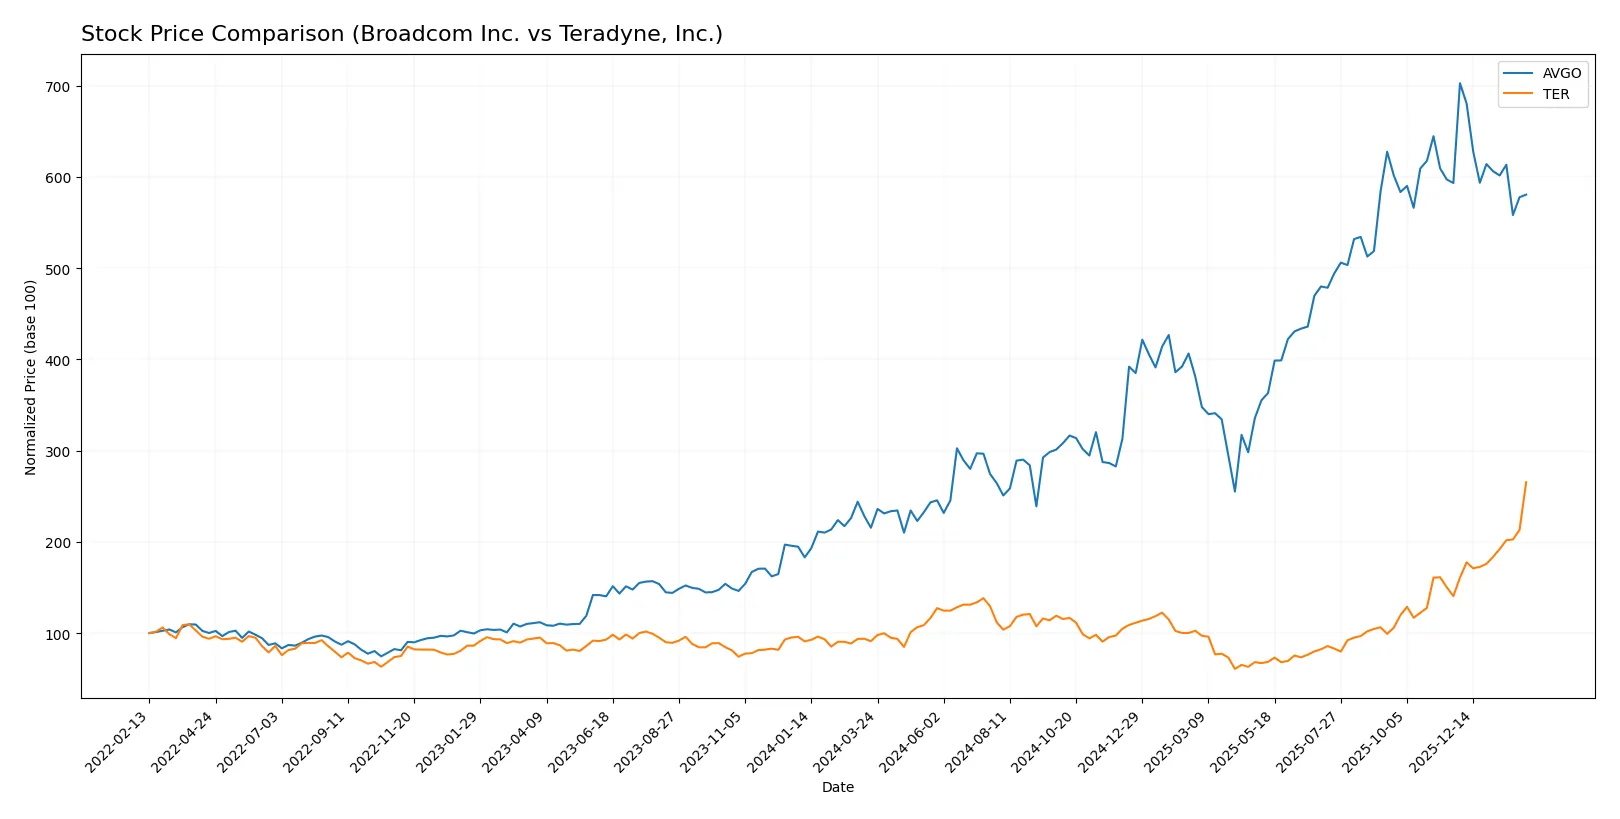
Trend Comparison
Broadcom Inc. shows a bullish 169.46% gain over 12 months with decelerating upward momentum and high volatility (79.04 std. dev.). Recent months reveal a slight bearish pullback of -2.14%.
Teradyne, Inc. outperformed with a 191.2% bullish rise over the year, accelerating gains and moderate volatility (40.42 std. dev.). Its recent trend sharply accelerated, gaining 88.86%.
Teradyne leads Broadcom in total return and recent positive momentum, delivering the highest market performance over the period analyzed.
Target Prices
Analysts present a bullish consensus for both Broadcom Inc. and Teradyne, Inc., reflecting strong sector momentum.
| Company | Target Low | Target High | Consensus |
|---|---|---|---|
| Broadcom Inc. | 370 | 510 | 450.12 |
| Teradyne, Inc. | 175 | 335 | 276.08 |
The target consensus for Broadcom at 450 suggests upside from the current 333 price, signaling confidence in its semiconductor leadership. Teradyne’s consensus near 276 versus a current 300 price indicates possible modest price correction or stabilization ahead.

Don’t Let Luck Decide Your Entry Point
Optimize your entry points with our advanced ProRealTime indicators. You’ll get efficient buy signals with precise price targets for maximum performance. Start outperforming now!
How do institutions grade them?
Broadcom Inc. Grades
The following table summarizes recent grading actions from leading financial institutions for Broadcom Inc.:
| Grading Company | Action | New Grade | Date |
|---|---|---|---|
| Wells Fargo | Upgrade | Overweight | 2026-01-15 |
| Mizuho | Maintain | Outperform | 2026-01-09 |
| Truist Securities | Maintain | Buy | 2025-12-19 |
| UBS | Maintain | Buy | 2025-12-15 |
| Rosenblatt | Maintain | Buy | 2025-12-12 |
| Morgan Stanley | Maintain | Overweight | 2025-12-12 |
| Barclays | Maintain | Overweight | 2025-12-12 |
| Bernstein | Maintain | Outperform | 2025-12-12 |
| Citigroup | Maintain | Buy | 2025-12-12 |
| Mizuho | Maintain | Outperform | 2025-12-12 |
Teradyne, Inc. Grades
Recent institutional grades for Teradyne, Inc. are listed in the table below:
| Grading Company | Action | New Grade | Date |
|---|---|---|---|
| Goldman Sachs | Maintain | Buy | 2026-02-04 |
| Citigroup | Maintain | Buy | 2026-02-04 |
| Cantor Fitzgerald | Maintain | Overweight | 2026-02-04 |
| Evercore ISI Group | Maintain | Outperform | 2026-02-04 |
| Stifel | Maintain | Buy | 2026-02-04 |
| Evercore ISI Group | Maintain | Outperform | 2026-02-03 |
| Cantor Fitzgerald | Maintain | Overweight | 2026-02-02 |
| Stifel | Maintain | Buy | 2026-01-30 |
| UBS | Maintain | Buy | 2026-01-26 |
| B of A Securities | Maintain | Buy | 2026-01-22 |
Which company has the best grades?
Both companies consistently receive strong buy-side ratings from top-tier firms. Broadcom shows a recent upgrade from Wells Fargo to Overweight, reflecting growing confidence. Teradyne maintains solid Buy and Outperform ratings without changes. Investors may view Broadcom’s recent upgrade as a sign of positive momentum.
Risks specific to each company
The following categories identify the critical pressure points and systemic threats facing both firms in the 2026 market environment:
1. Market & Competition
Broadcom Inc.
- Operates in a highly competitive semiconductor sector with a diverse product portfolio, facing fierce innovation pressure.
Teradyne, Inc.
- Competes in niche test equipment and automation markets, challenged by technological shifts and evolving customer demands.
2. Capital Structure & Debt
Broadcom Inc.
- Moderate leverage with debt-to-assets at 38%, interest coverage favorable but debt-to-equity score very unfavorable.
Teradyne, Inc.
- Low leverage with debt-to-assets at 8.3%, strong interest coverage, and a favorable debt-to-equity profile.
3. Stock Volatility
Broadcom Inc.
- Beta of 1.22 indicates moderate volatility, with a wide price range from $138 to $415.
Teradyne, Inc.
- Higher beta at 1.82 reflects greater stock volatility and sensitivity to market swings.
4. Regulatory & Legal
Broadcom Inc.
- Subject to global technology export controls and antitrust scrutiny due to size and market power.
Teradyne, Inc.
- Faces regulatory risks linked to industrial automation and defense sector compliance requirements.
5. Supply Chain & Operations
Broadcom Inc.
- Complex supply chain for semiconductor and firmware components vulnerable to global disruptions.
Teradyne, Inc.
- Supply chain risks from reliance on specialized manufacturing equipment and component sourcing.
6. ESG & Climate Transition
Broadcom Inc.
- Increasing pressure to reduce carbon footprint across hardware production and data center software.
Teradyne, Inc.
- ESG risks relate to industrial automation impact and energy efficiency in manufacturing processes.
7. Geopolitical Exposure
Broadcom Inc.
- Exposure to US-China tech tensions and export restrictions affecting semiconductor sales.
Teradyne, Inc.
- Moderate exposure via global industrial customers, less directly impacted by geopolitical tech disputes.
Which company shows a better risk-adjusted profile?
Broadcom’s largest risk is its elevated leverage and high valuation multiples, which heighten financial vulnerability despite strong profitability. Teradyne faces notable stock volatility and elevated WACC, reflecting market uncertainty and higher capital costs. Teradyne’s lower debt and safer balance sheet underpin a better risk-adjusted position. Notably, Teradyne’s debt-to-assets ratio of 8.3% contrasts sharply with Broadcom’s 38%, justifying caution on Broadcom’s financial structure.
Final Verdict: Which stock to choose?
Broadcom’s superpower lies in its unmatched ability to generate returns well above its cost of capital, signaling a robust and growing economic moat. Its aggressive investment in R&D fuels strong margin expansion, though its sky-high valuation demands caution. This stock fits best in an Aggressive Growth portfolio ready to embrace volatility for outsized gains.
Teradyne offers a strategic moat through its niche automation technology and a notably conservative balance sheet. Its lower leverage and steady cash flows provide a safety cushion compared to Broadcom. Teradyne suits investors seeking a GARP (Growth at a Reasonable Price) approach, balancing growth potential with financial prudence.
If you prioritize high return on invested capital and accelerating profitability, Broadcom outshines with stronger growth dynamics but commands a premium valuation. However, if you seek better stability and a cleaner balance sheet, Teradyne offers superior financial discipline and a safer risk profile despite slower growth. Each presents a distinct analytical scenario aligned with different investor risk appetites.
Disclaimer: Investment carries a risk of loss of initial capital. The past performance is not a reliable indicator of future results. Be sure to understand risks before making an investment decision.
Go Further
I encourage you to read the complete analyses of Broadcom Inc. and Teradyne, Inc. to enhance your investment decisions: