Home > Comparison > Technology > AVGO vs STM
The strategic rivalry between Broadcom Inc. and STMicroelectronics N.V. shapes the semiconductor landscape today. Broadcom operates as a diversified technology powerhouse with a focus on infrastructure software and complex semiconductor subsystems. In contrast, STMicroelectronics emphasizes automotive and industrial analog components with broad geographic reach. This head-to-head pits Broadcom’s integrated product ecosystem against ST’s analog specialization. This analysis aims to identify which model delivers superior risk-adjusted returns for a balanced portfolio in 2026.
Table of contents
Companies Overview
Broadcom Inc. and STMicroelectronics N.V. shape the semiconductor landscape with distinct scale and reach.
Broadcom Inc.: Semiconductor Powerhouse
Broadcom dominates as a global semiconductor and infrastructure software provider. It generates revenue from four segments: Wired Infrastructure, Wireless Communications, Enterprise Storage, and Industrial & Other. In 2026, its strategic focus remains on integrating complex sub-systems and firmware to support data centers and telecommunications, leveraging diverse end-markets like smartphones and factory automation.
STMicroelectronics N.V.: Diverse Semiconductor Innovator
STMicroelectronics stands out as a multifaceted semiconductor designer and manufacturer in Europe and beyond. Its revenues stem from Automotive and Discrete, Analog, MEMS and Sensors, and Microcontrollers segments. The 2026 strategy emphasizes expanding application-specific integrated circuits and wireless charging solutions to serve automotive, industrial, and personal electronics sectors globally.
Strategic Collision: Similarities & Divergences
Broadcom and STMicroelectronics both compete in semiconductors but pursue contrasting philosophies. Broadcom builds a closed ecosystem of integrated hardware and software, while STMicroelectronics delivers more modular, application-specific products. Their primary battleground is industrial and automotive markets. Broadcom offers scale and integration; STMicroelectronics provides versatility and regional specialization, defining distinct investment profiles.
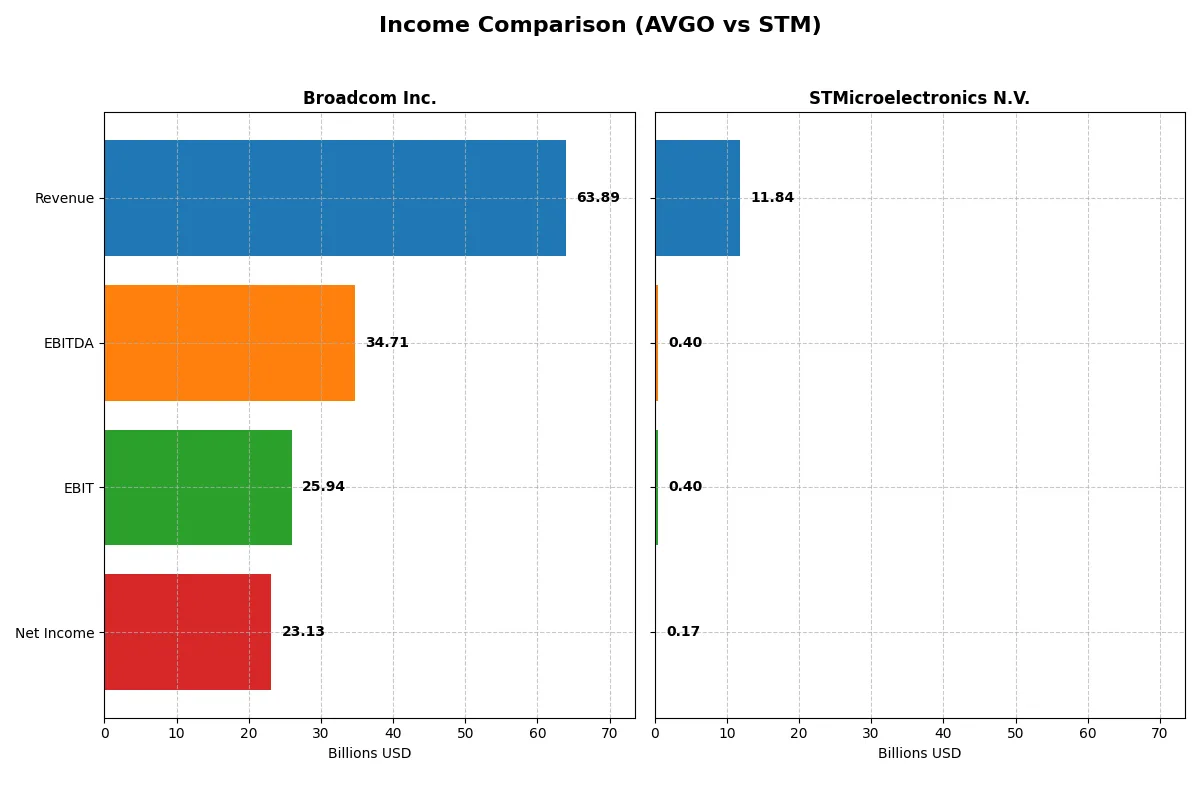
Income Statement Comparison
The following data dissects the core profitability and scalability of both corporate engines to reveal who dominates the bottom line:
| Metric | Broadcom Inc. (AVGO) | STMicroelectronics N.V. (STM) |
|---|---|---|
| Revenue | 63.9B | 11.8B |
| Cost of Revenue | 20.6B | 7.8B |
| Operating Expenses | 17.8B | 3.7B |
| Gross Profit | 43.3B | 4.0B |
| EBITDA | 34.7B | 0.4B |
| EBIT | 25.9B | 0.4B |
| Interest Expense | 3.2B | 0 |
| Net Income | 23.1B | 0.2B |
| EPS | 4.91 | 0.19 |
| Fiscal Year | 2025 | 2025 |
Income Statement Analysis: The Bottom-Line Duel
The following income statement comparison reveals which company converts revenue into profit most efficiently, exposing the true strength of their business engines.
Broadcom Inc. Analysis
Broadcom’s revenue surged from $27.5B in 2021 to $63.9B in 2025, with net income exploding from $6.4B to $23.1B. Its gross margin holds strong at 67.8%, while net margin impressively stands at 36.2%. The latest year shows exceptional momentum, with net income and EPS growing over 200%, reflecting operational efficiency and robust profit scaling.
STMicroelectronics N.V. Analysis
STMicroelectronics’ revenue declined from $12.8B in 2021 to $11.8B in 2025, dragging net income down sharply from $2.0B to near breakeven. Gross margin sits at 33.9%, but net margin compresses to just 1.4%. The recent year’s steep declines in revenue (-10.8%) and net income (-88%) highlight operational challenges and deteriorating profitability.
Margin Dominance vs. Revenue Decline
Broadcom outperforms STMicroelectronics decisively with higher revenue growth and superior margin control. Broadcom’s ability to expand net income and margins contrasts starkly with ST’s shrinking top line and near-zero profitability. Investors seeking stable, scalable profits will find Broadcom’s profile more compelling in this fundamental contest.
Financial Ratios Comparison
These vital ratios act as a diagnostic tool to expose the underlying fiscal health, valuation premiums, and capital efficiency of the companies compared below:
| Ratios | Broadcom Inc. (AVGO) | STMicroelectronics N.V. (STM) |
|---|---|---|
| ROE | 28.4% | 0.9% |
| ROIC | 16.4% | 0.7% |
| P/E | 73.9 | N/A |
| P/B | 21.0 | N/A |
| Current Ratio | 1.71 | 3.36 |
| Quick Ratio | 1.58 | 2.43 |
| D/E (Debt-to-Equity) | 0.80 | 0.12 |
| Debt-to-Assets | 38.1% | 8.6% |
| Interest Coverage | 7.94 | 0 |
| Asset Turnover | 0.37 | 0.48 |
| Fixed Asset Turnover | 25.3 | 1.07 |
| Payout ratio | 48.2% | 0% |
| Dividend yield | 0.65% | 0% |
| Fiscal Year | 2025 | 2025 |
Efficiency & Valuation Duel: The Vital Signs
Ratios serve as a company’s DNA, exposing hidden risks and operational strengths crucial for investor insight.
Broadcom Inc.
Broadcom delivers strong profitability with a 28.45% ROE and a robust 36.2% net margin, reflecting operational excellence. Its valuation appears stretched, trading at a P/E of 73.87, well above industry norms. The company returns value through a modest 0.65% dividend yield, balancing shareholder payouts with significant reinvestment in R&D at 17.2% of revenue.
STMicroelectronics N.V.
STMicroelectronics struggles with weak profitability, reporting a 0.93% ROE and a slim 1.41% net margin, signaling operational challenges. Its valuation metrics are favorable due to a P/E and P/B reported at zero, which may reflect accounting or market anomalies. The firm retains earnings for growth, allocating about 15.7% of sales to R&D, but currently offers no dividend.
Premium Valuation vs. Operational Safety
Broadcom commands a high valuation, justified by strong returns but posing a risk for stretched multiples. STMicroelectronics offers a cheaper valuation but faces profitability and operational hurdles. Investors seeking operational safety may favor Broadcom’s efficiency, while those targeting value might consider STMicroelectronics’s lower valuation and growth focus.
Which one offers the Superior Shareholder Reward?
I find Broadcom Inc. (AVGO) delivers superior shareholder reward compared to STMicroelectronics N.V. (STM). AVGO offers a 0.65% dividend yield with a sustainable 48% payout ratio backed by strong free cash flow of 5.7 per share. Its substantial buyback activity amplifies total returns. STM pays a modest 1.28% yield on a low 18% payout ratio but struggles with free cash flow, posting negative figures recently, limiting buybacks. AVGO’s consistent, well-covered dividends combined with aggressive buybacks make its distribution model more sustainable and attractive for total return in 2026.
Comparative Score Analysis: The Strategic Profile
The radar chart reveals the fundamental DNA and trade-offs of Broadcom Inc. and STMicroelectronics N.V., highlighting their financial profiles and valuation nuances:
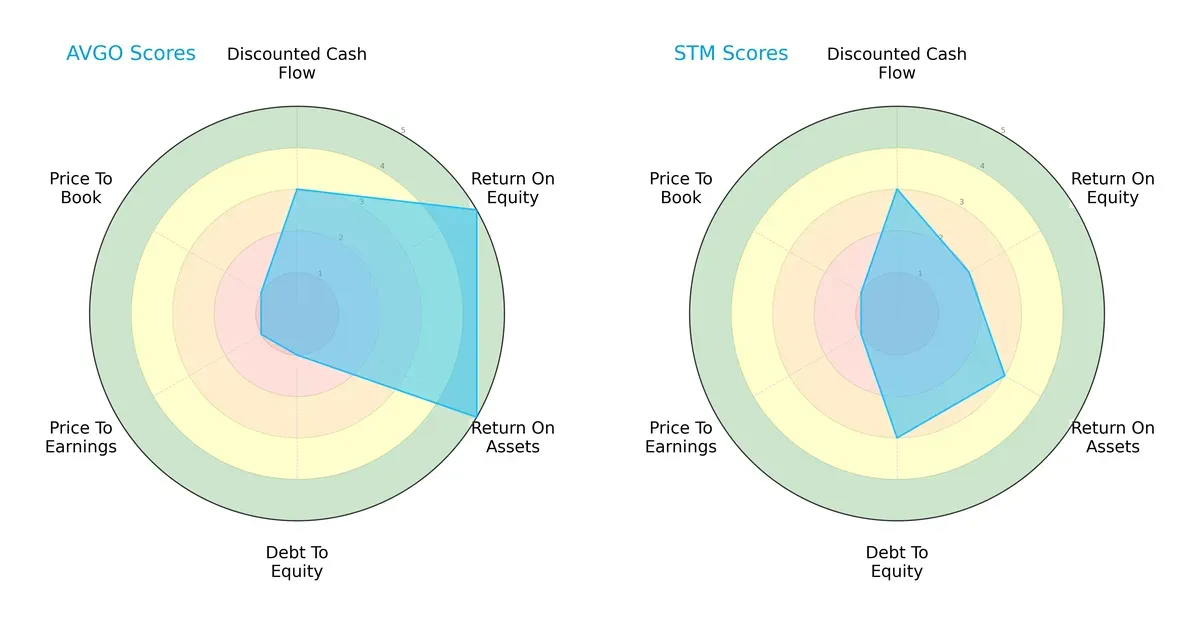
Broadcom dominates in profitability with top ROE and ROA scores (5 each), signaling efficient capital and asset use. However, it carries a heavy financial risk, reflected in a very unfavorable debt-to-equity score (1). STMicroelectronics shows a more balanced debt profile (score 3) but lags in profitability (ROE 2, ROA 3). Both firms share undervaluation signals via very unfavorable P/E and P/B scores (1 each), though Broadcom’s edge lies in profit generation, while STMicroelectronics leans on financial stability.
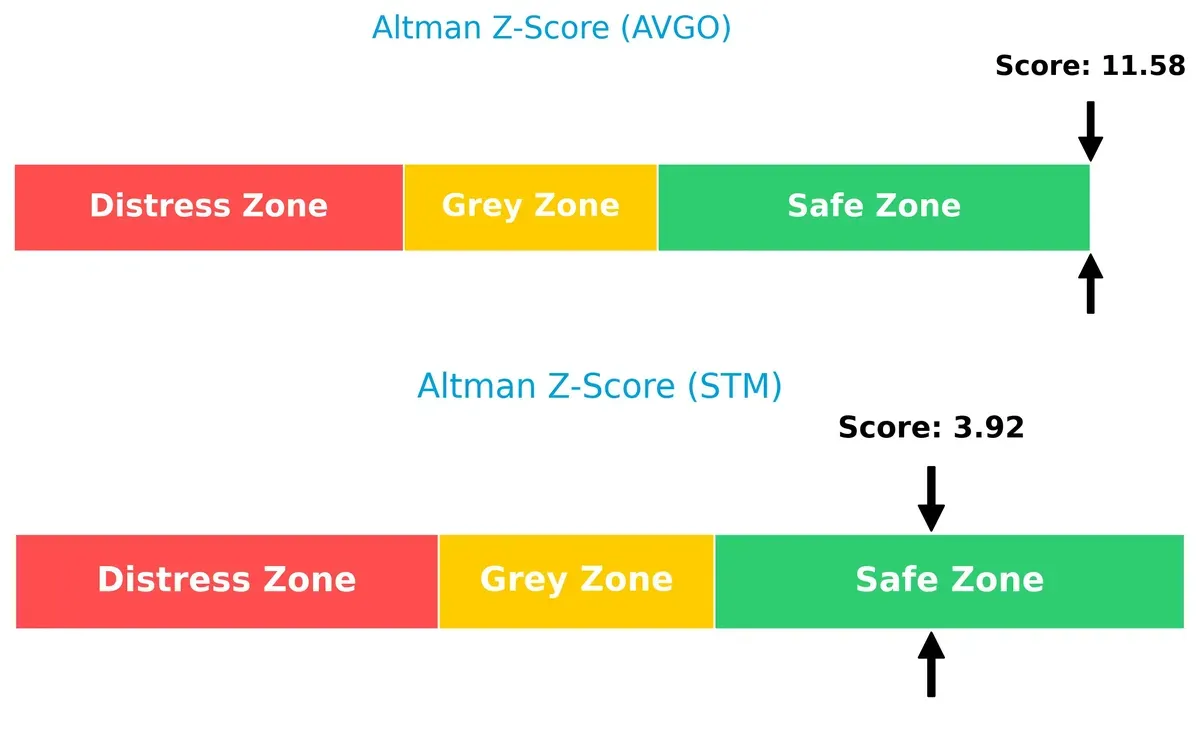
Bankruptcy Risk: Solvency Showdown
Broadcom’s Altman Z-Score of 11.58 vastly exceeds STMicroelectronics’ 3.92, indicating superior solvency and a more robust buffer against bankruptcy risks in this economic cycle:
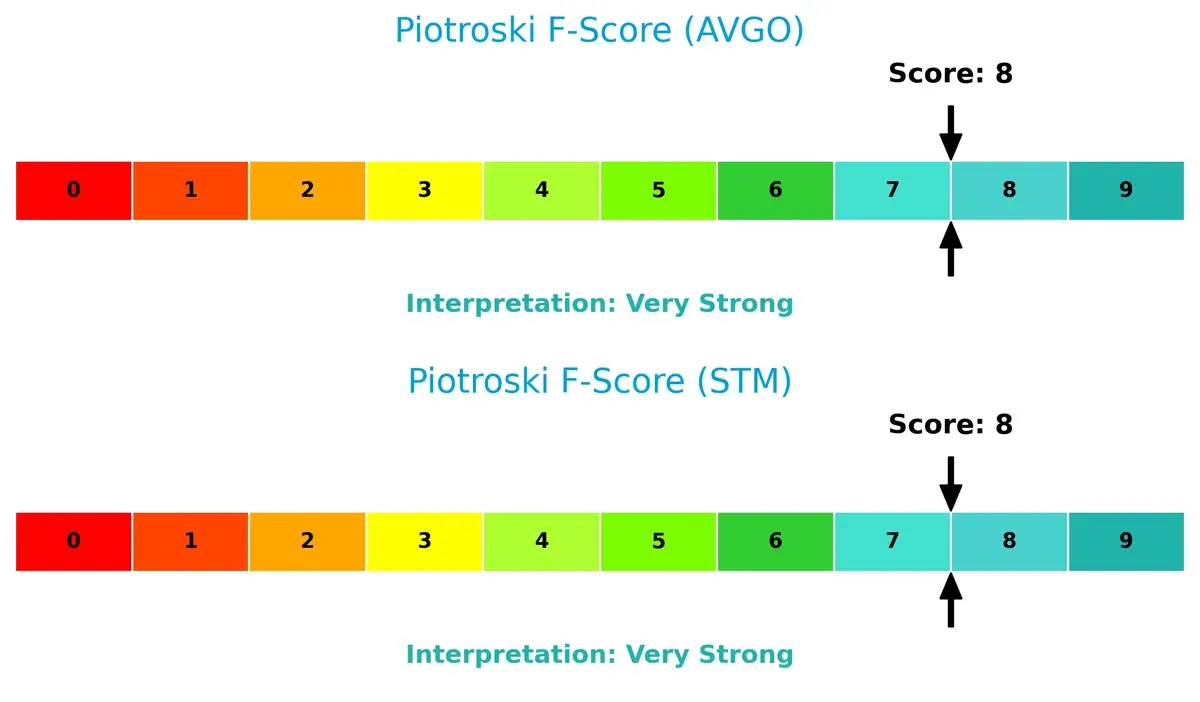
Financial Health: Quality of Operations
Both Broadcom and STMicroelectronics score an impressive 8 on the Piotroski F-Score, reflecting very strong internal financial health and operational quality. Neither shows red flags, suggesting solid fundamentals on both sides:
How are the two companies positioned?
This section dissects Broadcom and STMicroelectronics’ operational DNA by comparing revenue distribution and internal dynamics. The goal is to confront their economic moats to reveal which model offers the most resilient competitive advantage today.
Revenue Segmentation: The Strategic Mix
This comparison dissects how Broadcom Inc. and STMicroelectronics N.V. diversify their income streams and where their primary sector bets lie:
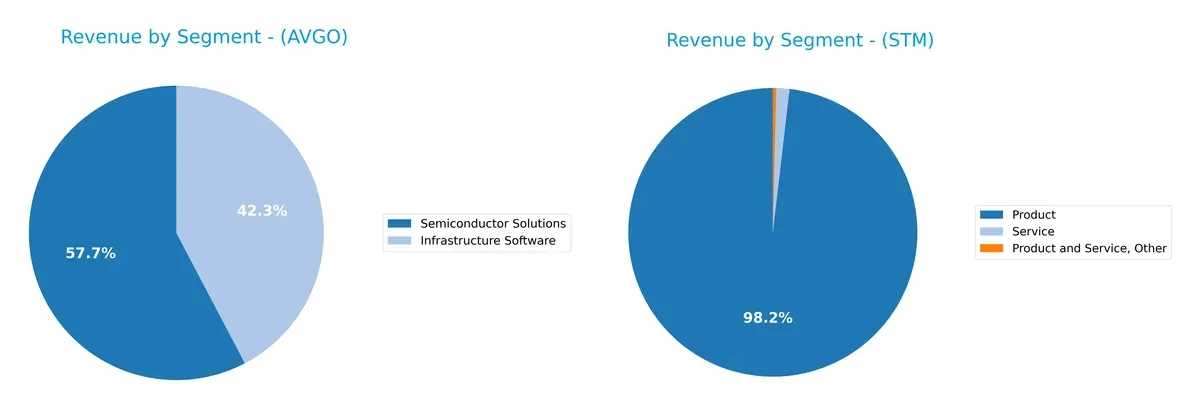
Broadcom Inc. anchors its revenue in two robust segments: Semiconductor Solutions at $36.9B and Infrastructure Software at $27.0B in 2025. This split shows a well-balanced model with strong ecosystem lock-in in both chips and software. STMicroelectronics leans heavily on its Product segment, generating $13.2B in 2024, with negligible Service and Other revenues. STM’s concentration signals higher sector risk and less diversification versus Broadcom’s dual-anchor strategy.
Strengths and Weaknesses Comparison
This table compares the Strengths and Weaknesses of Broadcom Inc. and STMicroelectronics N.V.:
Broadcom Inc. Strengths
- High net margin of 36.2%
- Strong ROE at 28.45%
- ROIC well above WACC at 16.36%
- Diverse revenue in semiconductors and software
- Solid global presence with large Asia Pacific sales
STMicroelectronics N.V. Strengths
- Low debt-to-equity ratio of 0.12
- Favorable interest coverage with infinite value
- Positive P/E and P/B ratios
- Broad geographic exposure including Singapore and Europe
- Stable quick ratio at 2.43
Broadcom Inc. Weaknesses
- Unfavorable high P/E at 73.87 and P/B at 21.01
- Asset turnover low at 0.37
- Dividend yield weak at 0.65%
- Moderate debt levels with 0.8 D/E ratio
- Limited product diversification beyond two main segments
STMicroelectronics N.V. Weaknesses
- Poor profitability with net margin at 1.41% and ROE 0.93%
- ROIC below WACC at 0.67%
- Current ratio high at 3.36 indicating less efficient asset use
- Zero dividend yield
- Asset turnover below 0.5, signaling operational inefficiency
Broadcom showcases robust profitability supported by its focused product segments and strong Asia Pacific presence. STMicroelectronics benefits from conservative leverage and solid geographic reach but struggles with profitability and asset efficiency. These contrasts highlight differing strategic positions and operational challenges.
The Moat Duel: Analyzing Competitive Defensibility
A structural moat is the only reliable shield protecting long-term profits from relentless competition erosion:
Broadcom Inc.: Intangible Assets and Scale Moat
Broadcom’s moat stems from strong intangible assets and scale, evident in its 40.6% EBIT margin and 7%+ ROIC premium over WACC. New infrastructure products and software integration deepen this advantage in 2026.
STMicroelectronics N.V.: Fragmented Cost and Innovation Moat
STMicroelectronics relies on niche innovation and cost efficiencies but lacks Broadcom’s scale. Its negative ROIC trend and slim 3.4% EBIT margin weaken competitive resilience, though automotive and MEMS growth offer upside potential.
Scale and Intangibles vs. Niche Innovation: The Moat Battle
Broadcom’s wider, durable moat outmatches STMicroelectronics’ shrinking advantage. Broadcom’s robust profitability and growing ROIC position it better to defend market share amid intensifying semiconductor competition.
Which stock offers better returns?
The past year saw Broadcom Inc. surge over 150%, while STMicroelectronics N.V. declined 40%, highlighting contrasting trading dynamics and significant divergence in price momentum.
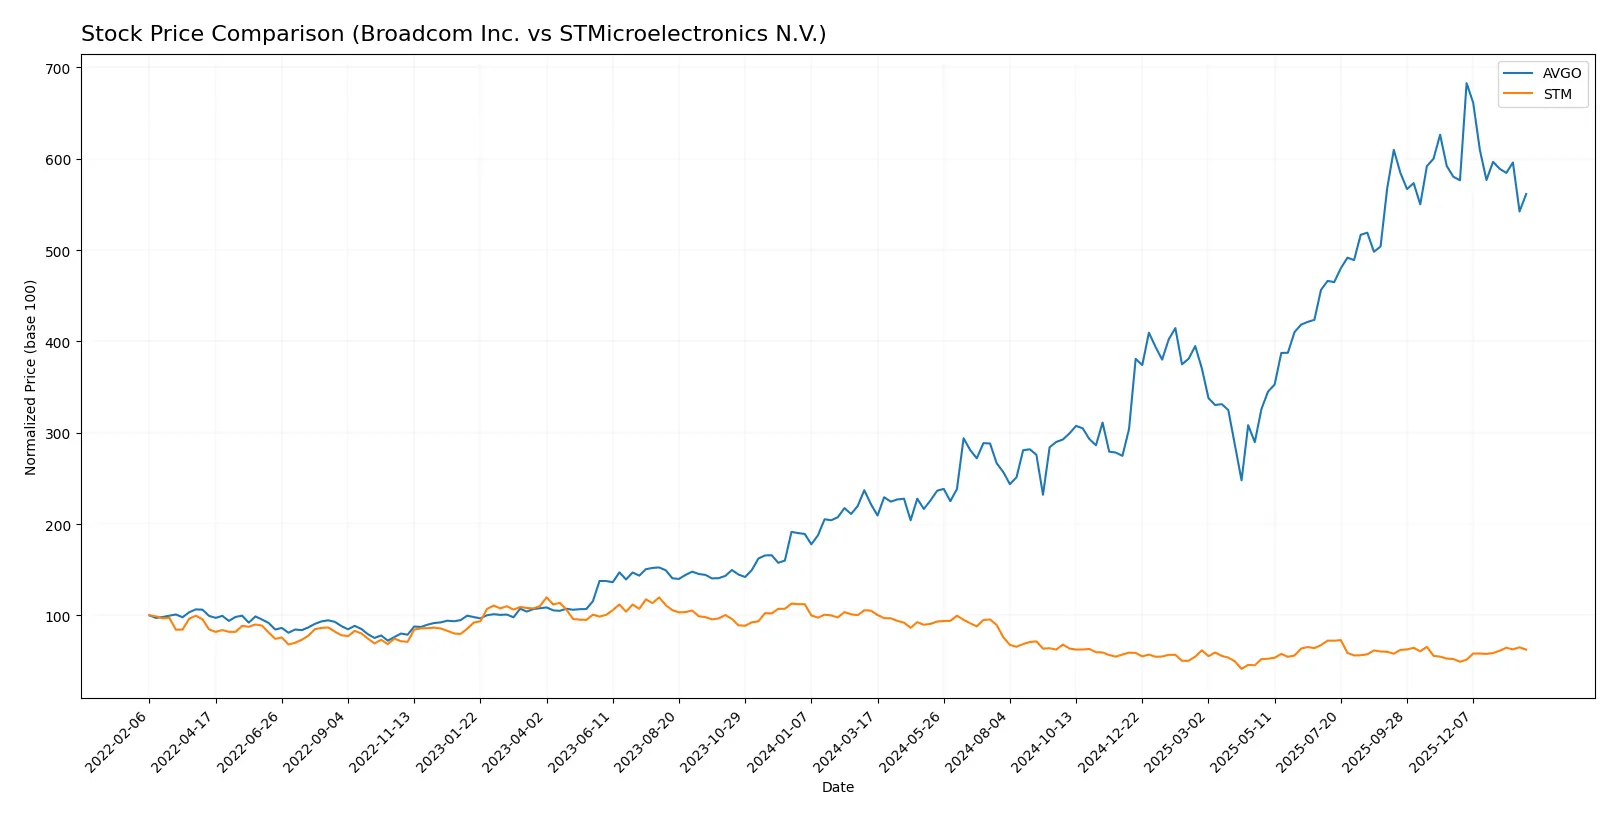
Trend Comparison
Broadcom Inc.’s stock rose 153.15% over the past 12 months, a strong bullish trend with decelerating momentum. It hit a high of 402.96 and a low of 120.47, showing elevated volatility with a 78.96 standard deviation.
STMicroelectronics N.V. fell 40.6% over the same period, reflecting a bearish trend but with accelerating decline. It traded between 18.49 and 46.95, exhibiting modest volatility at a 6.77 standard deviation.
Broadcom’s robust price appreciation dwarfs STMicroelectronics’ losses, delivering the highest market performance by a wide margin over the past year.
Target Prices
Analysts present a cautiously optimistic consensus for Broadcom Inc. and STMicroelectronics N.V.
| Company | Target Low | Target High | Consensus |
|---|---|---|---|
| Broadcom Inc. | 370 | 510 | 450.12 |
| STMicroelectronics N.V. | 28 | 45 | 37.67 |
The consensus target for Broadcom stands about 36% above the current price of 331.3 USD, signaling strong growth expectations. STMicroelectronics’ target consensus at 37.67 USD also suggests upside potential versus its 27.89 USD market price.

Don’t Let Luck Decide Your Entry Point
Optimize your entry points with our advanced ProRealTime indicators. You’ll get efficient buy signals with precise price targets for maximum performance. Start outperforming now!
How do institutions grade them?
Broadcom Inc. Grades
The following table summarizes recent grades from reputable financial institutions for Broadcom Inc.:
| Grading Company | Action | New Grade | Date |
|---|---|---|---|
| Wells Fargo | Upgrade | Overweight | 2026-01-15 |
| Mizuho | Maintain | Outperform | 2026-01-09 |
| Truist Securities | Maintain | Buy | 2025-12-19 |
| UBS | Maintain | Buy | 2025-12-15 |
| B of A Securities | Maintain | Buy | 2025-12-12 |
| Mizuho | Maintain | Outperform | 2025-12-12 |
| TD Cowen | Maintain | Buy | 2025-12-12 |
| Benchmark | Maintain | Buy | 2025-12-12 |
| Keybanc | Maintain | Overweight | 2025-12-12 |
| Rosenblatt | Maintain | Buy | 2025-12-12 |
STMicroelectronics N.V. Grades
Below is a summary of recent grades from established grading firms for STMicroelectronics N.V.:
| Grading Company | Action | New Grade | Date |
|---|---|---|---|
| TD Cowen | Maintain | Buy | 2025-10-24 |
| Susquehanna | Maintain | Positive | 2025-10-22 |
| Susquehanna | Maintain | Positive | 2025-07-25 |
| Susquehanna | Maintain | Positive | 2025-07-22 |
| Baird | Upgrade | Outperform | 2025-07-22 |
| Jefferies | Upgrade | Buy | 2025-02-19 |
| Bernstein | Downgrade | Market Perform | 2025-02-05 |
| Susquehanna | Maintain | Positive | 2025-01-31 |
| Barclays | Downgrade | Underweight | 2025-01-22 |
| JP Morgan | Downgrade | Neutral | 2024-12-09 |
Which company has the best grades?
Broadcom Inc. consistently receives strong Buy and Outperform grades, with a recent upgrade from Wells Fargo. STMicroelectronics shows mixed ratings, including downgrades and neutral positions. Investors may view Broadcom’s steadier, more bullish grades as a sign of greater confidence from analysts.
Risks specific to each company
The following categories identify the critical pressure points and systemic threats facing Broadcom Inc. and STMicroelectronics N.V. in the 2026 market environment:
1. Market & Competition
Broadcom Inc.
- Dominates wired and wireless infrastructure with high-margin segments but faces premium valuation pressures.
STMicroelectronics N.V.
- Competes in automotive and industrial niches with lower margins and intense regional competition.
2. Capital Structure & Debt
Broadcom Inc.
- Moderate leverage with a debt-to-assets ratio near 38%, posing some refinancing risk.
STMicroelectronics N.V.
- Conservative debt profile with just 8.6% debt-to-assets, reducing financial risk.
3. Stock Volatility
Broadcom Inc.
- Beta at 1.22 indicates moderate volatility relative to the tech sector.
STMicroelectronics N.V.
- Slightly higher beta of 1.29 signals elevated sensitivity to market swings.
4. Regulatory & Legal
Broadcom Inc.
- U.S.-based with exposure to global trade tensions and IP litigations in semiconductors.
STMicroelectronics N.V.
- European-headquartered, potentially impacted by EU regulations and export controls.
5. Supply Chain & Operations
Broadcom Inc.
- Complex global supply chain with some reliance on Asia-Pacific manufacturing hubs.
STMicroelectronics N.V.
- Strong presence in Europe and Asia, but supply chain vulnerable to regional disruptions.
6. ESG & Climate Transition
Broadcom Inc.
- Increasing focus on energy-efficient products; moderate ESG disclosure.
STMicroelectronics N.V.
- Aggressive sustainability initiatives aligned with EU climate policies.
7. Geopolitical Exposure
Broadcom Inc.
- High U.S.-China trade exposure, risking tariffs and export restrictions.
STMicroelectronics N.V.
- Exposure to EU-China dynamics; benefits from diversified regional markets.
Which company shows a better risk-adjusted profile?
Broadcom’s highest risk is its elevated debt load amid a premium valuation, which could amplify downside in a downturn. STMicroelectronics struggles with weak profitability but maintains a conservative balance sheet and favorable ESG positioning. I see Broadcom as carrying more financial risk, while STM faces operational and market execution challenges. The recent surge in Broadcom’s debt-to-assets ratio to 38% contrasts with STM’s stable 8.6%, justifying caution on leverage. Overall, STMicroelectronics offers a better risk-adjusted profile given its financial conservatism and diversification despite lower margins.
Final Verdict: Which stock to choose?
Broadcom Inc. (AVGO) excels as a cash machine with a durable competitive advantage, consistently generating returns well above its cost of capital. Its main point of vigilance lies in a stretched valuation, reflecting a premium that might temper near-term upside. It suits aggressive growth portfolios seeking quality and scalability.
STMicroelectronics N.V. (STM) offers a strategic moat grounded in solid balance sheet discipline and low leverage, providing a safer haven relative to Broadcom. However, declining profitability and value destruction pose cautionary flags. It fits GARP investors who prioritize financial stability and potential undervaluation over rapid growth.
If you prioritize robust value creation and scalable profitability, Broadcom outshines with its strong moat and growth trajectory despite valuation risks. However, if you seek better financial stability and lower leverage, STM offers a more conservative profile amid challenging earnings trends. Both present distinct analytical scenarios aligned with differing investor appetites.
Disclaimer: Investment carries a risk of loss of initial capital. The past performance is not a reliable indicator of future results. Be sure to understand risks before making an investment decision.
Go Further
I encourage you to read the complete analyses of Broadcom Inc. and STMicroelectronics N.V. to enhance your investment decisions: