Broadcom Inc. and Skyworks Solutions, Inc. are two prominent players in the semiconductor industry, each driving innovation in wireless communication and infrastructure technology. While Broadcom boasts a vast, diversified portfolio and global reach, Skyworks specializes in high-performance analog and mixed-signal semiconductors. Their market overlap and contrasting strategies make this comparison particularly insightful. Join me as we explore which company presents the most compelling opportunity for investors in 2026.

Table of contents
Companies Overview
I will begin the comparison between Broadcom and Skyworks Solutions by providing an overview of these two companies and their main differences.
Broadcom Overview
Broadcom Inc. is a major global technology company specializing in semiconductor and infrastructure software solutions. Headquartered in Palo Alto, California, it operates through four segments: Wired Infrastructure, Wireless Communications, Enterprise Storage, and Industrial & Other. Broadcom offers a wide array of products used in networking, telecommunications, smartphones, data centers, and industrial applications, supported by a workforce of approximately 37,000 employees.
Skyworks Solutions Overview
Skyworks Solutions, Inc., based in Irvine, California, designs, develops, and markets proprietary semiconductor products worldwide. Its portfolio includes amplifiers, filters, front-end modules, and a variety of analog and digital components serving markets such as aerospace, automotive, broadband, medical, military, and consumer electronics. The company employs around 10,100 people and sells through direct sales and distribution channels.
Key similarities and differences
Both Broadcom and Skyworks operate within the semiconductor industry and serve diverse technology markets, including communications and industrial sectors. Broadcom has a broader product range spanning from semiconductors to infrastructure software, while Skyworks focuses primarily on semiconductor components with extensive analog and mixed-signal expertise. The scale of Broadcom is significantly larger, with a market cap exceeding 1.6T compared to Skyworks’ 8.9B, reflecting differences in market reach and operational scope.
Income Statement Comparison
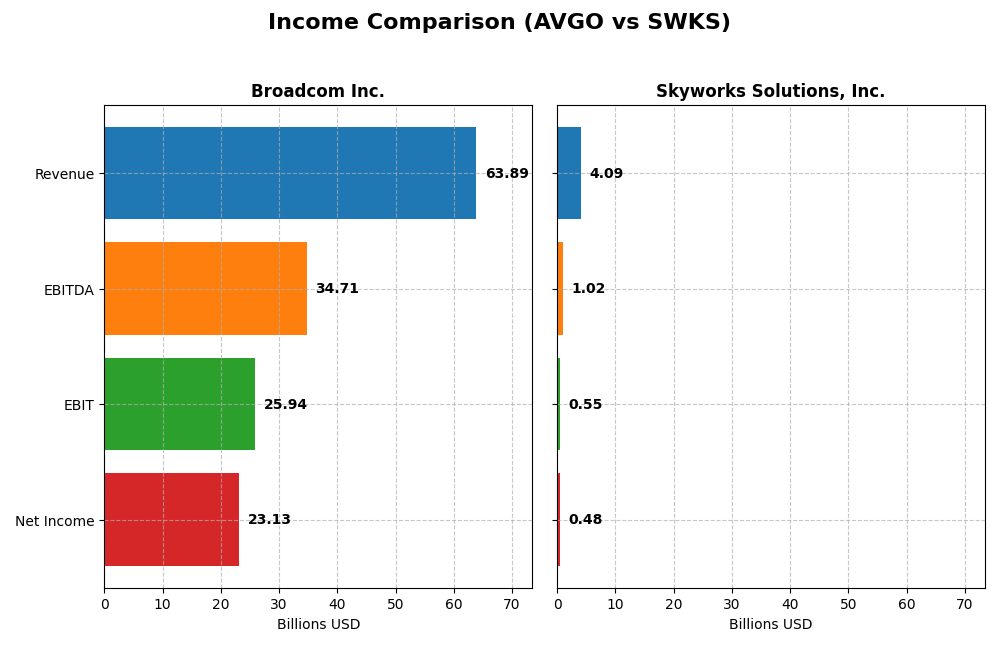
This table presents a side-by-side comparison of key income statement metrics for Broadcom Inc. and Skyworks Solutions, Inc. for the fiscal year 2025.
| Metric | Broadcom Inc. (AVGO) | Skyworks Solutions, Inc. (SWKS) |
|---|---|---|
| Market Cap | 1.6T | 8.9B |
| Revenue | 63.9B | 4.1B |
| EBITDA | 34.7B | 1.0B |
| EBIT | 25.9B | 554M |
| Net Income | 23.1B | 477M |
| EPS | 4.91 | 3.09 |
| Fiscal Year | 2025 | 2025 |
Income Statement Interpretations
Broadcom Inc.
Broadcom’s revenue increased substantially from $27.45B in 2021 to $63.89B in 2025, with net income growing even faster to $23.13B in 2025. Margins improved significantly, with a gross margin of 67.77% and net margin reaching 36.2%. The latest fiscal year saw a strong 23.87% revenue growth and a remarkable 216.69% net margin expansion, reflecting robust operational efficiency.
Skyworks Solutions, Inc.
Skyworks experienced a declining revenue trend, dropping from $5.11B in 2021 to $4.09B in 2025, alongside decreasing net income which fell to $477M in 2025. Margins contracted but remained positive, with a gross margin of 41.16% and a net margin near 11.67%. The most recent year showed a 2.18% revenue decline and an 18.17% net margin decrease, signaling pressure on profitability.
Which one has the stronger fundamentals?
Broadcom displays stronger fundamentals, with favorable growth across revenue, net income, and margins, including a substantial improvement in profitability and EPS. In contrast, Skyworks faces unfavorable trends in revenue and earnings growth with shrinking margins. Broadcom’s consistency and margin strength suggest more resilient earnings quality and operational leverage.
Financial Ratios Comparison
The table below presents the most recent key financial ratios for Broadcom Inc. and Skyworks Solutions, Inc. as of their fiscal year 2025, facilitating a side-by-side comparison of profitability, liquidity, leverage, efficiency, and dividend metrics.
| Ratios | Broadcom Inc. (AVGO) | Skyworks Solutions, Inc. (SWKS) |
|---|---|---|
| ROE | 28.4% | 8.29% |
| ROIC | 16.4% | 6.35% |
| P/E | 73.9 | 24.95 |
| P/B | 21.0 | 2.07 |
| Current Ratio | 1.71 | 2.33 |
| Quick Ratio | 1.58 | 1.76 |
| D/E (Debt-to-Equity) | 0.80 | 0.21 |
| Debt-to-Assets | 38.1% | 15.2% |
| Interest Coverage | 7.94 | 18.5 |
| Asset Turnover | 0.37 | 0.52 |
| Fixed Asset Turnover | 25.3 | 2.95 |
| Payout Ratio | 48.2% | 90.7% |
| Dividend Yield | 0.65% | 3.63% |
Interpretation of the Ratios
Broadcom Inc.
Broadcom shows strong profitability with a net margin of 36.2% and a return on equity of 28.45%, both favorable indicators. However, its valuation ratios like P/E of 73.87 and P/B of 21.01 are unfavorable, suggesting a high market premium. The company pays a dividend with a low yield of 0.65%, indicating modest shareholder returns relative to its valuation.
Skyworks Solutions, Inc.
Skyworks displays a favorable net margin of 11.67% and solid liquidity ratios, including a current ratio of 2.33. Its return on equity at 8.29% is unfavorable, reflecting moderate profitability. The dividend yield is notably higher at 3.63%, supporting stronger income returns for investors. Debt levels and interest coverage ratios are favorable, indicating prudent financial management.
Which one has the best ratios?
Both companies have an equal proportion of favorable ratios at 50%, but Broadcom’s higher profitability contrasts with its stretched valuation metrics. Skyworks offers more balanced valuation and liquidity with a higher dividend yield, yet shows weaker profitability measures. Overall, Broadcom excels in returns, while Skyworks provides more conservative financial ratios and income returns.
Strategic Positioning
This section compares the strategic positioning of Broadcom Inc. and Skyworks Solutions, Inc., including Market position, Key segments, and Exposure to technological disruption:
Broadcom Inc.
- Leading global technology company with a $1.6T market cap, facing typical semiconductor competition.
- Diversified segments: Infrastructure Software and Semiconductor Solutions drive revenues.
- Operates with established semiconductor and software technologies; no explicit disruption exposure stated.
Skyworks Solutions, Inc.
- Smaller player with $8.9B market cap, operating in semiconductor industry with competitive pressures.
- Focused on proprietary semiconductor products serving diverse markets like aerospace and automotive.
- No explicit exposure to technological disruption detailed in provided data.
Broadcom Inc. vs Skyworks Solutions, Inc. Positioning
Broadcom pursues a diversified strategy across software and semiconductor segments, offering broad market exposure. Skyworks is more concentrated on proprietary semiconductor products, serving niche markets. Broadcom’s scale provides wider business drivers, while Skyworks has a narrower focus.
Which has the best competitive advantage?
Broadcom demonstrates a very favorable moat with growing ROIC above WACC, indicating durable competitive advantage. Skyworks shows a very unfavorable moat with declining ROIC below WACC, signaling value destruction and weaker competitive positioning.
Stock Comparison
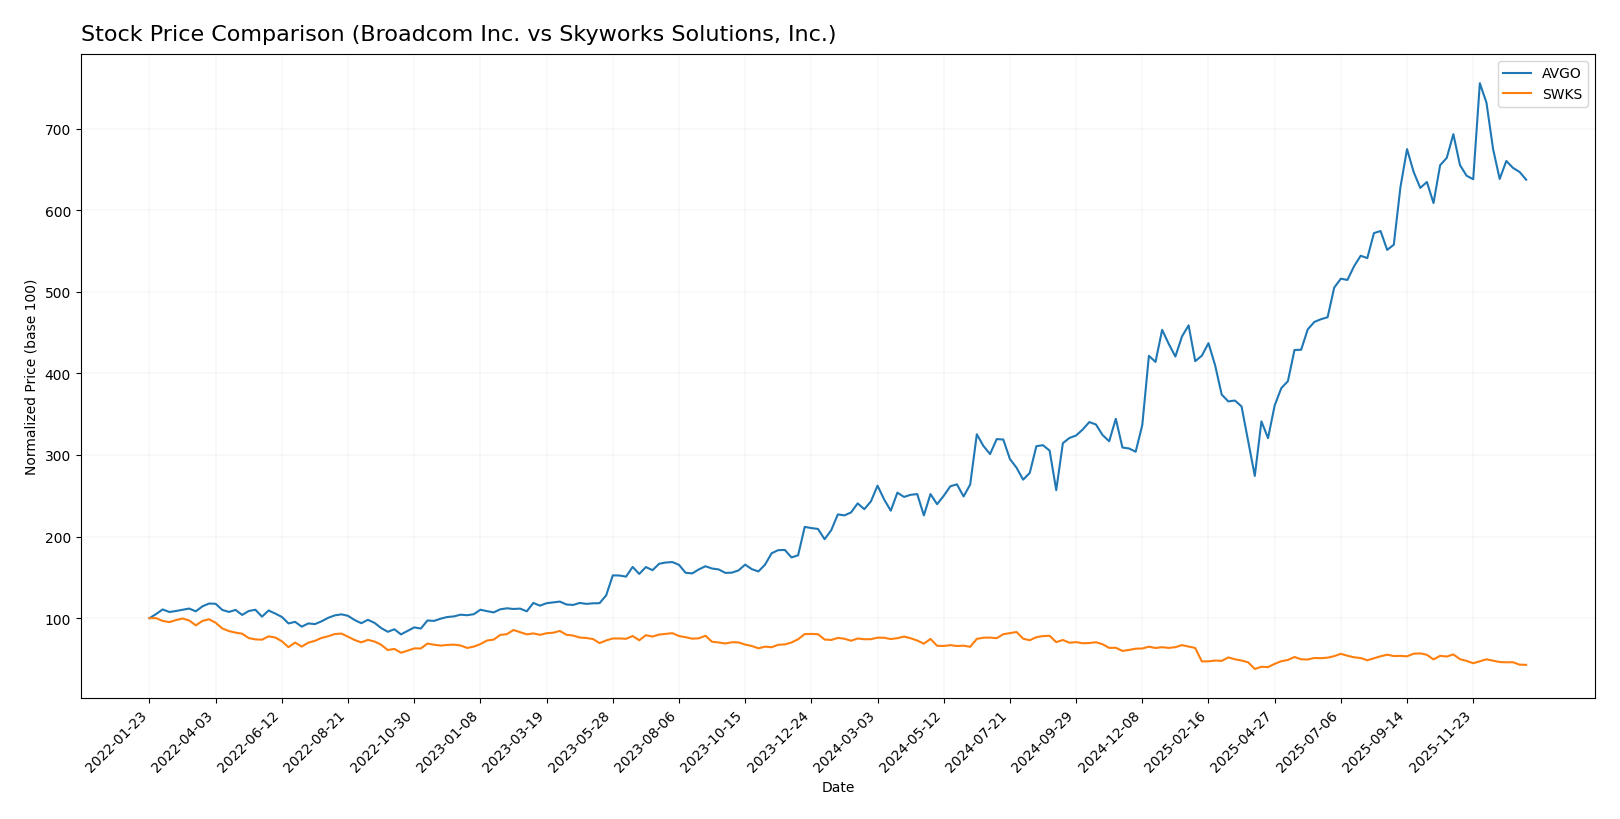
The stock price chart highlights significant divergence in performance between Broadcom Inc. and Skyworks Solutions, Inc. over the past year, with Broadcom showing strong gains despite recent deceleration, while Skyworks faces sustained declines.
Trend Analysis
Broadcom Inc. (AVGO) experienced a bullish trend over the past 12 months with a 162.18% price increase, though this growth shows signs of deceleration. The stock reached a high of 402.96 and a low of 120.47, with volatility measured by a standard deviation of 78.56.
Skyworks Solutions, Inc. (SWKS) displayed a bearish trend over the same period, with a 42.36% price decline and decelerating losses. The stock’s price fluctuated between 52.78 and 116.18, with a lower standard deviation of 16.33 indicating less volatility than Broadcom.
Comparing both stocks, Broadcom delivered the highest market performance with a strong positive return, while Skyworks encountered substantial negative returns, reflecting contrasting market dynamics.
Target Prices
Analysts present a clear consensus on target prices for Broadcom Inc. and Skyworks Solutions, Inc.
| Company | Target High | Target Low | Consensus |
|---|---|---|---|
| Broadcom Inc. | 510 | 370 | 454.8 |
| Skyworks Solutions | 140 | 65 | 88.22 |
The consensus target price for Broadcom at 454.8 USD is significantly above its current price of 339.89 USD, indicating expected upside potential. Skyworks’ consensus target at 88.22 USD also suggests room for growth from its present 59.86 USD.
Analyst Opinions Comparison
This section compares analysts’ ratings and grades for Broadcom Inc. and Skyworks Solutions, Inc.:
Rating Comparison
Broadcom Inc. Rating
- Rating: B, considered Very Favorable by analysts.
- Discounted Cash Flow Score: Moderate at 3 out of 5.
- ROE Score: Very Favorable, highest score of 5.
- ROA Score: Very Favorable, also highest at 5.
- Debt To Equity Score: Very Unfavorable, low at 1.
- Overall Score: Moderate at 3 out of 5.
Skyworks Solutions, Inc. Rating
- Rating: B+, also considered Very Favorable by analysts.
- Discounted Cash Flow Score: Favorable at 4 out of 5.
- ROE Score: Moderate at 3 out of 5.
- ROA Score: Favorable at 4 out of 5.
- Debt To Equity Score: Moderate at 3 out of 5.
- Overall Score: Moderate at 3 out of 5.
Which one is the best rated?
Skyworks Solutions, Inc. holds a slightly better overall rating of B+ compared to Broadcom’s B. Skyworks scores higher in discounted cash flow and debt-to-equity, while Broadcom excels in return on equity and assets. Both share a moderate overall score.
Scores Comparison
Here is a comparison of the Altman Z-Score and Piotroski Score for Broadcom Inc. and Skyworks Solutions, Inc.:
Broadcom Inc. Scores
- Altman Z-Score: 12.13, indicating a safe zone with very low bankruptcy risk.
- Piotroski Score: 8, classified as very strong financial health.
Skyworks Solutions, Inc. Scores
- Altman Z-Score: 4.67, indicating a safe zone with low bankruptcy risk.
- Piotroski Score: 7, classified as strong financial health.
Which company has the best scores?
Broadcom exhibits a higher Altman Z-Score and Piotroski Score than Skyworks, suggesting stronger financial stability and health based strictly on the provided data.
Grades Comparison
Here is a detailed comparison of the recent grades assigned to Broadcom Inc. and Skyworks Solutions, Inc.:
Broadcom Inc. Grades
The table below lists recent grades from reliable financial institutions for Broadcom Inc.:
| Grading Company | Action | New Grade | Date |
|---|---|---|---|
| Mizuho | Maintain | Outperform | 2026-01-09 |
| Truist Securities | Maintain | Buy | 2025-12-19 |
| UBS | Maintain | Buy | 2025-12-15 |
| Benchmark | Maintain | Buy | 2025-12-12 |
| Rosenblatt | Maintain | Buy | 2025-12-12 |
| Piper Sandler | Maintain | Overweight | 2025-12-12 |
| TD Cowen | Maintain | Buy | 2025-12-12 |
| B of A Securities | Maintain | Buy | 2025-12-12 |
| JP Morgan | Maintain | Overweight | 2025-12-12 |
| Mizuho | Maintain | Outperform | 2025-12-12 |
Broadcom’s grades consistently indicate strong confidence, with multiple “Buy,” “Overweight,” and “Outperform” ratings maintained across reputable grading companies.
Skyworks Solutions, Inc. Grades
The table below shows recent grades from reliable financial institutions for Skyworks Solutions, Inc.:
| Grading Company | Action | New Grade | Date |
|---|---|---|---|
| Mizuho | Upgrade | Neutral | 2025-11-11 |
| JP Morgan | Maintain | Neutral | 2025-11-05 |
| UBS | Maintain | Neutral | 2025-11-05 |
| Citigroup | Upgrade | Neutral | 2025-10-29 |
| Benchmark | Maintain | Hold | 2025-10-29 |
| Piper Sandler | Upgrade | Overweight | 2025-10-29 |
| Barclays | Upgrade | Equal Weight | 2025-10-29 |
| Keybanc | Upgrade | Overweight | 2025-10-29 |
| UBS | Maintain | Neutral | 2025-10-29 |
| Citigroup | Maintain | Sell | 2025-08-06 |
Skyworks’ grades show a mix of Neutral, Hold, and some upgrades to Overweight, indicating a more cautious outlook with recent improvements from some analysts.
Which company has the best grades?
Broadcom Inc. has received consistently stronger grades, predominantly “Buy” and “Outperform,” compared to Skyworks Solutions, which has a more mixed set of Neutral and Hold ratings with fewer upgrades. This suggests investors may perceive Broadcom as having a more favorable outlook, potentially reflecting in higher confidence and risk-adjusted returns.
Strengths and Weaknesses
Below is a comparison table highlighting the key strengths and weaknesses of Broadcom Inc. (AVGO) and Skyworks Solutions, Inc. (SWKS) based on recent financial and strategic data.
| Criterion | Broadcom Inc. (AVGO) | Skyworks Solutions, Inc. (SWKS) |
|---|---|---|
| Diversification | Highly diversified with strong segments in Infrastructure Software ($27B) and Semiconductor Solutions ($37B) | Less diversified, primarily focused on semiconductor components |
| Profitability | Strong profitability: Net margin 36.2%, ROE 28.45%, ROIC 16.36% | Moderate profitability: Net margin 11.67%, ROE 8.29%, ROIC 6.35% |
| Innovation | Demonstrates durable competitive advantage with growing ROIC and strong innovation in software and semiconductor solutions | Declining ROIC trend, indicating challenges in sustaining innovation and profitability |
| Global presence | Extensive global reach supported by large revenue base and infrastructure | Global presence but smaller scale and less diversified products |
| Market Share | Large market share in both software infrastructure and semiconductor markets | Smaller market share, vulnerable to competitive pressures |
Key takeaways: Broadcom shows strong diversification, robust profitability, and a durable competitive moat with increasing returns on capital. In contrast, Skyworks faces challenges with declining profitability and less diversification, suggesting higher risk for investors.
Risk Analysis
Below is a comparison of key risks for Broadcom Inc. (AVGO) and Skyworks Solutions, Inc. (SWKS) based on the most recent data from 2025.
| Metric | Broadcom Inc. (AVGO) | Skyworks Solutions, Inc. (SWKS) |
|---|---|---|
| Market Risk | Beta 1.218, moderately volatile | Beta 1.297, slightly higher volatility |
| Debt level | Debt/Equity 0.8 (neutral), Debt/Assets 38.07% (moderate) | Debt/Equity 0.21 (low), Debt/Assets 15.2% (low) |
| Regulatory Risk | Moderate – operates globally with exposure to US-China trade tensions | Moderate – global operations, some exposure to geopolitical tensions |
| Operational Risk | Complex supply chain, large scale manufacturing | Smaller scale, diversified product portfolio |
| Environmental Risk | Moderate – semiconductor manufacturing has environmental impact | Moderate – semiconductor production with environmental regulations |
| Geopolitical Risk | Significant exposure due to global sales and supply chains | Moderate exposure, less diversified internationally |
Broadcom faces higher debt and geopolitical risks due to its size and global footprint, while Skyworks shows lower financial leverage and slightly higher market volatility. Geopolitical tensions remain the most impactful risk for both, affecting supply chains and market access.
Which Stock to Choose?
Broadcom Inc. (AVGO) shows strong income growth with a 23.87% revenue increase in 2025 and a favorable net margin of 36.2%. Its financial ratios are slightly favorable, highlighted by a 28.45% ROE and solid liquidity, while debt levels remain moderate. The company holds a very favorable rating and demonstrates a durable competitive advantage with a very favorable MOAT status.
Skyworks Solutions, Inc. (SWKS) faces challenges with declining income growth, showing a 2.18% revenue decrease in 2025 and an 11.67% net margin. Financial ratios appear slightly favorable overall, supported by strong liquidity and low debt, yet profitability metrics like ROE are less robust. It maintains a very favorable rating but exhibits a very unfavorable MOAT status due to declining ROIC.
Investors prioritizing growth and durable competitive advantage may find Broadcom’s financial strength and income growth more appealing, while those valuing balance sheet stability and moderate valuation might consider Skyworks, despite its weaker income trends. The choice could depend on the investor’s risk tolerance and strategy focus.
Disclaimer: Investment carries a risk of loss of initial capital. The past performance is not a reliable indicator of future results. Be sure to understand risks before making an investment decision.
Go Further
I encourage you to read the complete analyses of Broadcom Inc. and Skyworks Solutions, Inc. to enhance your investment decisions: