Home > Comparison > Technology > AVGO vs SLAB
The strategic rivalry between Broadcom Inc. and Silicon Laboratories Inc. shapes the semiconductor industry’s evolution. Broadcom operates as a capital-intensive technology giant with a diversified product portfolio spanning wired infrastructure and wireless communications. In contrast, Silicon Laboratories focuses on fabless, analog-intensive mixed-signal solutions for IoT applications. This analysis pits Broadcom’s scale and integration against Silicon Labs’ niche innovation to determine which offers superior risk-adjusted returns for a diversified portfolio.

Table of contents
Companies Overview
Broadcom Inc. and Silicon Laboratories Inc. hold pivotal roles in the semiconductor sector, shaping connectivity and IoT innovation.
Broadcom Inc.: Global Semiconductor and Infrastructure Leader
Broadcom dominates as a global technology company specializing in semiconductor and infrastructure software solutions. Its revenue stems from diverse segments including wired infrastructure, wireless communications, and enterprise storage. In 2026, Broadcom sharpens its strategic focus on expanding complex sub-systems integration and firmware development, reinforcing its competitive edge across data centers and industrial automation.
Silicon Laboratories Inc.: Fabless Mixed-Signal Innovator
Silicon Laboratories positions itself as a fabless semiconductor company delivering analog-intensive mixed-signal solutions. It generates revenue mainly through wireless microcontrollers and sensors aimed at IoT applications such as smart metering and industrial automation. In 2026, Silicon Labs prioritizes expanding its footprint in connected home and security markets, leveraging a direct sales network to capture growing IoT demand.
Strategic Collision: Similarities & Divergences
Broadcom and Silicon Labs share a commitment to semiconductor innovation but diverge on scale and ecosystem approach. Broadcom focuses on large-scale, integrated hardware-software solutions, whereas Silicon Labs emphasizes niche, fabless mixed-signal products for IoT. Their battleground lies in connectivity and automation markets. Broadcom offers broader diversification and scale, while Silicon Labs presents a specialized, growth-oriented profile.
Income Statement Comparison
This data dissects the core profitability and scalability of both corporate engines to reveal who dominates the bottom line:

| Metric | Broadcom Inc. (AVGO) | Silicon Laboratories Inc. (SLAB) |
|---|---|---|
| Revenue | 63.9B | 785M |
| Cost of Revenue | 20.6B | 328M |
| Operating Expenses | 17.8B | 528M |
| Gross Profit | 43.3B | 457M |
| EBITDA | 34.7B | -19M |
| EBIT | 25.9B | -57M |
| Interest Expense | 3.2B | 1M |
| Net Income | 23.1B | -65M |
| EPS | 4.91 | -1.98 |
| Fiscal Year | 2025 | 2025 |
Income Statement Analysis: The Bottom-Line Duel
This income statement comparison reveals which company runs a more efficient and profitable engine through recent financial performance.
Broadcom Inc. Analysis
Broadcom’s revenue surged from 27.5B in 2021 to 63.9B in 2025, demonstrating strong top-line momentum. Net income followed suit, rising sharply to 23.1B in 2025. Its gross margin holds steady at 67.8%, reflecting efficient production, while a robust net margin of 36.2% signals excellent bottom-line control and profitability.
Silicon Laboratories Inc. Analysis
Silicon Labs grew revenue moderately from 721M in 2021 to 785M in 2025, a steady but modest climb. However, net income deteriorated into losses by 2025, reaching -65M. Despite a healthy gross margin of 58.2%, negative EBIT and net margins (-7.3% and -8.3%) highlight ongoing operational challenges undermining profitability.
Margin Strength vs. Profitability Scale
Broadcom clearly dominates with superior revenue scale and consistent margin expansion, delivering strong profit growth. Silicon Labs shows revenue growth but struggles with persistent losses and weak margins. For investors prioritizing reliable profits and operational efficiency, Broadcom’s profile stands out as more attractive.
Financial Ratios Comparison
These vital ratios act as a diagnostic tool to expose the underlying fiscal health, valuation premiums, and capital efficiency of the companies compared below:
| Ratios | Broadcom Inc. (AVGO) | Silicon Laboratories Inc. (SLAB) |
|---|---|---|
| ROE | 28.4% | -5.9% |
| ROIC | 16.4% | -6.3% |
| P/E | 73.9 | -65.9 |
| P/B | 21.0 | 3.91 |
| Current Ratio | 1.71 | 4.69 |
| Quick Ratio | 1.58 | 4.02 |
| D/E | 0.80 | 0 |
| Debt-to-Assets | 38.1% | 0% |
| Interest Coverage | 7.9 | -72.3 |
| Asset Turnover | 0.37 | 0.62 |
| Fixed Asset Turnover | 25.3 | 6.10 |
| Payout ratio | 48.2% | 0% |
| Dividend yield | 0.65% | 0% |
| Fiscal Year | 2025 | 2025 |
Efficiency & Valuation Duel: The Vital Signs
Financial ratios act as a company’s DNA, unveiling hidden risks and operational strengths crucial for investors’ decisions.
Broadcom Inc.
Broadcom displays robust profitability with a 28.45% ROE and a strong 36.2% net margin, signaling operational excellence. However, its valuation appears stretched, with a P/E of 73.87 and a P/B of 21.01, suggesting high market expectations. Shareholders receive minimal dividends (0.65%), reflecting a reinvestment focus on R&D and growth.
Silicon Laboratories Inc.
Silicon Labs suffers from negative profitability metrics: a -5.93% ROE and -8.27% net margin, indicating ongoing losses. Its P/E ratio is negative but favorable due to losses, while the P/B ratio at 3.91 is moderate. The firm pays no dividend, channeling capital into heavy R&D (45% of revenue), aiming for future turnaround and innovation.
Premium Valuation vs. Operational Struggle
Broadcom balances high profitability with premium valuation, reflecting market confidence but elevated risk. Silicon Labs faces operational headwinds and negative returns but invests aggressively in R&D. Investors seeking stable returns and operational strength may favor Broadcom, while those targeting high-growth potential with tolerance for risk might consider Silicon Labs.
Which one offers the Superior Shareholder Reward?
Broadcom Inc. (AVGO) delivers a superior shareholder reward compared to Silicon Laboratories Inc. (SLAB). AVGO pays a modest but sustainable dividend with a 0.65% yield and a payout ratio of 48%, backed by strong free cash flow coverage near 98%. Its aggressive buyback program further enhances total returns. SLAB pays no dividend, focusing on reinvestment amid losses and negative margins. SLAB’s buybacks are negligible given financial strain. Historically in tech, consistent dividends plus buybacks fuel long-term value, making AVGO’s balanced distribution model more attractive for 2026 investors seeking durable total returns.
Comparative Score Analysis: The Strategic Profile
The radar chart reveals the fundamental DNA and trade-offs of Broadcom Inc. and Silicon Laboratories Inc., highlighting their core financial strengths and weaknesses:

Broadcom dominates in profitability with very favorable ROE and ROA scores of 5 each, signaling efficient asset and equity utilization. However, it carries significant financial risk with a low debt-to-equity score of 1 and valuation metrics also weak at 1. Silicon Laboratories lags across the board with uniformly low scores, showing no distinct competitive edge. Broadcom’s profile is more balanced, relying on operational strength but exposing investors to valuation and leverage concerns.
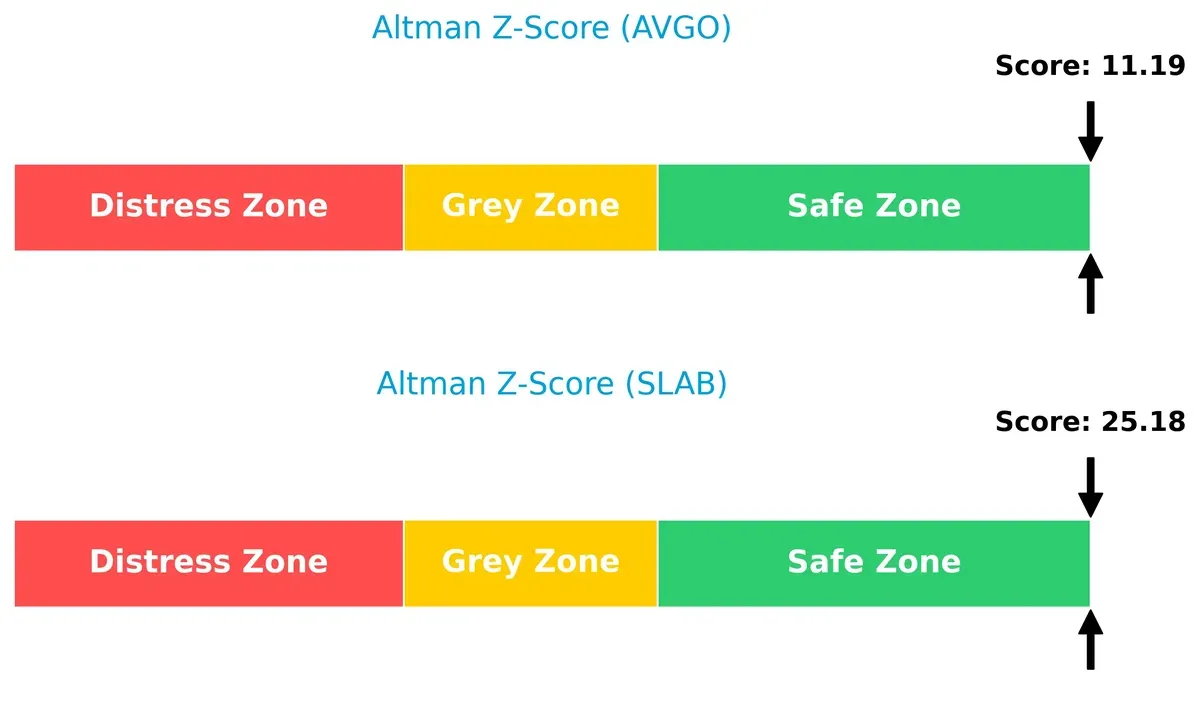
Bankruptcy Risk: Solvency Showdown
Broadcom’s Altman Z-Score of 11.19 versus Silicon Laboratories’ 25.18 signals both firms reside safely above distress thresholds, but Silicon Laboratories has an exceptionally stronger buffer for long-term survival in this cycle:
Financial Health: Quality of Operations
Broadcom’s Piotroski F-Score of 8 indicates peak financial health with robust internal metrics, while Silicon Laboratories’ score of 4 flags average operational quality and potential red flags in financial stability:

How are the two companies positioned?
This section dissects Broadcom and Silicon Laboratories’ operational DNA by comparing revenue distribution and internal strengths and weaknesses. The goal is to confront their economic moats to identify which model offers the most resilient, sustainable advantage today.
Revenue Segmentation: The Strategic Mix
This visual comparison dissects how Broadcom Inc. and Silicon Laboratories Inc. diversify their income streams and reveals where their primary sector bets lie:

Broadcom anchors its revenue heavily in Semiconductor Solutions, generating $36.9B in 2025, while Infrastructure Software adds $27B. This dual focus shows a balanced yet concentrated ecosystem lock-in. Silicon Laboratories relies almost exclusively on Industrial & Commercial segments, with $339M in 2024, signaling less diversification and higher concentration risk. Broadcom’s scale and diversification provide a defensive moat; Silicon Labs’ narrow base demands caution amid market shifts.
Strengths and Weaknesses Comparison
This table compares the Strengths and Weaknesses of Broadcom Inc. and Silicon Laboratories Inc.:
Broadcom Inc. Strengths
- Strong profitability with 36.2% net margin
- ROE of 28.45% indicates efficient capital use
- Diverse revenue from Infrastructure Software and Semiconductor Solutions
- Global presence across Americas, Asia Pacific, and EMEA
- Solid liquidity ratios: current ratio 1.71, quick ratio 1.58
- Favorable interest coverage at 8.08
Silicon Laboratories Inc. Strengths
- Favorable quick ratio at 4.02 indicates strong short-term liquidity
- Zero debt and debt-to-assets ratio improve financial stability
- Favorable fixed asset turnover at 6.1 reflects efficient use of assets
- Positive P/E metric contrasted with negative profitability suggests market expectations
- Diverse revenue sources within Industrial & Commercial and IoT segments
- Presence in key regions including China, Taiwan, and United States
Broadcom Inc. Weaknesses
- High P/E at 73.87 and PB at 21.01 may indicate overvaluation risk
- Unfavorable asset turnover at 0.37 signals lower asset efficiency
- Dividend yield low at 0.65%, less attractive for income investors
- Debt-to-equity and debt-to-assets ratios neutral but notable at 0.8 and 38%
Silicon Laboratories Inc. Weaknesses
- Negative net margin (-8.27%) and ROE (-5.93%) reveal profitability challenges
- Unfavorable WACC at 11.01% increases capital costs
- Negative interest coverage (-58.4) suggests difficulty meeting interest expenses
- Unfavorable current ratio at 4.69 may indicate excess current assets or misclassified liabilities
- Dividend yield is zero, providing no income return to shareholders
Broadcom demonstrates robust profitability and global diversification but faces valuation and asset efficiency concerns. Silicon Laboratories shows strong liquidity and financial conservatism but struggles with profitability and capital costs, highlighting strategic challenges ahead.
The Moat Duel: Analyzing Competitive Defensibility
A structural moat is the only true barrier protecting long-term profits from relentless competitive erosion. Let’s dissect two semiconductor players’ moats:
Broadcom Inc.: Cost Advantage Powerhouse
Broadcom’s moat stems from a dominant cost advantage and scale, delivering a strong 7% ROIC premium over WACC and 40%+ EBIT margins. Its diversified infrastructure and wireless segments deepen this moat into 2026.
Silicon Laboratories Inc.: Niche Innovation with Fragile Moat
Silicon Labs relies on specialized analog mixed-signal tech, offering niche IoT solutions. However, it suffers a steep negative ROIC versus WACC and declining profitability, signaling a fragile moat under pressure.
Verdict: Scale-Driven Cost Advantage vs. Niche Innovation Vulnerability
Broadcom’s wide, growing moat driven by scale and operational efficiency outmatches Silicon Labs’ shrinking, value-destructive position. Broadcom stands better equipped to protect and expand its market share.
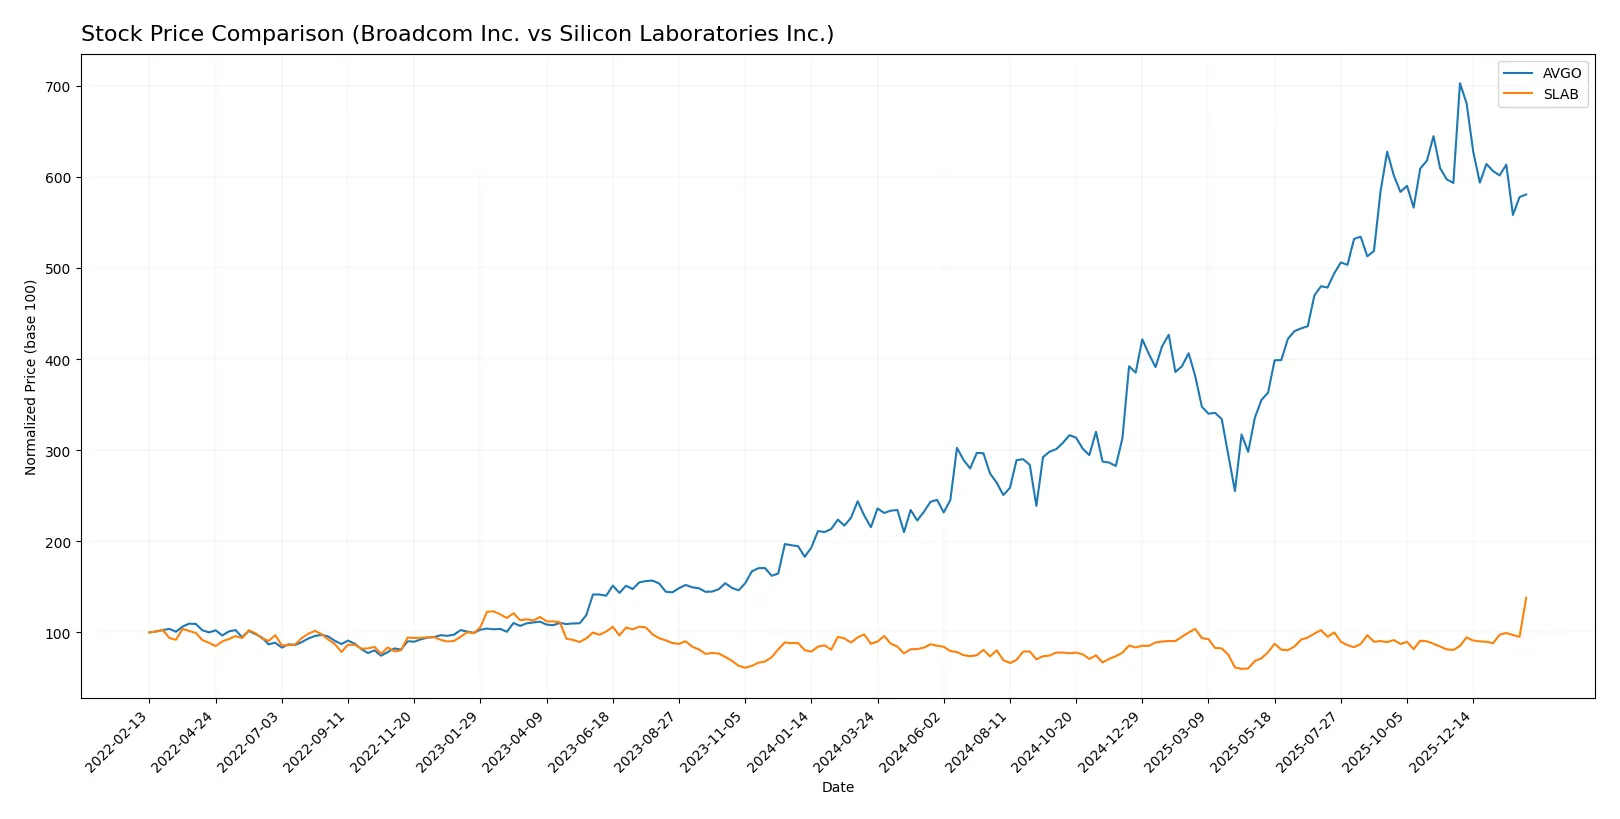
Which stock offers better returns?
The past year reveals contrasting price dynamics for Broadcom Inc. and Silicon Laboratories Inc., with Broadcom showing strong gains but recent weakness, and Silicon Labs accelerating upward momentum.
Trend Comparison
Broadcom Inc. posted a 169.46% price increase over the past 12 months, marking a bullish trend with decelerating gains and a high volatility of 79.04. Its recent 2.14% decline signals short-term weakness.
Silicon Laboratories Inc. gained 57.75% over the same period, maintaining a bullish trend with accelerating momentum and lower volatility at 16.2. Recent gains surged 70.77%, reflecting strong buyer dominance.
Broadcom delivered the highest overall returns, despite recent softness. Silicon Labs shows accelerating growth and stronger recent bullish sentiment in volume and price trends.
Target Prices
Analysts present a bullish target consensus for Broadcom Inc. and Silicon Laboratories Inc.
| Company | Target Low | Target High | Consensus |
|---|---|---|---|
| Broadcom Inc. | 370 | 510 | 450.12 |
| Silicon Laboratories Inc. | 160 | 231 | 211.6 |
The consensus targets for Broadcom and Silicon Labs stand significantly above current prices of $332.92 and $206.50 respectively, indicating expected upside potential.

Don’t Let Luck Decide Your Entry Point
Optimize your entry points with our advanced ProRealTime indicators. You’ll get efficient buy signals with precise price targets for maximum performance. Start outperforming now!
How do institutions grade them?
Broadcom Inc. Grades
The table below shows recent analyst grades for Broadcom Inc. from major institutions.
| Grading Company | Action | New Grade | Date |
|---|---|---|---|
| Wells Fargo | Upgrade | Overweight | 2026-01-15 |
| Mizuho | Maintain | Outperform | 2026-01-09 |
| Truist Securities | Maintain | Buy | 2025-12-19 |
| UBS | Maintain | Buy | 2025-12-15 |
| Rosenblatt | Maintain | Buy | 2025-12-12 |
| Morgan Stanley | Maintain | Overweight | 2025-12-12 |
| Barclays | Maintain | Overweight | 2025-12-12 |
| Bernstein | Maintain | Outperform | 2025-12-12 |
| Citigroup | Maintain | Buy | 2025-12-12 |
| Mizuho | Maintain | Outperform | 2025-12-12 |
Silicon Laboratories Inc. Grades
The table below shows recent analyst grades for Silicon Laboratories Inc. from major institutions.
| Grading Company | Action | New Grade | Date |
|---|---|---|---|
| Citigroup | Maintain | Neutral | 2026-02-06 |
| RBC Capital | Maintain | Sector Perform | 2026-02-05 |
| Keybanc | Downgrade | Sector Weight | 2026-02-04 |
| Benchmark | Downgrade | Hold | 2026-02-04 |
| Needham | Downgrade | Hold | 2026-02-04 |
| Susquehanna | Maintain | Neutral | 2025-08-06 |
| Morgan Stanley | Maintain | Equal Weight | 2025-08-06 |
| Barclays | Maintain | Equal Weight | 2025-08-05 |
| Susquehanna | Maintain | Neutral | 2025-07-22 |
| Stifel | Maintain | Buy | 2025-07-18 |
Which company has the best grades?
Broadcom Inc. holds consistently stronger grades, mostly Buy or Outperform, with recent upgrades. Silicon Laboratories shows more downgrades and Neutral ratings. Stronger grades generally suggest greater analyst confidence, influencing investor sentiment.
Risks specific to each company
The following categories identify the critical pressure points and systemic threats facing Broadcom Inc. and Silicon Laboratories Inc. in the 2026 market environment:
1. Market & Competition
Broadcom Inc.
- Dominates with diverse product portfolio in semiconductors and infrastructure software. Faces stiff competition in high-end sectors.
Silicon Laboratories Inc.
- Focuses on analog-intensive mixed-signal solutions for IoT; niche market but highly competitive and rapidly evolving.
2. Capital Structure & Debt
Broadcom Inc.
- Moderate leverage with debt-to-assets at 38%, interest coverage strong at 8.08x; manageable financial risk.
Silicon Laboratories Inc.
- No debt, zero leverage; strong liquidity but negative interest coverage due to losses signals operational stress.
3. Stock Volatility
Broadcom Inc.
- Beta of 1.22 indicates moderate volatility; relatively stable for a tech giant.
Silicon Laboratories Inc.
- Beta of 1.54 shows higher volatility; stock price more sensitive to market swings.
4. Regulatory & Legal
Broadcom Inc.
- Large multinational with exposure to global regulatory scrutiny; history of navigating complex compliance environments.
Silicon Laboratories Inc.
- Smaller scale, but growing international footprint increases regulatory risk, especially in China and IoT-specific standards.
5. Supply Chain & Operations
Broadcom Inc.
- Complex supply chain with multiple device types; historically resilient but vulnerable to semiconductor shortages.
Silicon Laboratories Inc.
- Fabless model reduces capital intensity but depends heavily on third-party foundries, increasing supply chain risks.
6. ESG & Climate Transition
Broadcom Inc.
- Increasingly integrating ESG into strategy; pressure to reduce carbon footprint across global operations.
Silicon Laboratories Inc.
- Emerging ESG initiatives; smaller size may limit resources but also agility in climate transition efforts.
7. Geopolitical Exposure
Broadcom Inc.
- Significant exposure to US-China tensions affecting supply chains and sales; diversified global presence mitigates some risks.
Silicon Laboratories Inc.
- Growing international sales including China; vulnerable to geopolitical shifts due to smaller scale and less diversification.
Which company shows a better risk-adjusted profile?
Broadcom’s most impactful risk lies in its exposure to intense market competition and geopolitical tensions, but its strong capital structure and diversified operations provide a buffer. Silicon Labs faces critical risks from continued operational losses and supply chain dependence. Broadcom’s superior financial health and lower volatility underpin a better risk-adjusted profile. Notably, Silicon Labs’ negative net margin and interest coverage ratios in 2025 highlight urgent profitability and liquidity challenges, intensifying its risk exposure.
Final Verdict: Which stock to choose?
Broadcom Inc. (AVGO) wields a formidable superpower in its ability to generate consistent, high returns on invested capital well above its cost of capital. This efficiency drives strong profitability and cash flow, making it a cash machine in the semiconductor space. The main point of vigilance lies in its elevated valuation multiples, which could temper near-term upside. AVGO suits aggressive growth portfolios seeking durable competitive advantages.
Silicon Laboratories Inc. (SLAB) offers a strategic moat rooted in its specialized technology niche and robust research investment. Its balance sheet appears safer with negligible debt, but the company is currently shedding value and posting losses, reflecting execution challenges. Relative to Broadcom, SLAB presents a higher-risk, higher-reward profile better aligned with GARP investors who can tolerate volatility for potential turnaround payoffs.
If you prioritize sustainable value creation and strong free cash flow generation, Broadcom outshines as the compelling choice due to its proven moat and financial discipline. However, if you seek asymmetric growth opportunities with a focus on innovation potential and can tolerate earnings volatility, Silicon Labs offers better stability in capital structure and a niche market position. Both represent distinct analytical scenarios for investors with different risk tolerances and time horizons.
Disclaimer: Investment carries a risk of loss of initial capital. The past performance is not a reliable indicator of future results. Be sure to understand risks before making an investment decision.
Go Further
I encourage you to read the complete analyses of Broadcom Inc. and Silicon Laboratories Inc. to enhance your investment decisions: