In the fast-evolving semiconductor industry, choosing the right company can significantly impact your investment portfolio. Broadcom Inc. (AVGO) and Qnity Electronics, Inc. (Q) both operate in this vital technology sector, yet differ in scale and innovation approach. Broadcom’s established global footprint contrasts with Qnity’s fresh market entry and specialized focus. This article will help you decide which company offers the most promising opportunity for your investment journey.
Table of contents
Companies Overview
I will begin the comparison between Broadcom Inc. and Qnity Electronics, Inc. by providing an overview of these two companies and their main differences.
Broadcom Inc. Overview
Broadcom Inc. is a global technology company headquartered in Palo Alto, California, specializing in semiconductor and infrastructure software solutions. The company serves diverse markets, including enterprise networking, telecommunications, and industrial automation, offering products ranging from discrete devices to complex subsystems. With 37,000 full-time employees, Broadcom is recognized for its extensive product portfolio and global market presence.
Qnity Electronics, Inc. Overview
Qnity Electronics, Inc., based in Wilmington, Delaware, focuses on electronic solutions and advanced materials for semiconductor chip manufacturing. Formerly known as Novus SpinCo 1, Inc. until April 2025, Qnity is a relatively new public company operating in the semiconductor industry. It targets niche markets within semiconductor materials, with a smaller scale compared to more established peers.
Key similarities and differences
Both companies operate within the semiconductor industry and serve technology markets in the United States. Broadcom has a broad product and market scope, including software and hardware solutions across multiple sectors, while Qnity concentrates on electronic materials for chip manufacturing. Broadcom’s large workforce and extensive operations contrast with Qnity’s smaller scale and more specialized focus.
Income Statement Comparison
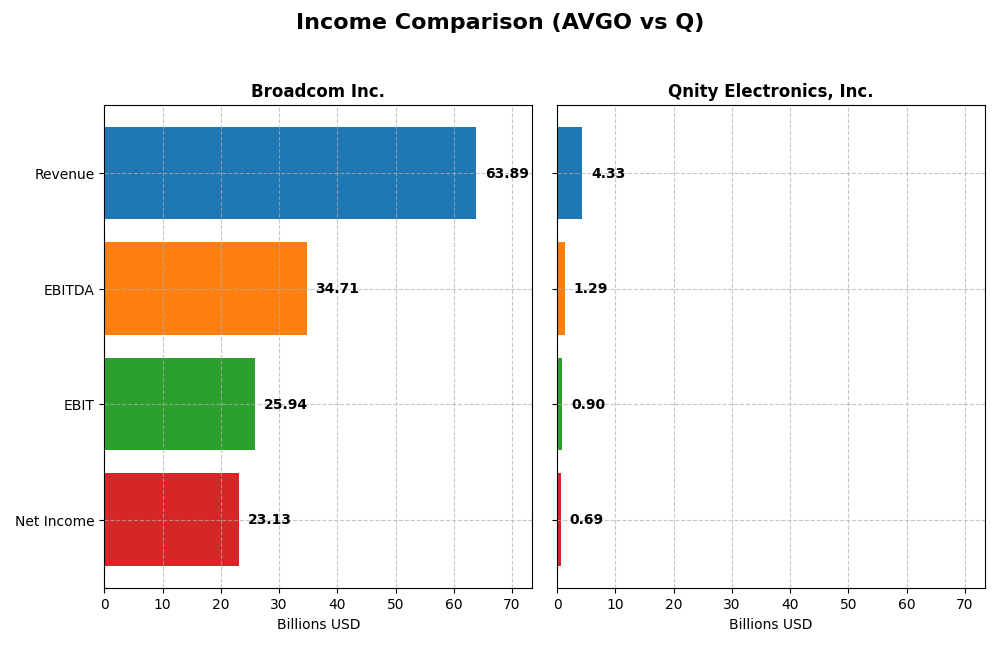
The table below compares key income statement metrics for Broadcom Inc. and Qnity Electronics, Inc. based on their most recent fiscal year data.
| Metric | Broadcom Inc. (AVGO) | Qnity Electronics, Inc. (Q) |
|---|---|---|
| Market Cap | 1.6T | 18.8B |
| Revenue | 63.9B | 4.3B |
| EBITDA | 34.7B | 1.3B |
| EBIT | 25.9B | 898M |
| Net Income | 23.1B | 693M |
| EPS | 4.91 | 3.31 |
| Fiscal Year | 2025 | 2024 |
Income Statement Interpretations
Broadcom Inc.
Broadcom Inc. has demonstrated strong revenue and net income growth from 2021 to 2025, with revenue rising from $27.45B to $63.89B and net income more than tripling to $23.13B. Margins improved notably, with a gross margin of 67.77% and net margin of 36.2% in 2025. The latest year saw exceptional growth in EBIT and EPS, reflecting enhanced profitability and operational efficiency.
Qnity Electronics, Inc.
Qnity Electronics showed mixed results between 2022 and 2024, with revenue declining by 8.83% over the period but increasing modestly by 7.43% in the latest year to $4.34B. Net income and margins, while positive and improving in 2024, remain lower than Broadcom’s, with a net margin of 15.99%. EBIT and EPS grew significantly last year, indicating some operational improvements despite overall revenue decline.
Which one has the stronger fundamentals?
Broadcom displays stronger fundamentals through substantial and consistent revenue and net income growth, superior margins, and a high percentage of favorable income statement metrics. In contrast, Qnity Electronics faces challenges with declining long-term revenue and net income, although recent margin improvements and earnings growth are positive. Broadcom’s robust profitability and growth metrics suggest a firmer financial footing.
Financial Ratios Comparison
The following table presents a side-by-side comparison of key financial ratios for Broadcom Inc. (AVGO) and Qnity Electronics, Inc. (Q) based on the most recent fiscal year data available.
| Ratios | Broadcom Inc. (AVGO) 2025 | Qnity Electronics, Inc. (Q) 2024 |
|---|---|---|
| ROE | 28.4% | 6.51% |
| ROIC | 16.4% | 5.92% |
| P/E | 73.9 | 28.8 |
| P/B | 21.0 | 1.88 |
| Current Ratio | 1.71 | 1.77 |
| Quick Ratio | 1.58 | 1.06 |
| D/E (Debt to Equity) | 0.80 | 0.018 |
| Debt-to-Assets | 38.1% | 1.56% |
| Interest Coverage | 7.94 | 3.03 |
| Asset Turnover | 0.37 | 0.35 |
| Fixed Asset Turnover | 25.3 | 2.59 |
| Payout Ratio | 48.2% | 0% |
| Dividend Yield | 0.65% | 0% |
Interpretation of the Ratios
Broadcom Inc.
Broadcom exhibits strong profitability ratios with a 36.2% net margin and 28.45% return on equity, signaling efficient earnings generation. However, valuation ratios like a high PE of 73.87 and PB of 21.01 appear stretched, posing potential concerns. The 0.65% dividend yield is modest, supported by a sustainable payout covered by free cash flow, though low yield may disappoint some investors.
Qnity Electronics, Inc.
Qnity’s ratios indicate moderate profitability with a 15.99% net margin but a weak 6.51% return on equity, suggesting less efficient capital use. Valuation metrics show a reasonable PB of 1.88 but a PE of 28.8, which may be elevated relative to its profitability. The company does not pay dividends, likely prioritizing reinvestment and growth, consistent with its recent IPO and smaller size.
Which one has the best ratios?
Broadcom displays stronger profitability and liquidity ratios, though at a higher valuation, while Qnity shows moderate profitability and more conservative leverage but weaker returns on equity. Both have a slightly favorable overall ratio profile, but Broadcom’s higher margins and returns contrast with Qnity’s growth-oriented, no-dividend approach.
Strategic Positioning
This section compares the strategic positioning of Broadcom Inc. and Qnity Electronics, Inc., including market position, key segments, and exposure to technological disruption:
Broadcom Inc.
- Leading semiconductor company with significant market cap and competitive pressure on NASDAQ.
- Operates diversified segments: Infrastructure Software and Semiconductor Solutions driving revenue.
- Exposure through complex semiconductor and software products requiring ongoing innovation.
Qnity Electronics, Inc.
- Smaller market cap semiconductor firm listed on NYSE with less competitive pressure.
- Focuses on electronic solutions and materials for semiconductor chip manufacturing.
- Exposure limited to advanced electronic materials, specifics of disruption unclear.
Broadcom Inc. vs Qnity Electronics, Inc. Positioning
Broadcom’s diversified business model spans software and semiconductors, providing multiple revenue streams. Qnity maintains a concentrated focus on electronic materials. Broadcom’s scale offers broader market reach, while Qnity’s narrower segment may limit risk diversification.
Which has the best competitive advantage?
Broadcom exhibits a very favorable moat with growing ROIC above WACC, indicating durable competitive advantage. Qnity shows neutral moat status with stable but low profitability, reflecting limited competitive edge currently.
Stock Comparison
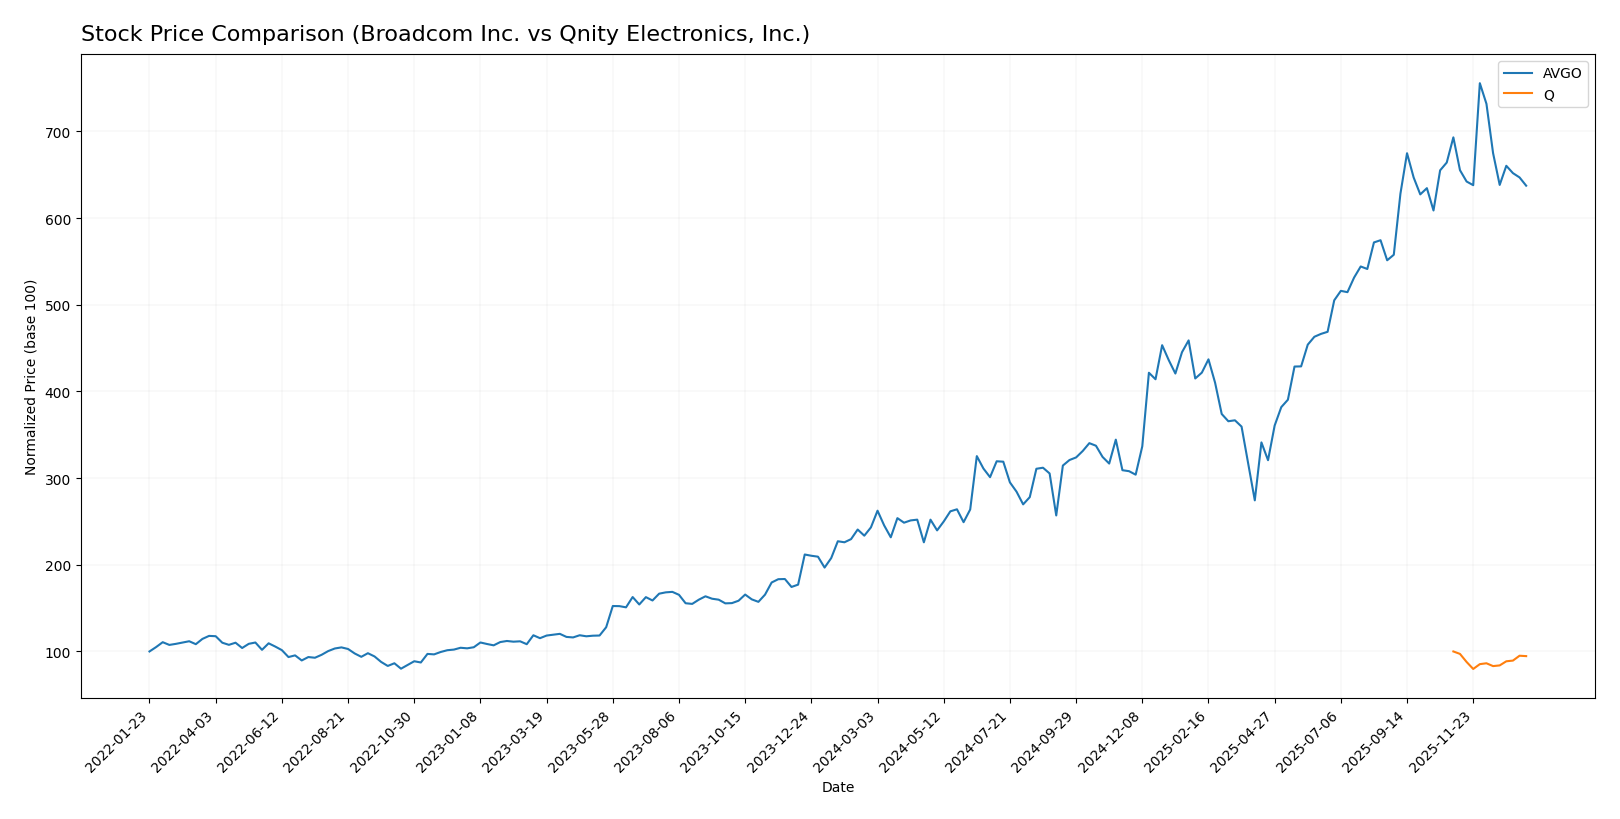
The stock prices of Broadcom Inc. (AVGO) and Qnity Electronics, Inc. (Q) have exhibited contrasting movements over the past 12 months, with AVGO showing strong gains despite recent declines, while Q has experienced a persistent downturn.
Trend Analysis
Broadcom Inc. (AVGO) demonstrated a robust bullish trend over the past year, with a 162.18% price increase, though the trend shows deceleration and recent short-term weakness of -8.05%. Volatility remains high with a standard deviation of 78.56.
Qnity Electronics, Inc. (Q) experienced a bearish trend over the same period, with a -5.39% price change and stable acceleration. Recent performance continues to be negative with low volatility, reflected by a standard deviation of 5.64.
Comparatively, Broadcom’s stock delivered the highest market performance with a significant positive price change, outperforming Qnity’s declining trend over the 12-month span.
Target Prices
The target price consensus for Broadcom Inc. and Qnity Electronics, Inc. reflects analyst optimism with notable upside potential.
| Company | Target High | Target Low | Consensus |
|---|---|---|---|
| Broadcom Inc. | 510 | 370 | 454.8 |
| Qnity Electronics, Inc. | 117 | 92 | 105.89 |
Analysts expect Broadcom’s shares to rise significantly from the current $339.89, while Qnity Electronics shows a similarly positive outlook above its $89.88 price, indicating potential growth for both stocks.
Analyst Opinions Comparison
This section compares analysts’ ratings and grades for Broadcom Inc. and Qnity Electronics, Inc.:
Rating Comparison
Broadcom Inc. Rating
- Rating: B, classified as Very Favorable overall evaluation by analysts.
- Discounted Cash Flow Score: Moderate at 3, indicating balanced valuation assessment.
- ROE Score: Very Favorable at 5, showing excellent profit generation from equity.
- ROA Score: Very Favorable at 5, reflecting strong asset utilization for earnings.
- Debt To Equity Score: Very Unfavorable at 1, implying higher financial risk.
- Overall Score: Moderate at 3, summarizing a balanced financial standing.
Qnity Electronics, Inc. Rating
- Rating: B+, also classified as Very Favorable overall evaluation by analysts.
- Discounted Cash Flow Score: Favorable at 4, suggesting a better undervaluation outlook.
- ROE Score: Moderate at 3, indicating average efficiency in generating equity returns.
- ROA Score: Favorable at 4, indicating good use of assets to generate earnings.
- Debt To Equity Score: Moderate at 3, suggesting more balanced financial leverage.
- Overall Score: Moderate at 3, representing a similar overall financial assessment.
Which one is the best rated?
Qnity Electronics, Inc. holds a slightly better rating (B+) and shows more favorable scores in discounted cash flow, ROA, and debt-to-equity metrics. Broadcom Inc. excels in ROE and ROA but has a higher financial risk due to debt levels. Overall, Qnity Electronics appears better rated based on these metrics.
Scores Comparison
Here is a comparison of the financial scores for Broadcom Inc. and Qnity Electronics, Inc.:
Broadcom Inc. Scores
- Altman Z-Score: 12.13, indicating a safe zone, low bankruptcy risk.
- Piotroski Score: 8, classified as very strong financial health.
Qnity Electronics, Inc. Scores
- Data not available for Qnity Electronics, Inc.
- Data not available for Qnity Electronics, Inc.
Which company has the best scores?
Based on the available data, Broadcom Inc. demonstrates strong financial health with a high Altman Z-Score in the safe zone and a very strong Piotroski Score. No scores are available for Qnity Electronics, Inc. for comparison.
Grades Comparison
Here is a comparison of the latest available grades from reputable grading companies for both Broadcom Inc. and Qnity Electronics, Inc.:
Broadcom Inc. Grades
The following table summarizes recent grades assigned to Broadcom Inc. by established grading firms.
| Grading Company | Action | New Grade | Date |
|---|---|---|---|
| Mizuho | Maintain | Outperform | 2026-01-09 |
| Truist Securities | Maintain | Buy | 2025-12-19 |
| UBS | Maintain | Buy | 2025-12-15 |
| Benchmark | Maintain | Buy | 2025-12-12 |
| Rosenblatt | Maintain | Buy | 2025-12-12 |
| Piper Sandler | Maintain | Overweight | 2025-12-12 |
| TD Cowen | Maintain | Buy | 2025-12-12 |
| B of A Securities | Maintain | Buy | 2025-12-12 |
| JP Morgan | Maintain | Overweight | 2025-12-12 |
| Mizuho | Maintain | Outperform | 2025-12-12 |
Broadcom Inc. consistently receives buy-oriented grades, showing strong analyst confidence and stable positive outlook.
Qnity Electronics, Inc. Grades
Below is a summary of recent grades for Qnity Electronics, Inc. from recognized grading companies.
| Grading Company | Action | New Grade | Date |
|---|---|---|---|
| RBC Capital | Maintain | Outperform | 2025-11-25 |
| Mizuho | Maintain | Outperform | 2025-11-20 |
Qnity Electronics has received a limited number of grades, both maintaining an outperform rating, indicating favorable but less frequently reviewed sentiment.
Which company has the best grades?
Broadcom Inc. has received more numerous and consistent buy and outperform grades compared to Qnity Electronics, which has fewer but positive ratings. This breadth of positive analyst support for Broadcom may reflect stronger market confidence and liquidity for investors.
Strengths and Weaknesses
Below is a comparison table highlighting key strengths and weaknesses of Broadcom Inc. (AVGO) and Qnity Electronics, Inc. (Q) based on recent financial and strategic data:
| Criterion | Broadcom Inc. (AVGO) | Qnity Electronics, Inc. (Q) |
|---|---|---|
| Diversification | Strong diversification between Infrastructure Software ($27B) and Semiconductor Solutions ($37B) segments | Limited diversification, focused on a narrower product range |
| Profitability | High net margin (36.2%), ROIC (16.36%), and ROE (28.45%) indicating strong profitability | Moderate net margin (16.0%), low ROE (6.5%), ROIC neutral (5.9%) |
| Innovation | Very favorable economic moat with growing ROIC and durable competitive advantage | Neutral moat status, no clear competitive advantage or growth in ROIC |
| Global presence | Extensive global operations with strong market penetration | Smaller scale with limited global footprint |
| Market Share | Large market share in semiconductor and software infrastructure markets | Smaller market share, less influence on industry dynamics |
Key takeaways: Broadcom demonstrates strong profitability, diversification, and a durable competitive moat, making it a more stable long-term investment. Qnity Electronics shows moderate financial health but lacks significant competitive advantages and global scale, suggesting higher risk and slower growth potential.
Risk Analysis
Below is a comparative table of key risks for Broadcom Inc. (AVGO) and Qnity Electronics, Inc. (Q) based on the most recent data available.
| Metric | Broadcom Inc. (AVGO) | Qnity Electronics, Inc. (Q) |
|---|---|---|
| Market Risk | High beta (1.218) indicates elevated volatility | Beta not available, likely lower volatility |
| Debt level | Moderate debt-to-equity (0.8), debt-to-assets 38% (neutral risk) | Very low debt-to-equity (0.02), minimal financial risk |
| Regulatory Risk | Moderate, due to global tech regulations and US base | Emerging company, regulatory environment less tested |
| Operational Risk | Diverse product segments with complex supply chains | New player, potential operational inefficiencies |
| Environmental Risk | Exposure to semiconductor manufacturing environmental standards | Limited data, potential emerging compliance risks |
| Geopolitical Risk | High exposure due to global supply chains | Lower exposure, smaller scale and regional focus |
Broadcom’s market risk is elevated given its beta over 1.2, indicating sensitivity to market swings. Its moderate debt levels and complex operations add financial and operational risks, while geopolitical tensions in the semiconductor sector could impact supply chains. Qnity benefits from very low leverage and a simpler profile but faces typical startup risks including operational execution and regulatory uncertainties. Investors should weigh Broadcom’s scale and strong financials against its market volatility and geopolitical sensitivity, while Qnity presents a potentially lower-risk debt profile but higher uncertainty due to its nascent stage.
Which Stock to Choose?
Broadcom Inc. (AVGO) shows strong income growth with a 23.87% revenue increase in 2025, favorable profitability metrics including a 36.2% net margin, and a solid return on equity of 28.45%. Its debt levels are moderate with a net debt to EBITDA of 1.41, and its overall financial ratios are slightly favorable. The company holds a very favorable rating, supported by a very strong Piotroski score and a safe Altman Z-Score, indicating robust financial health.
Qnity Electronics, Inc. (Q) demonstrates moderate income growth with a 7.43% revenue increase in 2024 and a favorable net margin of 15.99%. Its return on equity is lower at 6.51%, and it maintains very low debt with a net debt to EBITDA of 0.02. Financial ratios for Q are slightly favorable, and it carries a very favorable rating, though with more moderate returns and stability compared to AVGO.
Given the very favorable rating and strong income statement growth of Broadcom, it might be more prudent for growth-oriented investors to consider AVGO as it appears to have a durable competitive advantage. Conversely, risk-averse investors or those valuing financial stability and lower leverage could find Q’s profile more aligned with their preferences, reflecting stability and conservative debt levels.
Disclaimer: Investment carries a risk of loss of initial capital. The past performance is not a reliable indicator of future results. Be sure to understand risks before making an investment decision.
Go Further
I encourage you to read the complete analyses of Broadcom Inc. and Qnity Electronics, Inc. to enhance your investment decisions: