In the dynamic semiconductor industry, Broadcom Inc. (AVGO) and Onto Innovation Inc. (ONTO) stand out for their innovative approaches and market presence. Broadcom offers a broad portfolio of semiconductor and infrastructure software solutions, while Onto Innovation specializes in advanced process control tools and metrology systems. This comparison highlights their strategic differences and growth potential, helping you identify which company aligns best with your investment goals.

Table of contents
Companies Overview
I will begin the comparison between Broadcom Inc. and Onto Innovation Inc. by providing an overview of these two companies and their main differences.
Broadcom Inc. Overview
Broadcom Inc. is a global technology leader specializing in semiconductor and infrastructure software solutions. Headquartered in Palo Alto, California, the company operates through four segments: Wired Infrastructure, Wireless Communications, Enterprise Storage, and Industrial & Other. Its product range serves diverse markets including data centers, telecommunications, smartphones, and industrial automation, employing about 37,000 people worldwide.
Onto Innovation Inc. Overview
Onto Innovation Inc. designs and manufactures process control tools for semiconductor and advanced packaging device manufacturers. Based in Wilmington, Massachusetts, it offers macro defect inspection, optical metrology, lithography systems, and process control software. The company supports various industrial applications and employs roughly 1,550 people, focusing on yield management and device packaging solutions.
Key similarities and differences
Both companies operate in the semiconductor industry and provide advanced technology products critical to chip manufacturing and related markets. Broadcom is significantly larger with a broader product portfolio and global scale, while Onto Innovation focuses on specialized process control tools and software. Broadcom’s diversified business model contrasts with Onto’s niche focus on inspection and metrology solutions.
Income Statement Comparison
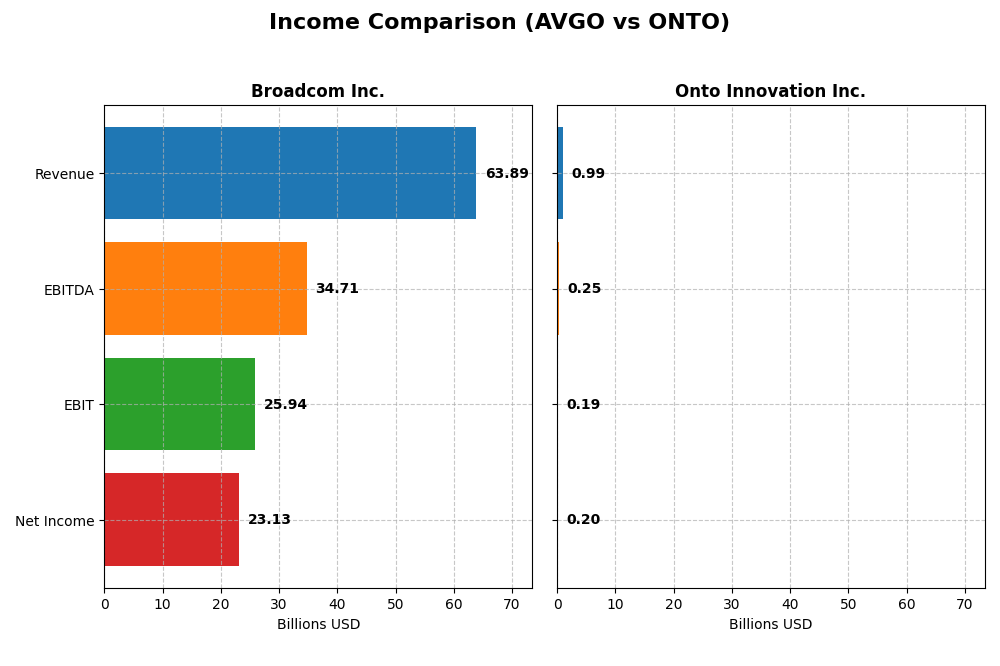
Below is a comparative overview of the most recent fiscal year income statement metrics for Broadcom Inc. and Onto Innovation Inc., illustrating key financial figures.
| Metric | Broadcom Inc. (AVGO) | Onto Innovation Inc. (ONTO) |
|---|---|---|
| Market Cap | 1.6T | 9.9B |
| Revenue | 63.9B | 987M |
| EBITDA | 34.7B | 249M |
| EBIT | 25.9B | 187M |
| Net Income | 23.1B | 202M |
| EPS | 4.91 | 4.09 |
| Fiscal Year | 2025 | 2024 |
Income Statement Interpretations
Broadcom Inc.
Broadcom Inc. showed strong revenue growth from $27.45B in 2021 to $63.89B in 2025, with net income rising significantly from $6.44B to $23.13B over the same period. Margins improved notably, with gross margin at 67.77% and net margin reaching 36.2% in 2025. The most recent year saw a favorable 23.87% revenue growth and a sharp net margin increase of 216.69%, indicating robust profitability expansion.
Onto Innovation Inc.
Onto Innovation’s revenue increased from $557M in 2020 to nearly $987M in 2024, while net income rose impressively from $31M to $202M. Margins also improved, with a 52.19% gross margin and 20.43% net margin in 2024. The latest year reflected a healthy 21.01% revenue growth and a net margin growth of 37.55%, suggesting consistent operational leverage and earnings improvement.
Which one has the stronger fundamentals?
Both companies demonstrate favorable income statement trends with improving revenues and margins. Broadcom’s scale and higher margins, alongside substantial net income growth, reflect stronger profitability and operational efficiency. Onto Innovation exhibits remarkable net income growth percentages but on a smaller scale. Broadcom’s fundamentals appear stronger due to its size, margin levels, and sustained earnings expansion.
Financial Ratios Comparison
The table below presents a side-by-side comparison of key financial ratios for Broadcom Inc. (AVGO) and Onto Innovation Inc. (ONTO) based on their most recent fiscal year data.
| Ratios | Broadcom Inc. (AVGO) 2025 | Onto Innovation Inc. (ONTO) 2024 |
|---|---|---|
| ROE | 28.4% | 10.5% |
| ROIC | 16.4% | 8.8% |
| P/E | 73.9 | 41.8 |
| P/B | 21.0 | 4.37 |
| Current Ratio | 1.71 | 8.69 |
| Quick Ratio | 1.58 | 7.00 |
| D/E (Debt-to-Equity) | 0.80 | 0.008 |
| Debt-to-Assets | 38.1% | 0.7% |
| Interest Coverage | 7.94 | 0 |
| Asset Turnover | 0.37 | 0.47 |
| Fixed Asset Turnover | 25.3 | 7.16 |
| Payout ratio | 48.2% | 0% |
| Dividend yield | 0.65% | 0% |
Interpretation of the Ratios
Broadcom Inc.
Broadcom shows strong profitability with a net margin of 36.2% and a return on equity of 28.45%, indicating efficient capital use. However, valuation ratios like P/E of 73.87 and P/B of 21.01 raise concerns about overvaluation. The current and quick ratios suggest solid liquidity, while debt metrics are moderate. Dividend yield is low at 0.65%, reflecting a cautious payout approach supported by free cash flow.
Onto Innovation Inc.
Onto Innovation presents a favorable net margin of 20.43% but only neutral returns on equity and invested capital around 10.5% and 8.8%, respectively. The company’s high current ratio of 8.69 contrasts with a weak P/E of 41.76 and P/B of 4.37, implying possible inefficiencies or market skepticism. Onto does not pay dividends, likely prioritizing reinvestment and growth, supported by negligible debt and strong interest coverage.
Which one has the best ratios?
Broadcom’s ratios are slightly more favorable overall, combining strong profitability and liquidity despite high valuation multiples and modest dividend yield. Onto Innovation shows mixed results with some strengths in liquidity and low leverage, but weaker profitability metrics and no dividend payout. The balance of favorable and unfavorable ratios suggests Broadcom holds a marginal advantage in financial health.
Strategic Positioning
This section compares the strategic positioning of Broadcom Inc. and Onto Innovation Inc., including market position, key segments, and exposure to technological disruption:
Broadcom Inc.
- Market leader with strong competitive pressure in semiconductors and infrastructure software.
- Diverse segments: Wired Infrastructure, Wireless Communications, Enterprise Storage, Industrial & Other.
- Moderate exposure due to broad product range including firmware and hardware interfacing sensors.
Onto Innovation Inc.
- Smaller player facing competitive pressure in specialized semiconductor process control tools.
- Focused on process control tools, optical metrology, lithography, and analytical software.
- Exposure tied to advanced packaging, inspection technologies with specialized process control software.
Broadcom Inc. vs Onto Innovation Inc. Positioning
Broadcom operates a diversified portfolio across semiconductor and software segments, supporting scale and resilience. Onto Innovation concentrates on niche process control technologies, which can limit market breadth but enables focused expertise in specialized areas.
Which has the best competitive advantage?
Broadcom demonstrates a very favorable moat with consistent value creation and growing profitability. Onto Innovation shows slightly unfavorable moat status, currently shedding value despite improving profitability trends.
Stock Comparison
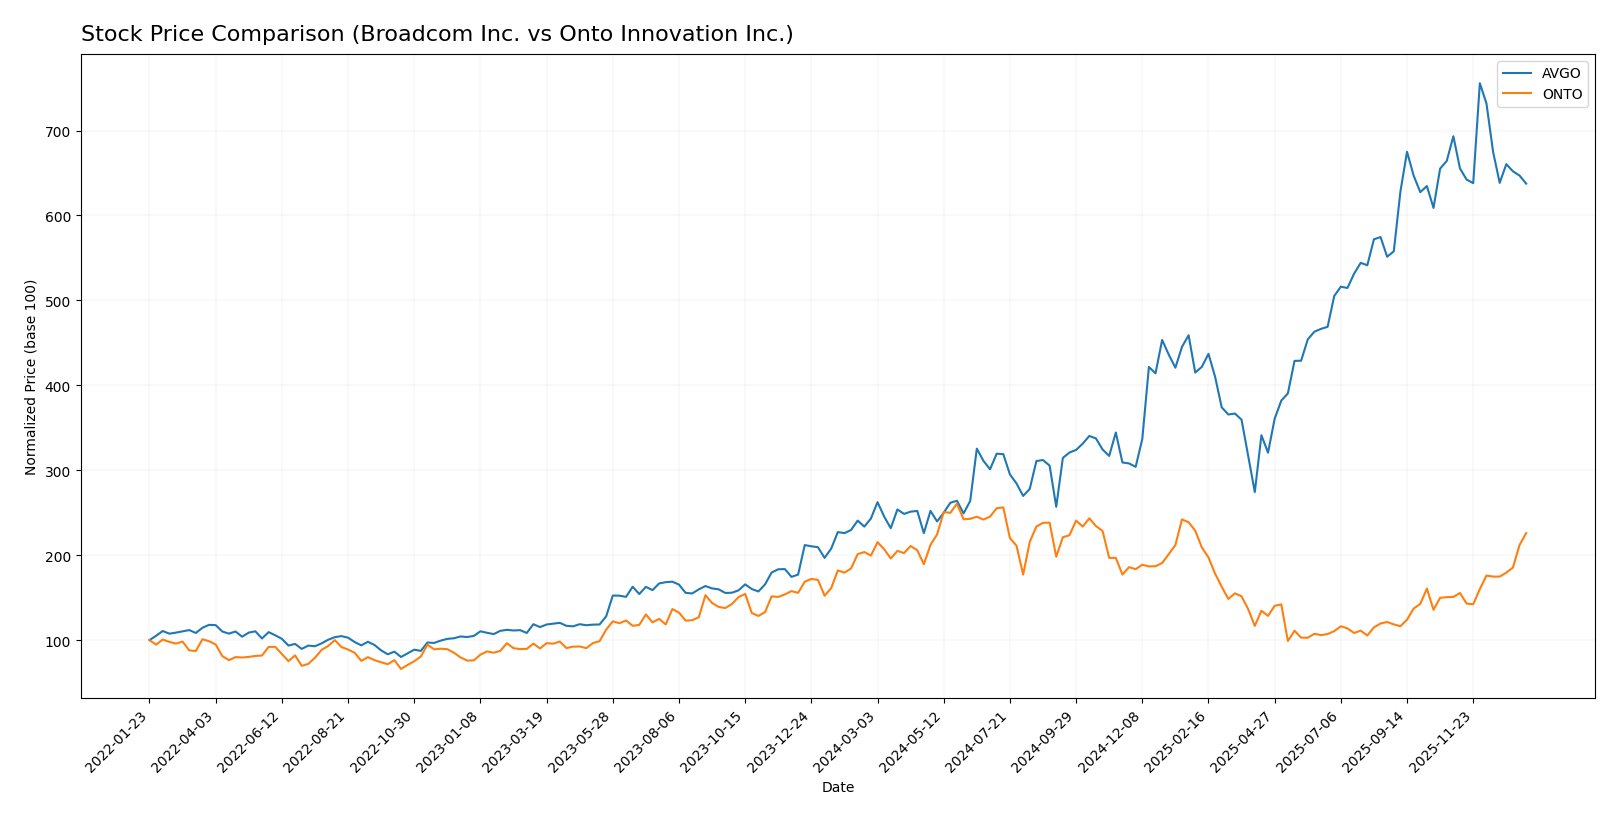
The stock price movements of Broadcom Inc. (AVGO) and Onto Innovation Inc. (ONTO) over the past year reveal contrasting trends, with AVGO experiencing a strong but decelerating bullish run and ONTO showing steady acceleration in gains.
Trend Analysis
Broadcom Inc. (AVGO) recorded a 162.18% price increase over the past year, reflecting a bullish trend with deceleration. The stock hit a high of 402.96 and a low of 120.47, showing significant volatility (std deviation 78.56). Recent months, however, show a slight bearish correction of -8.05%.
Onto Innovation Inc. (ONTO) posted a 13.31% gain over the same period, indicating a bullish trend with acceleration. The stock fluctuated between 88.5 and 233.14, with a moderate volatility (std deviation 42.43). Recent performance improved sharply by 49.83%, confirming strong upward momentum.
Comparing both, AVGO delivered the highest overall market performance in the past year despite recent pullbacks, while ONTO’s accelerating trend signals growing investor interest and momentum in the short term.
Target Prices
Analysts present a clear target price consensus for Broadcom Inc. and Onto Innovation Inc.
| Company | Target High | Target Low | Consensus |
|---|---|---|---|
| Broadcom Inc. | 510 | 370 | 454.8 |
| Onto Innovation Inc. | 200 | 160 | 178 |
The target consensus for Broadcom Inc. at 454.8 is significantly above its current price of 339.89, indicating expected upside. Onto Innovation Inc. shows a consensus target of 178, slightly below its current price of 202.21, suggesting a more cautious outlook from analysts.
Analyst Opinions Comparison
This section compares analysts’ ratings and grades for Broadcom Inc. and Onto Innovation Inc.:
Rating Comparison
Broadcom Inc. Rating
- Rating: B, considered very favorable overall.
- Discounted Cash Flow Score: 3, moderate status.
- ROE Score: 5, very favorable indicating strong profitability.
- ROA Score: 5, very favorable showing excellent asset use.
- Debt To Equity Score: 1, very unfavorable indicating higher financial risk.
- Overall Score: 3, moderate overall financial standing.
Onto Innovation Inc. Rating
- Rating: B+, also very favorable overall.
- Discounted Cash Flow Score: 3, moderate status.
- ROE Score: 3, moderate profitability.
- ROA Score: 4, favorable asset utilization.
- Debt To Equity Score: 4, favorable lower financial risk.
- Overall Score: 3, moderate overall financial standing.
Which one is the best rated?
Onto Innovation holds a slightly better rating grade at B+ versus Broadcom’s B. While both have moderate overall scores and DCF scores, Broadcom excels in profitability metrics, but Onto Innovation shows stronger financial stability with a better debt-to-equity score.
Scores Comparison
Here is a comparison of the Altman Z-Score and Piotroski Score for Broadcom Inc. and Onto Innovation Inc.:
Broadcom Inc. Scores
- Altman Z-Score: 12.13, indicating a safe zone with low bankruptcy risk.
- Piotroski Score: 8, classified as very strong financial health.
Onto Innovation Inc. Scores
- Altman Z-Score: 34.16, indicating a safe zone with very low bankruptcy risk.
- Piotroski Score: 4, classified as average financial health.
Which company has the best scores?
Onto Innovation has a higher Altman Z-Score, indicating lower bankruptcy risk, while Broadcom shows a significantly stronger Piotroski Score. Each company excels in different financial strength metrics.
Grades Comparison
The grades comparison for Broadcom Inc. and Onto Innovation Inc. by recognized grading firms is as follows:
Broadcom Inc. Grades
The table below details recent analyst grades and actions from reputable firms for Broadcom Inc.:
| Grading Company | Action | New Grade | Date |
|---|---|---|---|
| Mizuho | maintain | Outperform | 2026-01-09 |
| Truist Securities | maintain | Buy | 2025-12-19 |
| UBS | maintain | Buy | 2025-12-15 |
| Benchmark | maintain | Buy | 2025-12-12 |
| Rosenblatt | maintain | Buy | 2025-12-12 |
| Piper Sandler | maintain | Overweight | 2025-12-12 |
| TD Cowen | maintain | Buy | 2025-12-12 |
| B of A Securities | maintain | Buy | 2025-12-12 |
| JP Morgan | maintain | Overweight | 2025-12-12 |
| Mizuho | maintain | Outperform | 2025-12-12 |
Broadcom Inc. maintains a consistent Buy or Outperform consensus from multiple firms, indicating broad analyst confidence without recent downgrades.
Onto Innovation Inc. Grades
The table below shows recent analyst grades and actions from recognized firms for Onto Innovation Inc.:
| Grading Company | Action | New Grade | Date |
|---|---|---|---|
| Needham | maintain | Buy | 2026-01-06 |
| Jefferies | maintain | Buy | 2025-12-15 |
| Needham | maintain | Buy | 2025-11-18 |
| B. Riley Securities | maintain | Buy | 2025-11-18 |
| Evercore ISI Group | maintain | Outperform | 2025-11-05 |
| Oppenheimer | maintain | Outperform | 2025-10-14 |
| Stifel | maintain | Hold | 2025-10-13 |
| B. Riley Securities | maintain | Buy | 2025-10-10 |
| Jefferies | upgrade | Buy | 2025-09-23 |
| Benchmark | maintain | Buy | 2025-08-08 |
Onto Innovation Inc. shows a majority Buy and Outperform consensus, with one Hold rating, reflecting mostly positive analyst sentiment with minor caution.
Which company has the best grades?
Both companies hold predominantly Buy and Outperform ratings, but Broadcom Inc. shows a higher volume of consistent Buy and Outperform grades from a wider range of firms. This suggests stronger analyst conviction, which could influence investor confidence and portfolio decisions. Onto Innovation’s ratings are positive but slightly less uniform, implying moderate variability in analyst outlooks.
Strengths and Weaknesses
Below is a comparative overview of Broadcom Inc. (AVGO) and Onto Innovation Inc. (ONTO) highlighting their main strengths and weaknesses based on recent financial and strategic data.
| Criterion | Broadcom Inc. (AVGO) | Onto Innovation Inc. (ONTO) |
|---|---|---|
| Diversification | Strong diversification across Infrastructure Software ($27B) and Semiconductor Solutions ($36.9B) | Moderate diversification with Systems & Software ($850M), Parts ($77M), and Services ($60M) |
| Profitability | High net margin (36.2%), ROIC at 16.36%, ROE 28.45% | Moderate net margin (20.4%), ROIC 8.77%, ROE 10.47% |
| Innovation | Leading in semiconductor solutions with durable moat, growing ROIC (34%) | Improving profitability with growing ROIC but currently shedding value |
| Global presence | Very strong global presence with large market segments | Smaller scale, more niche market presence |
| Market Share | Large market share in semiconductor and software sectors | Smaller market share, focused on innovation systems |
Broadcom exhibits robust financial health and diversification, supporting its durable competitive advantage and consistent value creation. Onto Innovation shows promising growth in profitability but remains less diversified and currently value-destructive, indicating higher risk.
Risk Analysis
Below is a comparative risk assessment for Broadcom Inc. (AVGO) and Onto Innovation Inc. (ONTO) based on the most recent financial data and market conditions in 2026.
| Metric | Broadcom Inc. (AVGO) | Onto Innovation Inc. (ONTO) |
|---|---|---|
| Market Risk | Moderate (Beta 1.218; large cap tech sector exposure) | Higher (Beta 1.461; smaller cap, more volatile) |
| Debt Level | Moderate (Debt/Equity 0.8; interest coverage 8.08) | Very Low (Debt/Equity 0.01; excellent coverage) |
| Regulatory Risk | Moderate (global semiconductor regulations, export controls) | Moderate (industry-specific regulations) |
| Operational Risk | Moderate (complex global supply chains, 37K employees) | Moderate (smaller scale, but niche tech exposure) |
| Environmental Risk | Moderate (increasing pressure on semiconductor manufacturing sustainability) | Moderate (similar sector challenges, smaller footprint) |
| Geopolitical Risk | Elevated (exposure to US-China tensions impacting supply chains) | Elevated (similar geopolitical exposure, less diversified) |
Broadcom faces notable market and geopolitical risks due to its size and global footprint, with moderate debt adding financial leverage risk. Onto Innovation, while having very low debt, exhibits higher market volatility and similar geopolitical concerns in a niche semiconductor segment. The most impactful risks for both include geopolitical tensions affecting supply chains and regulatory scrutiny in the semiconductor industry.
Which Stock to Choose?
Broadcom Inc. (AVGO) shows a strong income evolution with 23.87% revenue growth in 2025 and a favorable profitability profile, including a 36.2% net margin and 28.45% ROE. Its debt level is moderate with a net debt to EBITDA of 1.41, and its overall rating is very favorable with a B grade, supported by a very favorable economic moat and strong financial scores.
Onto Innovation Inc. (ONTO) presents solid income growth of 21.01% in 2024 with favorable net margin at 20.43%, though profitability ratios like ROE and ROIC are neutral. The company has minimal debt (net debt to EBITDA negative), a very high current ratio, and a very favorable B+ rating, despite a slightly unfavorable moat due to ROIC below WACC but improving profitability.
Investors prioritizing durable competitive advantages and strong profitability metrics might find Broadcom’s profile more favorable, while those valuing low debt and improving growth could view Onto Innovation’s improving profitability and financial stability as appealing. The choice may depend on tolerance for valuation levels and preference for competitive moat strength versus growth trajectory.
Disclaimer: Investment carries a risk of loss of initial capital. The past performance is not a reliable indicator of future results. Be sure to understand risks before making an investment decision.
Go Further
I encourage you to read the complete analyses of Broadcom Inc. and Onto Innovation Inc. to enhance your investment decisions: