In the fast-evolving semiconductor industry, Broadcom Inc. and ON Semiconductor Corporation stand out as key players driving innovation and growth. Both companies operate in overlapping markets, focusing on advanced technologies that power everything from data centers to electric vehicles. While Broadcom excels in infrastructure software and complex subsystems, ON Semiconductor leads in intelligent sensing and power solutions. This article will explore which company presents the most compelling investment opportunity for you.

Table of contents
Companies Overview
I will begin the comparison between Broadcom Inc. and ON Semiconductor Corporation by providing an overview of these two companies and their main differences.
Broadcom Inc. Overview
Broadcom Inc. is a global technology company specializing in semiconductor and infrastructure software solutions. Headquartered in Palo Alto, California, it operates through four segments: Wired Infrastructure, Wireless Communications, Enterprise Storage, and Industrial & Other. Broadcom’s diverse product portfolio supports applications in networking, telecommunications, data centers, and industrial automation, employing around 37,000 people.
ON Semiconductor Corporation Overview
ON Semiconductor Corporation provides intelligent sensing and power solutions globally, focusing on enabling electrification in automotive and sustainable energy sectors. Based in Scottsdale, Arizona, it operates three segments: Power Solutions, Advanced Solutions, and Intelligent Sensing. The company develops analog and mixed-signal semiconductor products and serves various end-markets, employing approximately 26,400 people.
Key similarities and differences
Both Broadcom and ON Semiconductor operate in the semiconductor industry, offering products essential for diverse technology applications. Broadcom emphasizes infrastructure software and complex subsystems, whereas ON Semiconductor focuses more on power and sensing solutions, particularly for automotive and sustainable energy. Their business models differ in product scope and market focus, with Broadcom having a larger market cap and broader segment diversification.
Income Statement Comparison
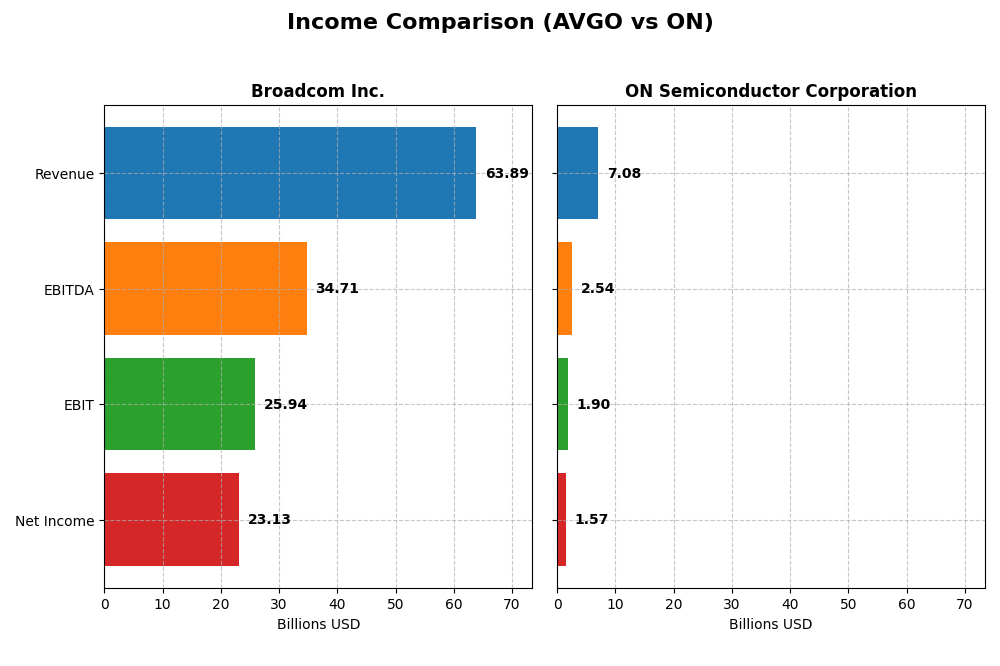
This table presents a side-by-side comparison of key income statement metrics for Broadcom Inc. and ON Semiconductor Corporation for their most recent fiscal years.
| Metric | Broadcom Inc. (AVGO) | ON Semiconductor Corporation (ON) |
|---|---|---|
| Market Cap | 1.60T | 25B |
| Revenue | 63.9B | 7.1B |
| EBITDA | 34.7B | 2.54B |
| EBIT | 25.9B | 1.90B |
| Net Income | 23.1B | 1.57B |
| EPS | 4.91 | 3.68 |
| Fiscal Year | 2025 | 2024 |
Income Statement Interpretations
Broadcom Inc.
Broadcom’s revenue grew significantly from $27.45B in 2021 to $63.89B in 2025, with net income surging from $6.44B to $23.13B. Margins improved substantially, with a gross margin of 67.77% and net margin of 36.2% in 2025. The recent year saw strong growth in revenue (+23.87%) and net income (+216.69%), reflecting robust profitability and operational efficiency.
ON Semiconductor Corporation
ON Semiconductor’s revenue increased moderately from $5.26B in 2020 to $7.08B in 2024, with net income rising from $234M to $1.57B. Margins are favorable, with a 45.41% gross margin and 22.21% net margin in 2024, though recent results show a 14.19% decline in revenue and a 16.07% drop in net margin. Overall, growth over the period remains positive but recent performance softened.
Which one has the stronger fundamentals?
Broadcom demonstrates stronger fundamentals with higher revenue and net income growth, superior profitability margins, and a robust recent-year performance. ON Semiconductor shows favorable long-term growth but faces recent declines in revenue and margins. Broadcom’s consistent margin expansion and large scale provide it with a more commanding financial position based on available income statement data.
Financial Ratios Comparison
The table below presents a side-by-side comparison of key financial ratios for Broadcom Inc. (AVGO) and ON Semiconductor Corporation (ON) for the most recent fiscal year available, 2025 for AVGO and 2024 for ON.
| Ratios | Broadcom Inc. (AVGO) | ON Semiconductor (ON) |
|---|---|---|
| ROE | 28.45% | 17.88% |
| ROIC | 16.36% | 11.88% |
| P/E | 73.87 | 17.13 |
| P/B | 21.01 | 3.06 |
| Current Ratio | 1.71 | 5.06 |
| Quick Ratio | 1.58 | 3.38 |
| D/E (Debt-to-Equity) | 0.80 | 0.38 |
| Debt-to-Assets | 38.07% | 23.90% |
| Interest Coverage | 7.94 | 28.37 |
| Asset Turnover | 0.37 | 0.50 |
| Fixed Asset Turnover | 25.25 | 1.61 |
| Payout ratio | 48.18% | 0% |
| Dividend yield | 0.65% | 0% |
Interpretation of the Ratios
Broadcom Inc.
Broadcom shows strong profitability with a 36.2% net margin and a 28.45% return on equity, signaling efficient use of capital. However, its high price-to-earnings ratio of 73.87 and price-to-book of 21.01 are unfavorable, suggesting overvaluation risks. The company pays dividends, but the dividend yield is low at 0.65%, indicating limited immediate income for shareholders.
ON Semiconductor Corporation
ON Semiconductor exhibits solid profitability with a 22.21% net margin and a 17.88% return on equity, though its weighted average cost of capital at 10.12% is unfavorable. The company does not pay dividends, likely focusing on reinvestment and growth strategies. It maintains a favorable debt-to-equity ratio of 0.38 and strong interest coverage at 30.49 times.
Which one has the best ratios?
Both companies have an equal proportion of favorable ratios at 50%, with similar levels of unfavorable and neutral metrics. Broadcom’s superior profitability contrasts with valuation concerns, while ON Semiconductor’s more conservative financial structure supports stability. Overall, neither stands out clearly as better; each has distinct strengths and weaknesses in its ratios.
Strategic Positioning
This section compares the strategic positioning of Broadcom Inc. and ON Semiconductor Corporation, including market position, key segments, and exposure to technological disruption:
Broadcom Inc.
- Market leader with strong competitive pressure in semiconductors and infrastructure software.
- Diverse segments: Wired Infrastructure, Wireless Communications, Enterprise Storage, Industrial & Other.
- Moderate exposure through complex semiconductor systems and firmware for diverse applications.
ON Semiconductor Corporation
- Smaller market cap with competitive pressure in power and sensing semiconductor solutions.
- Focused on Power Solutions, Analog, and Intelligent Sensing segments driving growth.
- Exposure tied to electrification and intelligent sensing technologies in automotive and energy sectors.
Broadcom Inc. vs ON Semiconductor Corporation Positioning
Broadcom pursues a diversified strategy across semiconductor and software infrastructure with broader end-markets, offering scale advantages. ON Semiconductor concentrates on power solutions and sensing, targeting automotive electrification and sustainable energy, which may limit diversification but focus innovation.
Which has the best competitive advantage?
Broadcom shows a very favorable moat with ROIC well above WACC and growing profitability, indicating a durable competitive advantage. ON Semiconductor, with a slightly favorable moat and ROIC near WACC, lacks a strong competitive advantage but shows improving profitability.
Stock Comparison
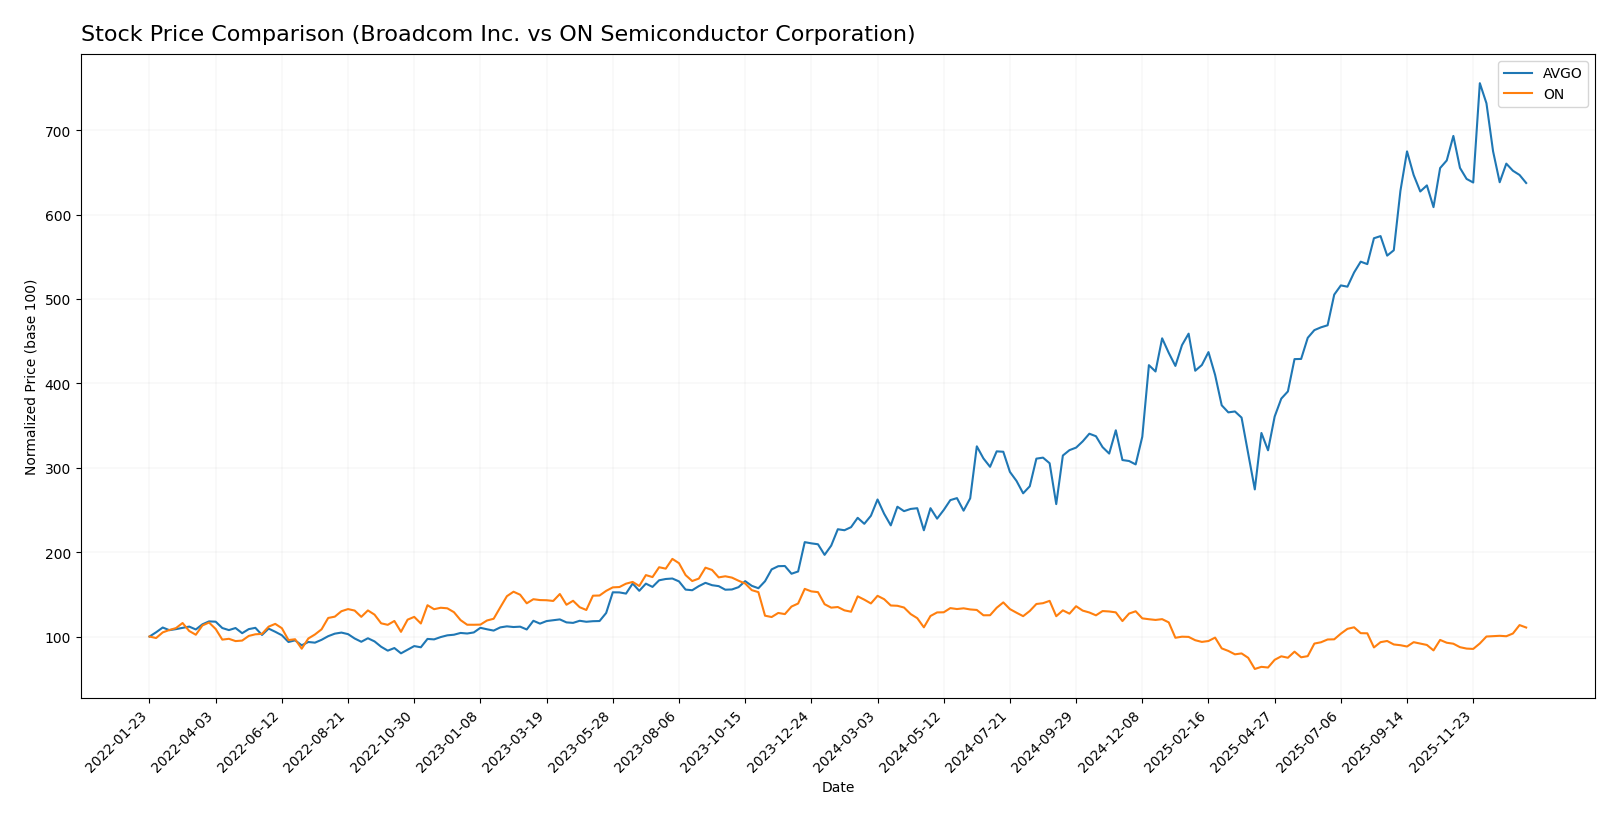
The stock price chart illustrates significant divergences in trading dynamics over the past 12 months, with Broadcom Inc. showing a strong bullish trend despite recent deceleration, contrasted by ON Semiconductor Corporation’s overall bearish trend accompanied by recent acceleration in price gains.
Trend Analysis
Broadcom Inc. (AVGO) experienced a 162.18% price increase over the past year, indicating a bullish trend with deceleration. The stock showed high volatility, with prices ranging from 120.47 to 402.96.
ON Semiconductor Corporation (ON) recorded a -20.49% price change over the same period, reflecting a bearish trend with accelerating decline. The price fluctuated between 33.7 and 81.14, showing lower volatility than AVGO.
Comparing the two, Broadcom Inc. delivered the highest market performance with a significant bullish trend, while ON Semiconductor’s stock underperformed with a bearish overall trend despite recent positive momentum.
Target Prices
The current analyst consensus shows promising upside potential for Broadcom Inc. and moderate expectations for ON Semiconductor Corporation.
| Company | Target High | Target Low | Consensus |
|---|---|---|---|
| Broadcom Inc. | 510 | 370 | 454.8 |
| ON Semiconductor Corporation | 64 | 51 | 58.33 |
Analysts expect Broadcom’s stock to rise significantly from its current price of $339.89, indicating strong growth potential. ON Semiconductor’s consensus target of $58.33 is slightly below its current price of $60.58, suggesting a more cautious outlook.
Analyst Opinions Comparison
This section compares analysts’ ratings and grades for Broadcom Inc. and ON Semiconductor Corporation:
Rating Comparison
Broadcom Inc. Rating
- Rating: B, considered very favorable.
- Discounted Cash Flow Score: 3, indicating moderate valuation.
- ROE Score: 5, very favorable, indicating strong profit generation from equity.
- ROA Score: 5, very favorable, showing excellent asset utilization.
- Debt To Equity Score: 1, very unfavorable, indicating higher financial risk.
- Overall Score: 3, moderate overall financial standing.
ON Semiconductor Corporation Rating
- Rating: B-, also very favorable but slightly lower.
- Discounted Cash Flow Score: 3, similarly moderate.
- ROE Score: 2, moderate efficiency in equity profit.
- ROA Score: 3, moderate asset utilization effectiveness.
- Debt To Equity Score: 2, moderate financial risk level.
- Overall Score: 2, moderate but lower than Broadcom.
Which one is the best rated?
Broadcom Inc. holds a higher overall rating (B) and stronger scores in ROE and ROA, while ON Semiconductor has a slightly lower rating (B-) and more moderate financial metrics. Broadcom is better rated based on the provided data.
Scores Comparison
Here is a comparison of the Altman Z-Score and Piotroski Score for Broadcom Inc. and ON Semiconductor Corporation:
Broadcom Inc. Scores
- Altman Z-Score: 12.13, indicating a safe zone.
- Piotroski Score: 8, reflecting very strong health.
ON Semiconductor Scores
- Altman Z-Score: 4.84, indicating a safe zone.
- Piotroski Score: 6, reflecting average strength.
Which company has the best scores?
Broadcom shows stronger financial health with a much higher Altman Z-Score and a very strong Piotroski Score. ON Semiconductor also remains in the safe zone but with lower scores, indicating relatively weaker financial metrics.
Grades Comparison
Here is a detailed comparison of the latest grades assigned to Broadcom Inc. and ON Semiconductor Corporation by reputable grading firms:
Broadcom Inc. Grades
The following table summarizes recent grades from established grading companies for Broadcom Inc.:
| Grading Company | Action | New Grade | Date |
|---|---|---|---|
| Mizuho | Maintain | Outperform | 2026-01-09 |
| Truist Securities | Maintain | Buy | 2025-12-19 |
| UBS | Maintain | Buy | 2025-12-15 |
| Benchmark | Maintain | Buy | 2025-12-12 |
| Rosenblatt | Maintain | Buy | 2025-12-12 |
| Piper Sandler | Maintain | Overweight | 2025-12-12 |
| TD Cowen | Maintain | Buy | 2025-12-12 |
| B of A Securities | Maintain | Buy | 2025-12-12 |
| JP Morgan | Maintain | Overweight | 2025-12-12 |
| Mizuho | Maintain | Outperform | 2025-12-12 |
Broadcom’s grades consistently show a strong buy or outperform consensus, indicating high confidence from analysts.
ON Semiconductor Corporation Grades
The table below shows the latest grades for ON Semiconductor Corporation from recognized grading companies:
| Grading Company | Action | New Grade | Date |
|---|---|---|---|
| Piper Sandler | Maintain | Overweight | 2026-01-07 |
| Truist Securities | Maintain | Hold | 2025-12-19 |
| Morgan Stanley | Maintain | Equal Weight | 2025-11-24 |
| Truist Securities | Maintain | Hold | 2025-11-04 |
| Baird | Maintain | Neutral | 2025-11-04 |
| Rosenblatt | Maintain | Neutral | 2025-11-04 |
| Morgan Stanley | Maintain | Equal Weight | 2025-11-04 |
| TD Cowen | Maintain | Buy | 2025-11-04 |
| UBS | Maintain | Neutral | 2025-10-27 |
| B of A Securities | Maintain | Neutral | 2025-09-05 |
ON Semiconductor’s grades primarily range from hold to neutral with a few buy or overweight ratings, indicating a more cautious view from analysts.
Which company has the best grades?
Broadcom Inc. has received predominantly buy and outperform ratings, reflecting stronger analyst confidence compared to ON Semiconductor Corporation’s more mixed hold and neutral grades. This suggests Broadcom is viewed as a more favorable investment option by the majority of grading firms. Investors may interpret this as a signal of potentially lower risk or better growth prospects in Broadcom versus ON Semiconductor.
Strengths and Weaknesses
Below is a comparison table outlining the key strengths and weaknesses of Broadcom Inc. (AVGO) and ON Semiconductor Corporation (ON) based on the most recent financial and operational data:
| Criterion | Broadcom Inc. (AVGO) | ON Semiconductor Corporation (ON) |
|---|---|---|
| Diversification | High diversification with strong segments in Infrastructure Software (27B) and Semiconductor Solutions (37B) | Moderate diversification across Analog, Power, and Intelligent Sensing groups with total revenues around 7B |
| Profitability | Very favorable profitability; net margin 36.2%, ROIC 16.4%, ROE 28.5% | Favorable profitability; net margin 22.2%, ROIC 11.9%, ROE 17.9% |
| Innovation | Strong innovation indicated by growing ROIC trend (+34%) and durable competitive advantage | Improving innovation with very high ROIC growth (+156%) but still shedding value overall (ROIC just below WACC) |
| Global presence | Extensive global presence supported by large infrastructure and semiconductor markets | Global presence in niche markets, but smaller scale compared to AVGO |
| Market Share | Leading market share in semiconductor solutions and infrastructure software | Growing market share, especially in power solutions but less dominant overall |
Key takeaways: Broadcom Inc. demonstrates a durable competitive advantage with strong profitability and diversification, making it a solid value creator. ON Semiconductor shows promising growth and improving profitability but remains a slightly riskier investment due to its current value shedding status and smaller scale.
Risk Analysis
Below is a comparison of key risks for Broadcom Inc. (AVGO) and ON Semiconductor Corporation (ON) based on the most recent data from 2025 and 2024 respectively:
| Metric | Broadcom Inc. (AVGO) | ON Semiconductor Corporation (ON) |
|---|---|---|
| Market Risk | Beta 1.22 (moderate volatility) | Beta 1.54 (above average volatility) |
| Debt level | Debt/Equity 0.8 (neutral), Debt to Assets 38.1% (moderate) | Debt/Equity 0.38 (favorable), Debt to Assets 23.9% (low) |
| Regulatory Risk | Moderate, due to global tech regulations | Moderate, with focus on automotive and energy sectors |
| Operational Risk | Complex product segments, but strong operational metrics | Diverse semiconductor applications, operational efficiency average |
| Environmental Risk | Exposure through product usage in power and energy sectors | Focus on sustainable energy solutions, moderate exposure |
| Geopolitical Risk | Global supply chain dependencies, US-China tensions impact | Similar global exposure, automotive market sensitivity |
Both companies carry moderate market risk, with ON Semiconductor showing higher volatility. Broadcom’s higher debt ratio warrants monitoring, though interest coverage is solid. Regulatory and geopolitical risks remain relevant due to global operations. Environmental risks are more pronounced for ON given its emphasis on sustainable energy, though both are exposed through their semiconductor products. The most impactful risk is Broadcom’s valuation risk given its high P/E and P/B ratios, which may affect downside in a market correction. ON’s lower leverage and strong interest coverage provide some cushion against financial distress.
Which Stock to Choose?
Broadcom Inc. (AVGO) shows strong income growth with a 132.74% revenue increase over 2021-2025 and a 36.2% net margin in 2025. Its financial ratios are slightly favorable, highlighting robust profitability (ROE 28.45%) and manageable debt (net debt/EBITDA 1.41). The company holds a very favorable rating (B) and demonstrates a very favorable MOAT with ROIC well above WACC and growing profitability.
ON Semiconductor Corporation (ON) experienced a 34.77% revenue growth over 2020-2024, but a recent 14.19% revenue decline in 2024. Its financial ratios are also slightly favorable, with good profitability (ROE 17.88%) and lower leverage (net debt/EBITDA 0.27). The rating is very favorable (B-), and the MOAT is slightly favorable, indicating improving profitability but value shedding as ROIC remains close to WACC.
Investors focused on strong and durable profitability with a very favorable competitive advantage might find Broadcom’s profile more aligned with their strategy, while those who prioritize improving profitability and lower leverage could see ON Semiconductor as potentially interesting. The choice could vary depending on risk tolerance and investment horizon.
Disclaimer: Investment carries a risk of loss of initial capital. The past performance is not a reliable indicator of future results. Be sure to understand risks before making an investment decision.
Go Further
I encourage you to read the complete analyses of Broadcom Inc. and ON Semiconductor Corporation to enhance your investment decisions: