NVIDIA Corporation and Broadcom Inc. are two heavyweights in the semiconductor industry, each driving innovation in critical technology sectors. NVIDIA excels in graphics processing and AI computing, while Broadcom focuses on semiconductor solutions spanning wired and wireless infrastructure. Their overlapping markets and distinct innovation strategies make them compelling subjects for comparison. In this article, I will help you determine which company offers the most promising investment opportunity.
Table of contents
Companies Overview
I will begin the comparison between NVIDIA and Broadcom by providing an overview of these two companies and their main differences.
NVIDIA Overview
NVIDIA Corporation is a leading technology firm specializing in graphics, compute, and networking solutions. The company serves diverse markets including gaming, professional visualization, data centers, and automotive. Its product offerings range from GeForce GPUs and cloud gaming services to AI platforms and autonomous vehicle technologies. Headquartered in Santa Clara, CA, NVIDIA employs 36,000 people and operates globally with a strong innovation focus.
Broadcom Overview
Broadcom Inc. is a global technology company designing and supplying semiconductor and infrastructure software solutions. It operates through four segments: Wired Infrastructure, Wireless Communications, Enterprise Storage, and Industrial & Other. Broadcom’s products serve a broad spectrum of applications such as networking, telecommunications, smartphones, and industrial automation. The company is based in Palo Alto, CA, and employs around 37,000 people worldwide.
Key similarities and differences
Both NVIDIA and Broadcom operate in the semiconductor industry, serving global markets with advanced technology products. While NVIDIA emphasizes graphics processing and AI-driven computing platforms, Broadcom offers a broader product range including semiconductor devices and embedded firmware for communications and industrial sectors. NVIDIA’s focus is more on computing and automotive AI, whereas Broadcom extends into wired infrastructure and enterprise storage solutions.
Income Statement Comparison
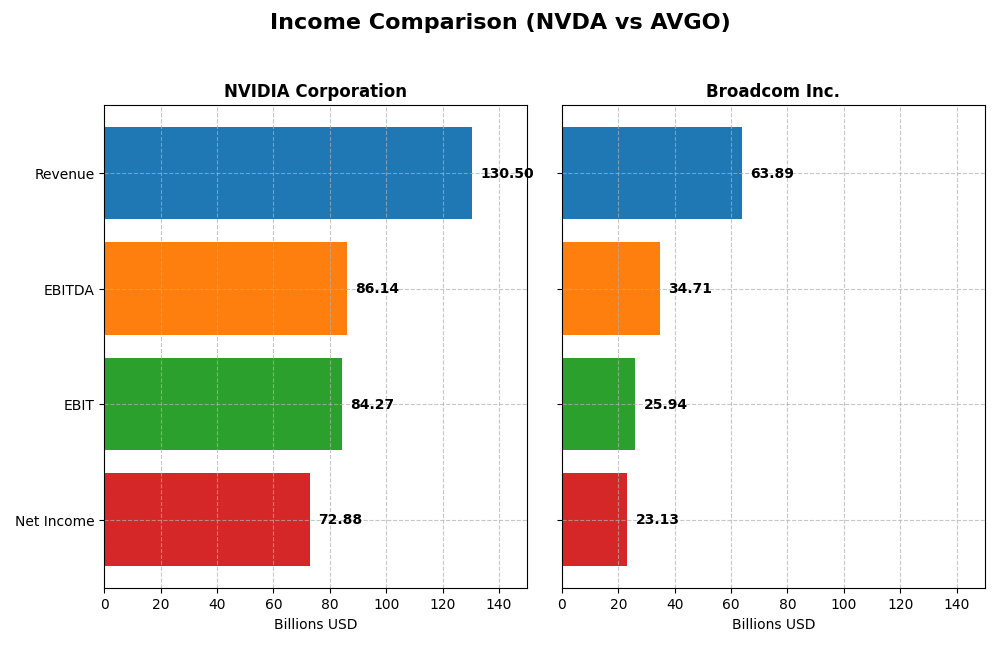
This table provides a side-by-side comparison of key income statement metrics for NVIDIA Corporation and Broadcom Inc. for their most recent fiscal year.
| Metric | NVIDIA Corporation | Broadcom Inc. |
|---|---|---|
| Market Cap | 4.46T | 1.60T |
| Revenue | 130.5B | 63.9B |
| EBITDA | 86.1B | 34.7B |
| EBIT | 84.3B | 25.9B |
| Net Income | 72.9B | 23.1B |
| EPS | 2.97 | 4.91 |
| Fiscal Year | 2025 | 2025 |
Income Statement Interpretations
NVIDIA Corporation
NVIDIA’s revenue surged from $16.7B in 2021 to $130.5B in 2025, with net income rising from $4.3B to $72.9B. Margins improved markedly, reflected by a gross margin near 75% and net margin of almost 56%. The latest fiscal year showed exceptional growth, doubling revenue and net income, alongside strong margin expansion, indicating robust operational efficiency.
Broadcom Inc.
Broadcom’s revenue grew steadily from $27.5B in 2021 to $63.9B in 2025, with net income increasing from $6.4B to $23.1B. Margins remained solid, with a 67.8% gross margin and 36.2% net margin in 2025. The most recent year displayed significant profit growth and margin improvement, supported by a nearly 24% revenue increase, highlighting consistent performance enhancement.
Which one has the stronger fundamentals?
NVIDIA exhibits stronger fundamentals with superior revenue and net income growth rates, and higher margins, especially in the latest fiscal year. Broadcom also shows favorable trends but with lower margin levels and slower growth. NVIDIA’s income statement evaluation is fully favorable, while Broadcom’s includes a neutral stance on interest expense, suggesting NVIDIA’s financials currently present a more robust profile.
Financial Ratios Comparison
This table presents a side-by-side comparison of key financial ratios for NVIDIA Corporation and Broadcom Inc. based on their most recent fiscal year data.
| Ratios | NVIDIA Corporation (2025) | Broadcom Inc. (2025) |
|---|---|---|
| ROE | 91.87% | 28.45% |
| ROIC | 75.28% | 16.36% |
| P/E | 39.90 | 73.87 |
| P/B | 36.66 | 21.01 |
| Current Ratio | 4.44 | 1.71 |
| Quick Ratio | 3.88 | 1.58 |
| D/E | 0.13 | 0.80 |
| Debt-to-Assets | 9.20% | 38.07% |
| Interest Coverage | 329.77 | 7.94 |
| Asset Turnover | 1.17 | 0.37 |
| Fixed Asset Turnover | 16.16 | 25.25 |
| Payout Ratio | 1.14% | 48.18% |
| Dividend Yield | 0.03% | 0.65% |
Interpretation of the Ratios
NVIDIA Corporation
NVIDIA shows a majority of favorable ratios, with strong net margin (55.85%), ROE (91.87%), and ROIC (75.28%), indicating excellent profitability and capital efficiency. However, high P/E (39.9) and P/B (36.66) ratios, along with an elevated current ratio (4.44), raise valuation and liquidity concerns. Dividend yield is low at 0.03%, reflecting minimal shareholder returns through dividends.
Broadcom Inc.
Broadcom displays a balanced profile with favorable net margin (36.2%), ROE (28.45%), and ROIC (16.36%), but weaker asset turnover (0.37) signals less efficient use of assets. Its P/E is high at 73.87, suggesting valuation risk. The company pays a higher dividend yield of 0.65%, though this is marked as unfavorable, possibly due to payout sustainability concerns or elevated debt levels.
Which one has the best ratios?
NVIDIA holds a more favorable overall ratio profile with 64.29% favorable metrics versus Broadcom’s 50%, especially excelling in profitability and capital efficiency. Broadcom’s higher leverage and weaker asset utilization weigh on its evaluation, despite a stronger current ratio. Both face valuation challenges, but NVIDIA’s ratios suggest stronger operational performance.
Strategic Positioning
This section compares the strategic positioning of NVIDIA Corporation and Broadcom Inc., focusing on market position, key segments, and exposure to technological disruption:
NVIDIA Corporation
- Leading semiconductor player with high market cap; faces competitive pressure in gaming and data center markets.
- Key segments include Data Center, Gaming, Automotive, and Professional Visualization driving growth and diversification.
- Significant exposure to AI, HPC, cloud computing, and automotive AI platforms as technological disruptors.
Broadcom Inc.
- Major semiconductor and infrastructure software company; operates in competitive enterprise and industrial sectors.
- Operates four segments: Semiconductor Solutions and Infrastructure Software dominate revenue streams.
- Exposure includes firmware, optoelectronic sensor interfaces, and evolving wireless and wired infrastructure.
NVIDIA vs Broadcom Positioning
NVIDIA pursues a diversified approach with strong emphasis on data centers, gaming, and automotive AI, while Broadcom concentrates on semiconductors and infrastructure software. NVIDIA’s broader market reach contrasts with Broadcom’s focused portfolio, each with distinct growth drivers and industry challenges.
Which has the best competitive advantage?
Both companies demonstrate durable competitive advantages with growing ROIC above WACC. NVIDIA has a much higher ROIC margin and growth trend, indicating stronger value creation and a more robust competitive moat over Broadcom.
Stock Comparison
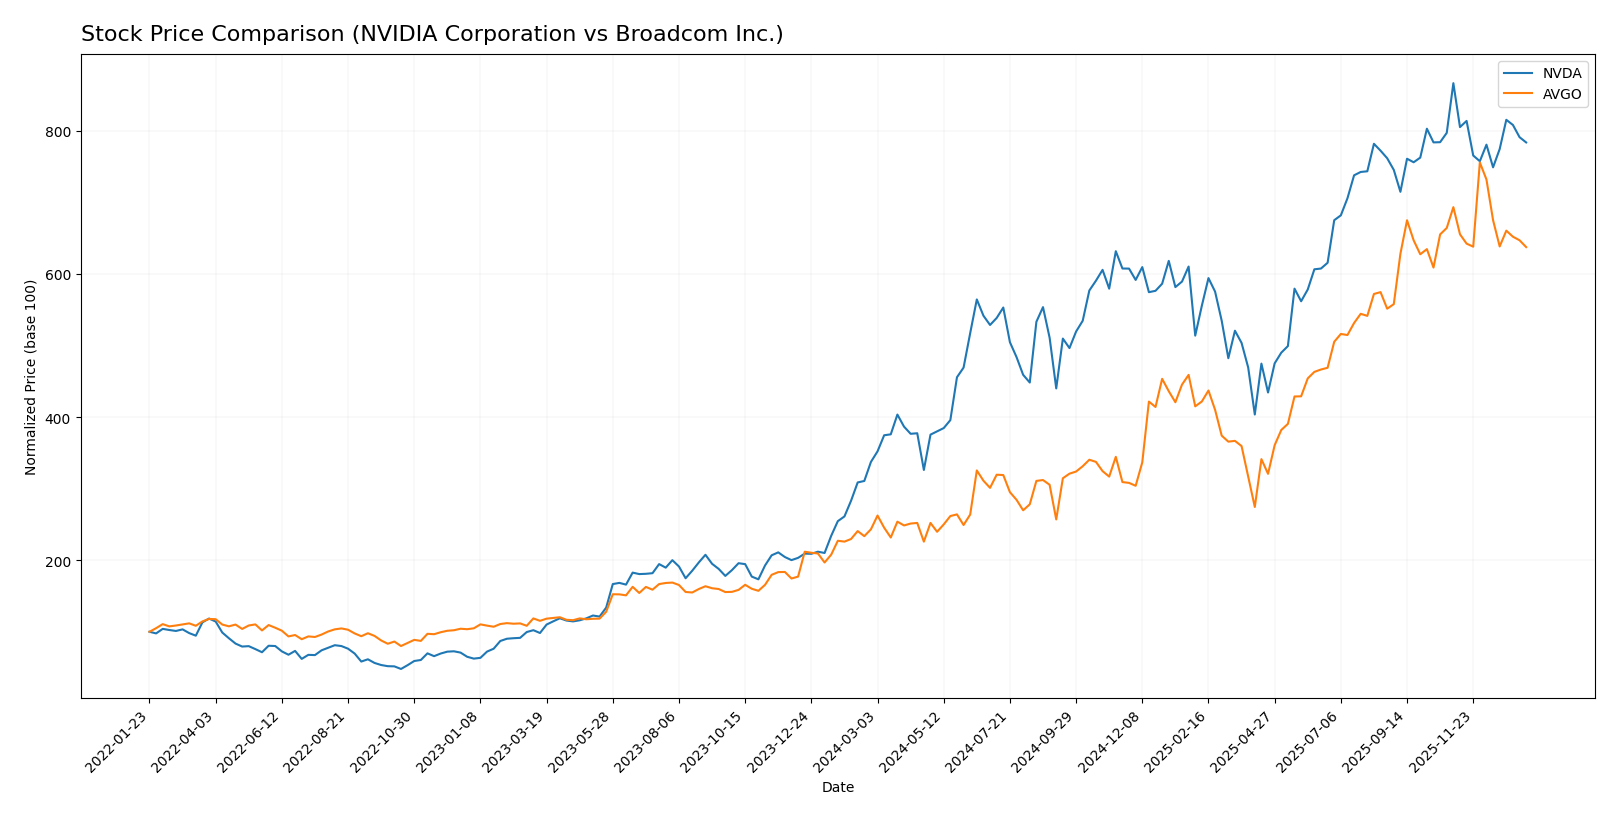
The stock prices of NVIDIA Corporation and Broadcom Inc. have both shown significant gains over the past 12 months, with notable deceleration in their upward momentum and recent declines in price accompanied by shifts in buyer-seller dynamics.
Trend Analysis
NVIDIA Corporation’s stock exhibited a strong bullish trend over the past year with a 132.35% increase, although this growth has recently decelerated and the price declined by 9.56% from November 2025 to January 2026. Volatility remains moderate with a standard deviation of 32.46.
Broadcom Inc. also experienced a bullish trend with a 162.18% rise over the last 12 months, showing deceleration similar to NVIDIA. Its recent price decreased by 8.05% in the same period, accompanied by higher volatility at a 78.56 standard deviation.
Comparing both, Broadcom delivered the highest market performance with a 162.18% increase versus NVIDIA’s 132.35%, despite both stocks facing recent downward corrections.
Target Prices
Analyst consensus suggests notable upside potential for both NVIDIA Corporation and Broadcom Inc.
| Company | Target High | Target Low | Consensus |
|---|---|---|---|
| NVIDIA Corporation | 352 | 140 | 264.34 |
| Broadcom Inc. | 510 | 370 | 454.8 |
Overall, analysts expect NVIDIA’s stock to rise from its current price of 183.14 USD toward a consensus target of 264.34 USD, while Broadcom’s stock at 339.89 USD shows potential to reach 454.8 USD according to consensus estimates.
Analyst Opinions Comparison
This section compares analysts’ ratings and grades for NVIDIA Corporation and Broadcom Inc.:
Rating Comparison
NVIDIA Rating
- Rating: B+, categorized as Very Favorable by analysts.
- Discounted Cash Flow Score: Moderate at 3, indicating balanced valuation view.
- ROE Score: Very Favorable at 5, showing strong profit generation from equity.
- ROA Score: Very Favorable at 5, reflecting efficient asset utilization.
- Debt To Equity Score: Moderate at 3, indicating medium financial risk.
- Overall Score: Moderate at 3, summarizing the company’s financial standing.
Broadcom Rating
- Rating: B, also considered Very Favorable.
- Discounted Cash Flow Score: Moderate at 3, similarly balanced valuation view.
- ROE Score: Very Favorable at 5, equally strong profit generation from equity.
- ROA Score: Very Favorable at 5, also reflecting efficient asset utilization.
- Debt To Equity Score: Very Unfavorable at 1, indicating higher financial risk.
- Overall Score: Moderate at 3, summarizing the company’s financial standing.
Which one is the best rated?
Based strictly on provided data, NVIDIA holds a slightly better rating (B+) compared to Broadcom’s B, with both sharing strong ROE and ROA scores. However, NVIDIA’s moderate debt-to-equity score contrasts with Broadcom’s very unfavorable score, suggesting comparatively lower financial risk.
Scores Comparison
Here is the comparison of the Altman Z-Score and Piotroski Score for NVIDIA Corporation and Broadcom Inc.:
NVIDIA Scores
- Altman Z-Score: 68.04, indicating a safe zone status.
- Piotroski Score: 6, classified as average financial health.
Broadcom Scores
- Altman Z-Score: 12.13, also indicating a safe zone.
- Piotroski Score: 8, classified as very strong health.
Which company has the best scores?
Broadcom has a lower Altman Z-Score than NVIDIA but both are in the safe zone. Broadcom’s Piotroski Score of 8 surpasses NVIDIA’s 6, indicating stronger financial health based on these metrics.
Grades Comparison
The following tables and summary present the latest grades issued by reputable grading companies for NVIDIA Corporation and Broadcom Inc.:
NVIDIA Corporation Grades
This table shows recent grades from well-known financial institutions for NVIDIA Corporation:
| Grading Company | Action | New Grade | Date |
|---|---|---|---|
| Mizuho | Maintain | Outperform | 2026-01-09 |
| Truist Securities | Maintain | Buy | 2025-12-29 |
| Stifel | Maintain | Buy | 2025-12-29 |
| B of A Securities | Maintain | Buy | 2025-12-26 |
| Baird | Maintain | Outperform | 2025-12-26 |
| Bernstein | Maintain | Outperform | 2025-12-26 |
| Truist Securities | Maintain | Buy | 2025-12-19 |
| Tigress Financial | Maintain | Strong Buy | 2025-12-18 |
| Morgan Stanley | Maintain | Overweight | 2025-12-01 |
| Deutsche Bank | Maintain | Hold | 2025-11-20 |
The overall trend for NVIDIA shows a strong buy and outperform consensus, with most ratings maintaining a positive stance and very few hold recommendations.
Broadcom Inc. Grades
This table lists recent reliable grades from established grading firms for Broadcom Inc.:
| Grading Company | Action | New Grade | Date |
|---|---|---|---|
| Mizuho | Maintain | Outperform | 2026-01-09 |
| Truist Securities | Maintain | Buy | 2025-12-19 |
| UBS | Maintain | Buy | 2025-12-15 |
| Benchmark | Maintain | Buy | 2025-12-12 |
| Rosenblatt | Maintain | Buy | 2025-12-12 |
| Piper Sandler | Maintain | Overweight | 2025-12-12 |
| TD Cowen | Maintain | Buy | 2025-12-12 |
| B of A Securities | Maintain | Buy | 2025-12-12 |
| JP Morgan | Maintain | Overweight | 2025-12-12 |
| Mizuho | Maintain | Outperform | 2025-12-12 |
Broadcom’s grades uniformly indicate a buy or outperform consensus, with no hold or sell ratings, reflecting a consistently positive analyst sentiment.
Which company has the best grades?
Both NVIDIA and Broadcom have predominantly buy and outperform ratings from reputable firms, but NVIDIA benefits from a slightly stronger consensus including strong buy and outperform categories. This indicates potentially higher analyst confidence for NVIDIA, which investors might interpret as a signal of stronger growth prospects or market positioning.
Strengths and Weaknesses
Below is a comparison table highlighting the key strengths and weaknesses of NVIDIA Corporation (NVDA) and Broadcom Inc. (AVGO) based on recent financial and operational data.
| Criterion | NVIDIA Corporation (NVDA) | Broadcom Inc. (AVGO) |
|---|---|---|
| Diversification | Highly diversified across Data Center (115B), Gaming (11.35B), Automotive (1.69B), and Professional Visualization (1.88B). | Focused mainly on Semiconductor Solutions (37B) and Infrastructure Software (27B), less diversified product range. |
| Profitability | Extremely high profitability with net margin at 55.85%, ROE at 91.87%, ROIC at 75.28%. | Strong profitability but lower, net margin 36.2%, ROE 28.45%, ROIC 16.36%. |
| Innovation | Very strong innovation, evidenced by rapid ROIC growth (339%) and dominant presence in AI and data center technologies. | Stable innovation with moderate ROIC growth (34%), strong fixed asset turnover (25.25) but less aggressive growth. |
| Global presence | Extensive global footprint driven by leading GPU and AI chip sales worldwide. | Global presence focused on semiconductors and software infrastructure markets, slightly narrower. |
| Market Share | Leading market share in GPUs and AI chips with expanding data center dominance. | Significant share in semiconductor components and infrastructure software, but facing intense competition. |
Key takeaways: NVIDIA excels with exceptional profitability, rapid innovation, and broad diversification, making it a strong value creator with a durable competitive moat. Broadcom maintains solid profitability and a focused product base but shows more moderate growth and diversification. Investors should weigh NVIDIA’s higher valuation risk against its robust growth potential.
Risk Analysis
Below is a comparative table of key risks for NVIDIA Corporation (NVDA) and Broadcom Inc. (AVGO) based on the most recent data from 2025 and 2026:
| Metric | NVIDIA Corporation (NVDA) | Broadcom Inc. (AVGO) |
|---|---|---|
| Market Risk | High beta (2.31) indicates higher volatility | Moderate beta (1.22) suggests moderate risk |
| Debt level | Low debt-to-equity (0.13), low debt-to-assets (9.2%) | Higher debt-to-equity (0.8), debt-to-assets (38.1%) |
| Regulatory Risk | Moderate, due to global operations and tech sector scrutiny | Moderate, similar global exposure and regulation |
| Operational Risk | Diversified product lines, strong operational metrics | Broad product portfolio, moderate asset turnover concerns |
| Environmental Risk | Moderate, typical for semiconductor industry | Moderate, with some exposure to industrial & energy sectors |
| Geopolitical Risk | Significant exposure to US-China tech tensions | Similar geopolitical exposure, given global supply chain |
The most likely and impactful risks for these companies stem from market volatility and geopolitical tensions, especially given NVIDIA’s high beta and broad exposure to international markets. Broadcom’s higher leverage increases financial risk, while both face regulatory scrutiny typical of the semiconductor sector. Investors should weigh volatility and debt carefully when considering these stocks.
Which Stock to Choose?
NVIDIA Corporation (NVDA) shows a strong income evolution with revenue growth of 114.2% in the past year and a consistent increase in net margin to 55.85%. Its financial ratios are mostly favorable, including a high return on equity of 91.87% and low debt levels. The company holds a very favorable rating of B+ and demonstrates a very favorable economic moat with a growing ROIC well above WACC.
Broadcom Inc. (AVGO) also presents favorable income growth, with a 23.87% revenue increase last year and a healthy net margin of 36.2%. Its financial ratios are slightly less favorable due to higher debt and mixed valuation metrics. The company has a very favorable rating of B, supported by a very favorable moat and steadily growing ROIC, albeit at a lower level compared to NVDA.
For investors prioritizing rapid growth and strong profitability metrics, NVDA might appear more attractive given its superior income evolution and financial strength. Conversely, those seeking a company with solid fundamentals and a slightly more moderate risk profile might find AVGO’s steady growth and durable competitive advantage more fitting. The choice could thus depend on the investor’s risk tolerance and investment strategy.
Disclaimer: Investment carries a risk of loss of initial capital. The past performance is not a reliable indicator of future results. Be sure to understand risks before making an investment decision.
Go Further
I encourage you to read the complete analyses of NVIDIA Corporation and Broadcom Inc. to enhance your investment decisions: