Home > Comparison > Technology > AVGO vs NVEC
The strategic rivalry between Broadcom Inc. and NVE Corporation shapes the semiconductor industry’s evolution. Broadcom operates as a capital-intensive giant with a diverse portfolio spanning wired infrastructure to industrial systems. In contrast, NVE focuses on niche spintronic sensor technology with a lean operational model. This analysis pits Broadcom’s scale against NVE’s innovation to identify which trajectory offers superior risk-adjusted returns for a balanced, growth-oriented portfolio.
Table of contents
Companies Overview
Broadcom Inc. and NVE Corporation both play pivotal roles in the semiconductor industry, shaping technological progress in their niches.
Broadcom Inc.: Global Semiconductor Powerhouse
Broadcom Inc. dominates as a global technology company designing and supplying semiconductors and infrastructure software. Its core revenue stems from diversified segments: Wired Infrastructure, Wireless Communications, Enterprise Storage, and Industrial & Other. In 2026, Broadcom focuses strategically on integrated solutions that serve data centers, telecommunications, and industrial automation markets, reinforcing its broad market presence.
NVE Corporation: Spintronics Innovator
NVE Corporation specializes in spintronic devices, leveraging nanotechnology for data acquisition, storage, and transmission. Its revenue engine revolves around sensors and couplers primarily serving factory automation and medical device sectors. The company’s 2026 strategy emphasizes niche innovation in spintronic technology and expanding its footprint within the Industrial Internet of Things (IIoT) landscape.
Strategic Collision: Similarities & Divergences
Broadcom pursues a broad, integrated product ecosystem, whereas NVE targets specialized spintronic innovation. Their primary battleground is industrial automation and sensor technology, with Broadcom leveraging scale and NVE focusing on technological differentiation. Investors encounter distinct profiles: Broadcom offers diversified scale and market leadership; NVE presents high-tech specialization with niche growth potential.
Income Statement Comparison
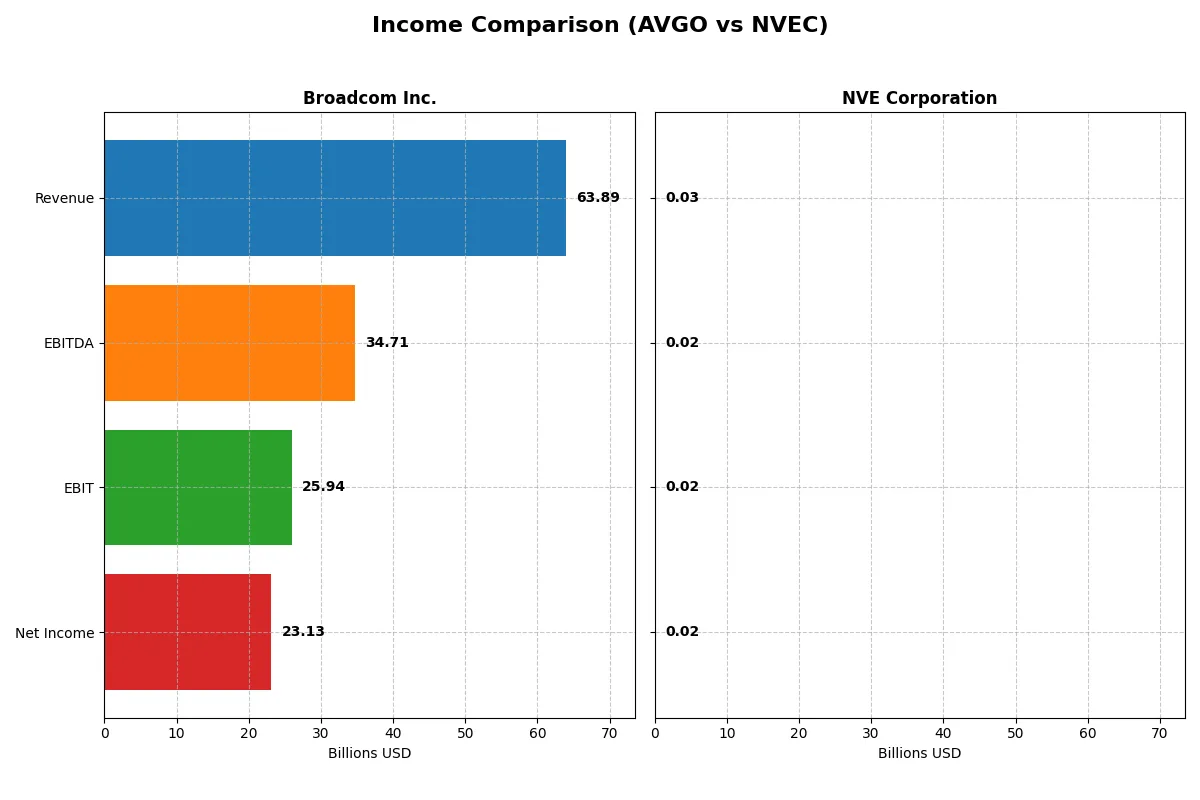
The following data dissects the core profitability and scalability of both corporate engines to reveal who dominates the bottom line:
| Metric | Broadcom Inc. (AVGO) | NVE Corporation (NVEC) |
|---|---|---|
| Revenue | 63.9B | 25.9M |
| Cost of Revenue | 20.6B | 4.2M |
| Operating Expenses | 17.8B | 5.6M |
| Gross Profit | 43.3B | 21.6M |
| EBITDA | 34.7B | 16.3M |
| EBIT | 25.9B | 16.0M |
| Interest Expense | 3.2B | 0 |
| Net Income | 23.1B | 15.1M |
| EPS | 4.91 | 3.12 |
| Fiscal Year | 2025 | 2025 |
Income Statement Analysis: The Bottom-Line Duel
This income statement comparison uncovers the true efficiency and profitability engine behind each company’s financial performance.
Broadcom Inc. Analysis
Broadcom delivers robust revenue growth, soaring from $27.5B in 2021 to $63.9B in 2025, with net income surging 243% over the period. Its gross margin remains a strong 67.8%, and net margin at 36.2%, reflecting disciplined cost control. The 2025 fiscal year shows exceptional momentum with net income more than tripling year-over-year, driven by an 87% EBIT jump.
NVE Corporation Analysis
NVE’s revenue peaks at $38.3M in 2023 but declines 13% to $25.9M in 2025, dragging net income down 12% year-over-year. Despite this, NVE maintains an impressive 83.6% gross margin and a stellar 58.2% net margin, highlighting operational efficiency. However, the recent dip signals challenges in sustaining growth momentum amid volatile sales.
Margin Power vs. Revenue Scale
Broadcom dominates with a commanding revenue scale and powerful earnings growth, showcasing broad market reach and operational leverage. NVE excels in margin purity but faces recent revenue and profit contraction. Investors seeking robust expansion and significant bottom-line gains may favor Broadcom’s scale, while those prioritizing margin strength might watch NVE’s efficiency profile cautiously.
Financial Ratios Comparison
These vital ratios act as a diagnostic tool to expose the underlying fiscal health, valuation premiums, and capital efficiency of the companies compared below:
| Ratios | Broadcom Inc. (AVGO) | NVE Corporation (NVEC) |
|---|---|---|
| ROE | 28.4% | 24.2% |
| ROIC | 16.4% | 21.1% |
| P/E | 73.9x | 20.5x |
| P/B | 21.0x | 4.95x |
| Current Ratio | 1.71 | 28.4 |
| Quick Ratio | 1.58 | 22.0 |
| D/E (Debt-to-Equity) | 0.80 | 0.015 |
| Debt-to-Assets | 38.1% | 1.4% |
| Interest Coverage | 7.94x | 0 (not applicable) |
| Asset Turnover | 0.37 | 0.40 |
| Fixed Asset Turnover | 25.3 | 8.91 |
| Payout Ratio | 48.2% | 128.4% |
| Dividend Yield | 0.65% | 6.28% |
| Fiscal Year | 2025 | 2025 |
Efficiency & Valuation Duel: The Vital Signs
Ratios act as a company’s DNA, exposing hidden risks and operational strengths that shape long-term investor outcomes.
Broadcom Inc.
Broadcom posts a robust 28.45% ROE and a strong 36.2% net margin, signaling solid profitability. However, its high P/E of 73.87 and P/B of 21.01 indicate the stock trades at a stretched valuation. Dividend yield sits low at 0.65%, suggesting modest shareholder returns amid ongoing reinvestment in R&D (17.2% of revenue).
NVE Corporation
NVE exhibits a healthy 24.19% ROE and an impressive 58.22% net margin, underscoring operational efficiency. Its P/E ratio of 20.46 is moderate, though a P/B of 4.95 flags some valuation concern. The firm delivers a 6.28% dividend yield, balancing income with a lean debt profile and strong capital returns.
Premium Valuation vs. Operational Safety
Broadcom’s premium valuation contrasts with NVE’s more balanced multiples and higher dividend yield. NVE offers a better risk-reward trade-off with solid profitability and safer leverage. Investors seeking income and operational safety may prefer NVE’s profile, while growth-focused investors tolerate Broadcom’s premium pricing.
Which one offers the Superior Shareholder Reward?
Broadcom (AVGO) delivers a modest 0.65% dividend yield with a controlled 48% payout ratio and strong free cash flow (5.7/share), alongside aggressive buybacks supporting total returns. NVE Corporation (NVEC) pays a robust 6.28% yield but with payout ratios exceeding 100%, risking sustainability. NVEC’s buybacks are limited compared to AVGO’s disciplined capital allocation. Historically, I’ve observed that high yield with payout risk can pressure long-term value. For 2026, Broadcom’s balanced dividend and buyback strategy offers a superior, sustainable total shareholder return profile versus NVE’s high but riskier yield.
Comparative Score Analysis: The Strategic Profile
The radar chart reveals the fundamental DNA and trade-offs of Broadcom Inc. and NVE Corporation, highlighting their strategic strengths and valuation differences:
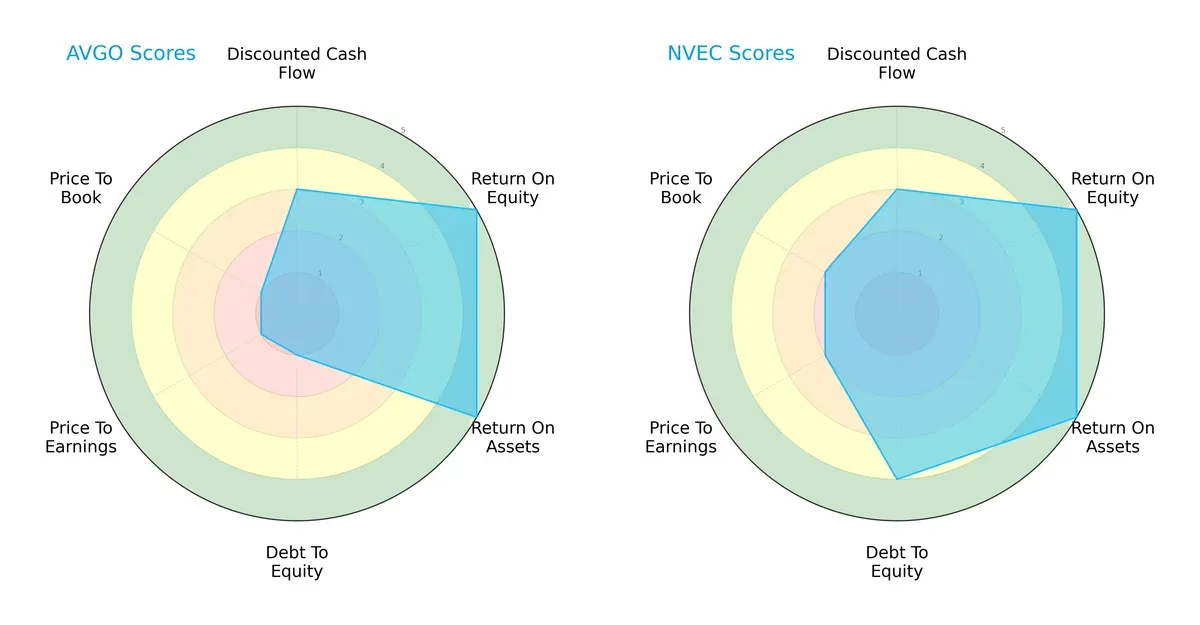
Broadcom excels in profitability with top ROE and ROA scores but suffers from high financial risk, reflected in weak debt-to-equity and valuation scores. NVE presents a more balanced profile, maintaining strong operational returns and a healthier leverage position with moderate valuation metrics. Broadcom relies heavily on operational efficiency, while NVE achieves steadier financial stability.
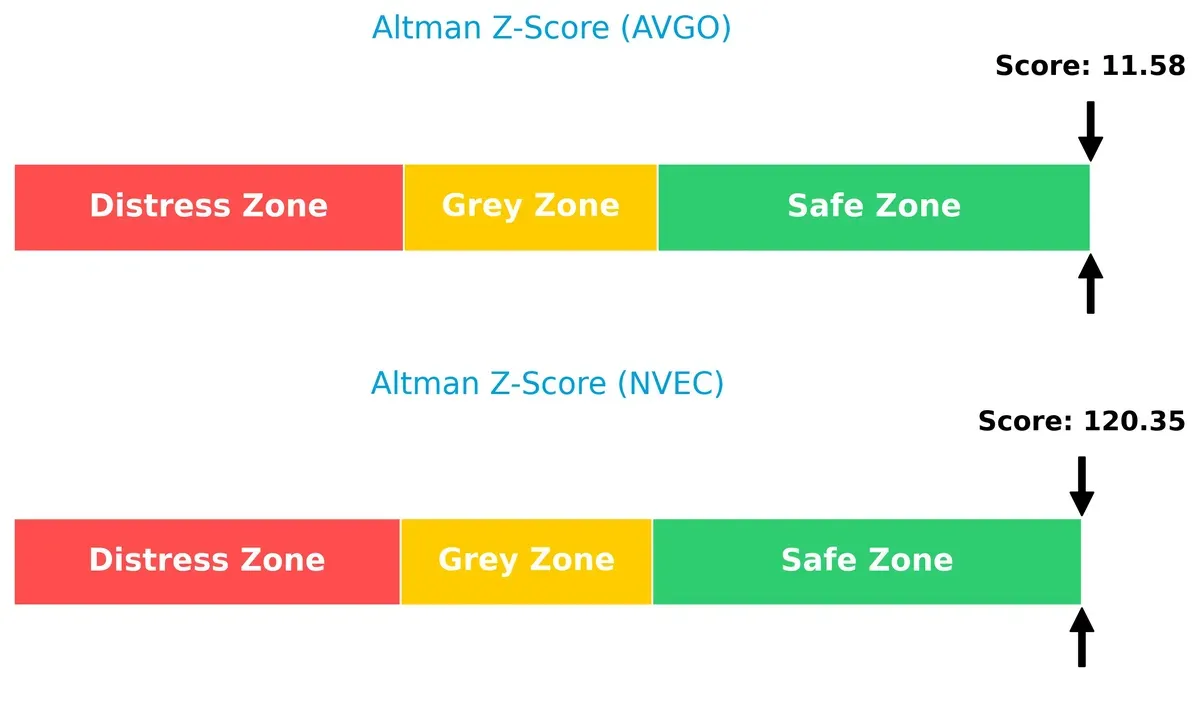
Bankruptcy Risk: Solvency Showdown
NVE’s Altman Z-Score vastly exceeds Broadcom’s, signaling far greater long-term solvency and lower bankruptcy risk in this economic cycle:
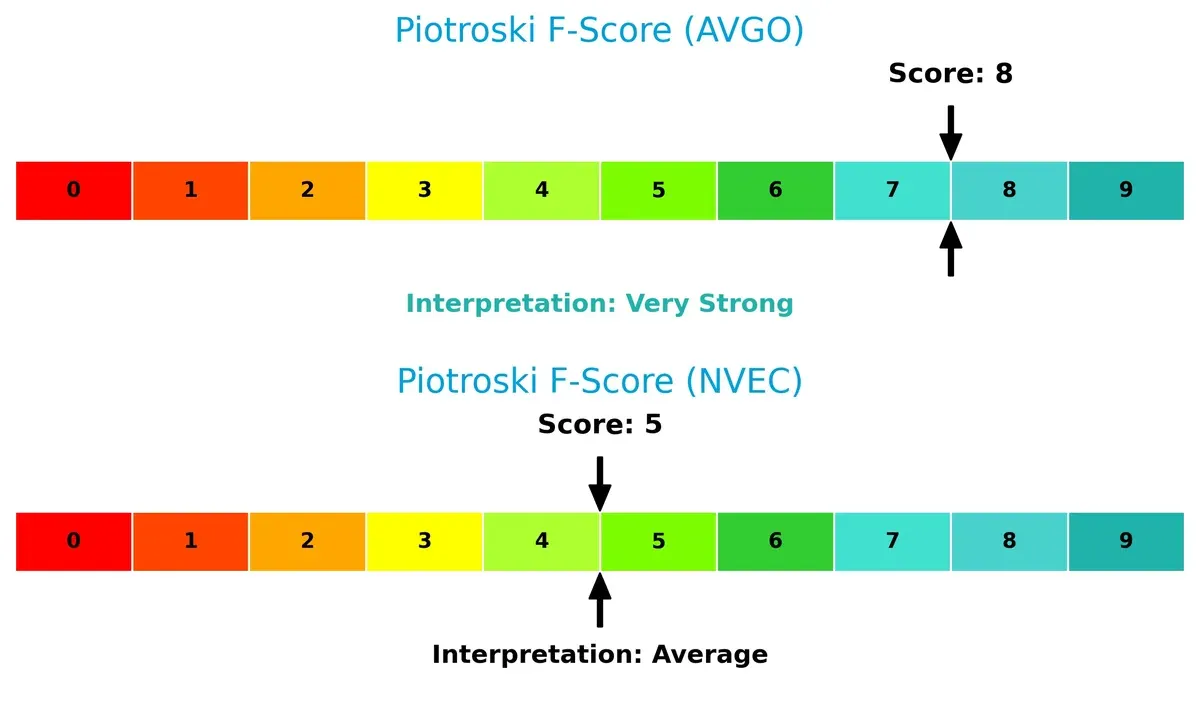
Financial Health: Quality of Operations
Broadcom’s Piotroski F-Score of 8 indicates very strong financial health, while NVE’s 5 suggests average internal metrics with potential red flags to monitor:
How are the two companies positioned?
This section dissects the operational DNA of Broadcom and NVE by comparing their revenue distribution and internal dynamics. The goal is to confront their economic moats and identify which model offers the most resilient competitive advantage today.
Revenue Segmentation: The Strategic Mix
This visual comparison dissects how Broadcom Inc. and NVE Corporation diversify income streams and highlights their primary sector bets:
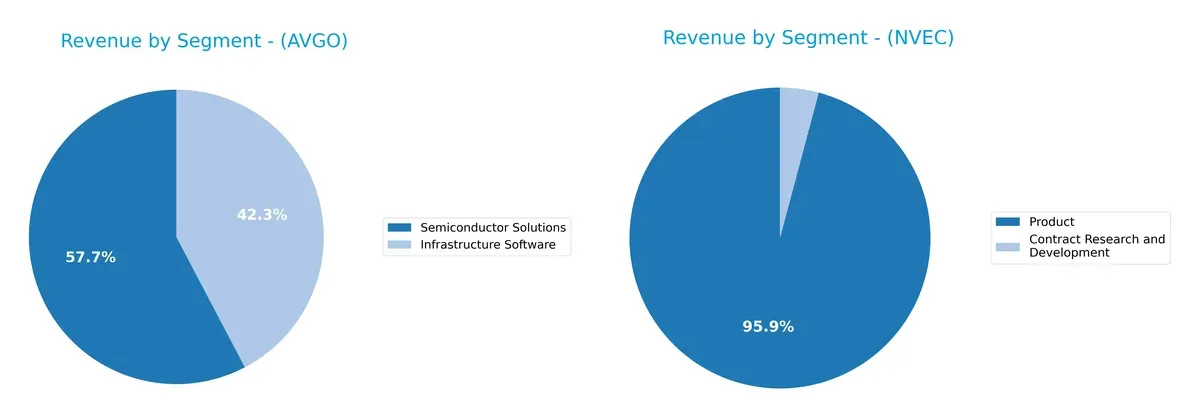
Broadcom Inc. anchors revenue in Semiconductor Solutions with $36.9B in 2025, while Infrastructure Software adds $27B, showing notable diversification. NVE Corporation pivots heavily on its Product segment, generating $25.9M in 2022, dwarfing its Contract Research and Development at $1.1M. Broadcom’s mix signals ecosystem lock-in and infrastructure dominance. NVE’s concentration on Product creates risk but reflects focused niche expertise.
Strengths and Weaknesses Comparison
This table compares the strengths and weaknesses of Broadcom Inc. and NVE Corporation based on diversification, profitability, financials, innovation, global presence, and market share:
Broadcom Inc. Strengths
- Diverse revenue from Infrastructure Software and Semiconductor Solutions
- Strong profitability with 36.2% net margin
- Favorable ROE and ROIC indicating efficient capital use
- Solid liquidity ratios with current ratio 1.71
- Global reach across Americas, Asia Pacific, EMEA
NVE Corporation Strengths
- Superior net margin of 58.22% and strong ROIC at 21.14%
- Very low debt-to-assets at 1.43% supporting financial stability
- Favorable interest coverage with infinite ratio
- High quick ratio of 22.03 indicates strong liquidity
- Global exposure including U.S., Europe, Asia
Broadcom Inc. Weaknesses
- High valuation multiples, PE at 73.87 and PB at 21.01, may limit upside
- Asset turnover low at 0.37 suggesting less efficient asset use
- Dividend yield low at 0.65% may deter income investors
- Moderate debt level at 38.07% debt-to-assets
- Heavy reliance on Asia Pacific region for sales
NVE Corporation Weaknesses
- Extremely high current ratio of 28.4 may indicate inefficient asset management
- Unfavorable PB ratio at 4.95 could imply overvaluation
- Asset turnover also low at 0.4, similar to peers
- Limited product diversification with most revenue from product sales
- Smaller geographic footprint compared to Broadcom
Broadcom demonstrates strong operational scale and diversified revenues but faces valuation and asset efficiency challenges. NVE excels in profitability and financial health but shows possible inefficiencies in asset use and concentration risks. Both companies exhibit distinct strategic profiles shaped by their financial and market characteristics.
The Moat Duel: Analyzing Competitive Defensibility
A structural moat shields long-term profits from relentless competition erosion. Let’s examine how Broadcom Inc. and NVE Corporation defend their turf:
Broadcom Inc.: Diversified Scale and Integration Moat
Broadcom’s moat stems from its cost advantage and integrated product portfolio, reflected in a robust 40.6% EBIT margin and 7%+ ROIC premium over WACC. Its expansion into wireless and enterprise markets promises deeper defensibility in 2026.
NVE Corporation: Niche Innovation and High-Margin Moat
NVE relies on specialized spintronics technology, generating exceptional 61.8% EBIT margins and a 12%+ ROIC premium. Unlike Broadcom’s scale, NVE’s moat is innovation-driven but faces growth pressure from declining recent revenues.
Verdict: Scale Integration vs. Niche Innovation
Both firms show durable moats with growing ROICs, but NVE’s higher ROIC premium is offset by shrinking revenue. Broadcom’s diversified scale and margin stability give it a wider moat, better equipped to sustain market share amid sector shifts.
Which stock offers better returns?
The past year saw Broadcom’s stock surge sharply before slowing, while NVE’s price declined overall but gained momentum late in the period.
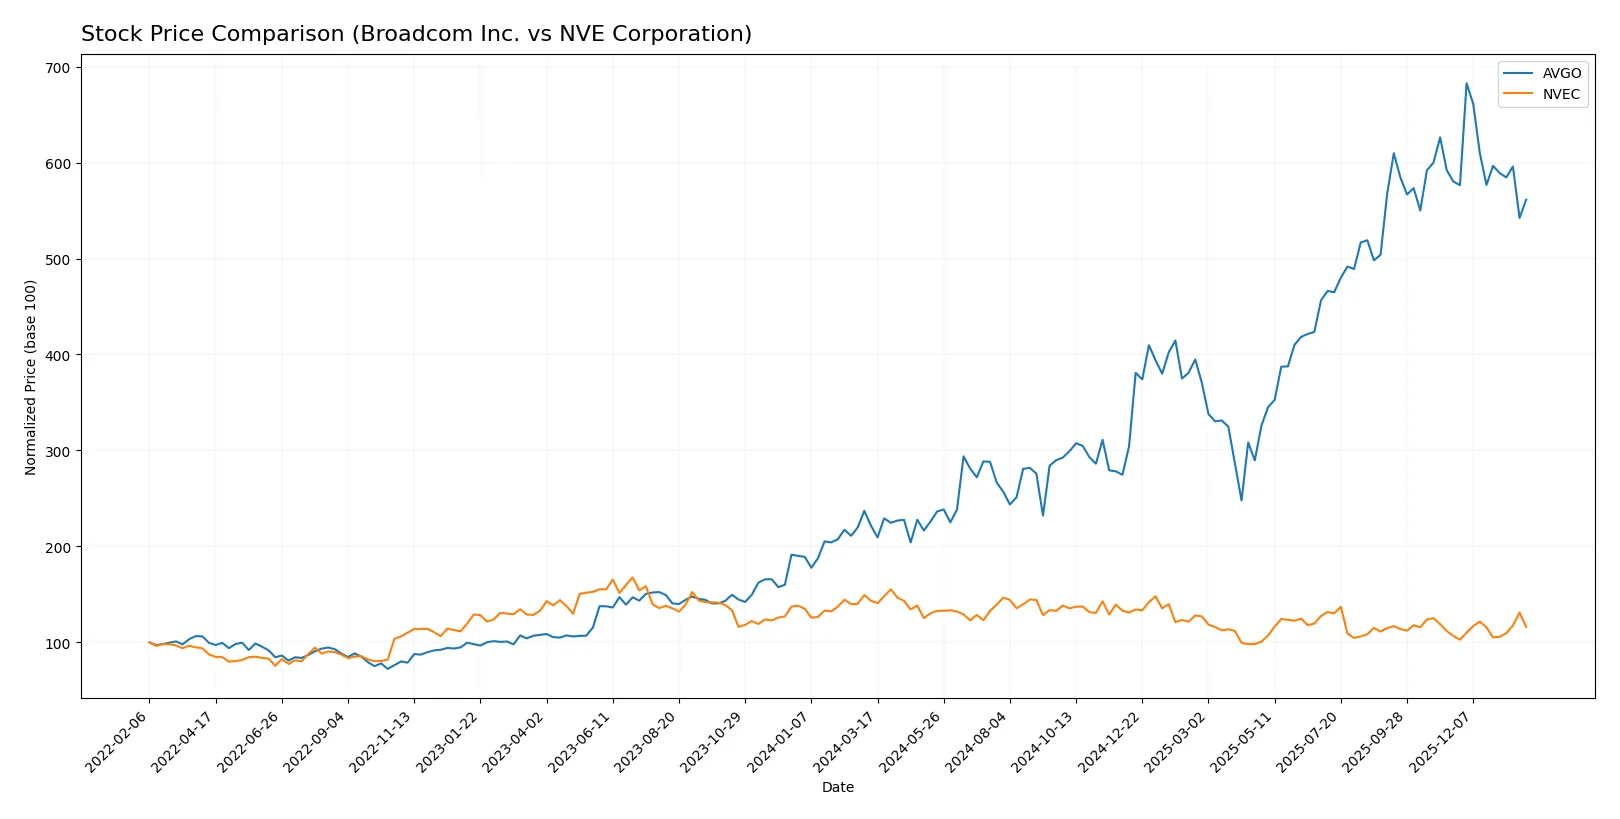
Trend Comparison
Broadcom Inc. (AVGO) posted a strong 153.15% gain over 12 months, marking a bullish trend with decelerating momentum and high volatility (std dev 78.96). The price peaked at 403 and troughed at 120.
NVE Corporation (NVEC) declined 18.93% over the same period, showing a bearish trend but accelerating downward. Volatility remained low (std dev 7.6). The stock reached a high of 90 and a low near 57.
Comparing trends, Broadcom delivered the highest market performance with a large bullish gain, while NVE showed a weaker, bearish trend despite recent recovery signals.
Target Prices
Broadcom Inc. shows a clear analyst consensus pointing to significant upside potential.
| Company | Target Low | Target High | Consensus |
|---|---|---|---|
| Broadcom Inc. | 370 | 510 | 450.12 |
Analysts expect Broadcom’s shares to rise roughly 36% from the current 331.3 price, signaling confidence in growth and margin expansion. No verified target price data is available for NVE Corporation.

Don’t Let Luck Decide Your Entry Point
Optimize your entry points with our advanced ProRealTime indicators. You’ll get efficient buy signals with precise price targets for maximum performance. Start outperforming now!
How do institutions grade them?
Here is a summary of recent institutional grades for Broadcom Inc. and NVE Corporation:
Broadcom Inc. Grades
The table below shows Broadcom Inc.’s latest grades from several reputable firms.
| Grading Company | Action | New Grade | Date |
|---|---|---|---|
| Wells Fargo | Upgrade | Overweight | 2026-01-15 |
| Mizuho | Maintain | Outperform | 2026-01-09 |
| Truist Securities | Maintain | Buy | 2025-12-19 |
| UBS | Maintain | Buy | 2025-12-15 |
| B of A Securities | Maintain | Buy | 2025-12-12 |
| Mizuho | Maintain | Outperform | 2025-12-12 |
| TD Cowen | Maintain | Buy | 2025-12-12 |
| Benchmark | Maintain | Buy | 2025-12-12 |
| Keybanc | Maintain | Overweight | 2025-12-12 |
| Rosenblatt | Maintain | Buy | 2025-12-12 |
Which company has the best grades?
Broadcom Inc. has received multiple “Buy,” “Outperform,” and “Overweight” grades from well-known firms. NVE Corporation lacks institutional grades. Investors might view Broadcom’s consistent positive ratings as a sign of strong confidence.
Risks specific to each company
The following categories identify the critical pressure points and systemic threats facing both firms in the 2026 market environment:
1. Market & Competition
Broadcom Inc.
- Operates in highly competitive semiconductor industry with global scale and diversified segments.
NVE Corporation
- Niche spintronics technology limits direct competition but faces smaller market size and innovation pressure.
2. Capital Structure & Debt
Broadcom Inc.
- Moderate leverage with debt-to-equity at 0.8; interest coverage strong at 8.08x.
NVE Corporation
- Minimal debt levels, debt-to-equity near zero; very strong interest coverage (infinite).
3. Stock Volatility
Broadcom Inc.
- Beta of 1.22 indicates moderate sensitivity to market swings.
NVE Corporation
- Beta of 1.20 suggests similar volatility but smaller float and volume increase risk.
4. Regulatory & Legal
Broadcom Inc.
- Large global footprint exposes to complex regulatory environments and potential antitrust scrutiny.
NVE Corporation
- Smaller scale limits regulatory impact but less diversified legal risk exposure.
5. Supply Chain & Operations
Broadcom Inc.
- Complex supply chains for multiple semiconductor segments create operational risks.
NVE Corporation
- Focused production on spintronics reduces complexity but increases dependency on few suppliers.
6. ESG & Climate Transition
Broadcom Inc.
- Larger carbon footprint due to scale; ESG initiatives underway but must adapt to increasing regulations.
NVE Corporation
- Smaller operations imply lower ESG risks but less capacity to invest in climate transition.
7. Geopolitical Exposure
Broadcom Inc.
- Significant exposure to US-China tensions impacting semiconductor exports and supply chains.
NVE Corporation
- Limited international exposure reduces geopolitical risks but constrains growth opportunities.
Which company shows a better risk-adjusted profile?
Broadcom faces its most impactful risk in complex geopolitical tensions affecting global supply chains. NVE’s primary risk lies in its high liquidity ratio anomaly, reflecting potential operational or reporting issues. NVE’s minimal debt and favorable solvency scores offer a stronger risk-adjusted profile despite market size limitations. Recent data show Broadcom’s debt-related scores as very unfavorable, reinforcing concerns on leverage risk amid global instability.
Final Verdict: Which stock to choose?
Broadcom Inc. wields unmatched efficiency as its superpower, delivering robust returns on invested capital well above its cost. Its scale and durable competitive advantage support aggressive growth, though investors should watch its elevated valuation multiples as a point of vigilance. This stock suits portfolios targeting high-conviction growth.
NVE Corporation’s strategic moat lies in its strong capital discipline and superior free cash flow yield, underpinned by a pristine balance sheet and low leverage. Compared to Broadcom, it offers a safer profile with moderate valuation, fitting well within GARP (Growth at a Reasonable Price) strategies seeking quality with margin of safety.
If you prioritize aggressive growth backed by a proven value creator with durable profitability, Broadcom outshines due to its scale and expanding returns. However, if you seek better stability and financial resilience at a more reasonable price, NVE Corporation offers superior capital efficiency and risk management. Both present compelling but distinct investment scenarios aligned with different risk appetites.
Disclaimer: Investment carries a risk of loss of initial capital. The past performance is not a reliable indicator of future results. Be sure to understand risks before making an investment decision.
Go Further
I encourage you to read the complete analyses of Broadcom Inc. and NVE Corporation to enhance your investment decisions: