In the fast-evolving semiconductor industry, Broadcom Inc. and Nova Ltd. stand out as key players with distinct approaches to innovation and market presence. Broadcom, a global giant, offers a broad portfolio spanning infrastructure software and hardware, while Nova specializes in precision metrology systems critical to semiconductor manufacturing. This comparison explores their strategies and market positions to help you identify which company could be the more compelling investment opportunity in 2026.

Table of contents
Companies Overview
I will begin the comparison between Broadcom Inc. and Nova Ltd. by providing an overview of these two companies and their main differences.
Broadcom Inc. Overview
Broadcom Inc. is a leading global technology company specializing in semiconductor and infrastructure software solutions. Headquartered in Palo Alto, California, it operates through four segments: Wired Infrastructure, Wireless Communications, Enterprise Storage, and Industrial & Other. Broadcom’s product range supports diverse applications including data center networking, telecommunications, smartphones, and industrial systems.
Nova Ltd. Overview
Nova Ltd. is an Israeli technology company that designs and manufactures process control systems for semiconductor production. Its product portfolio includes metrology platforms for various manufacturing steps such as lithography and etch. Nova serves integrated circuit sectors including logic, foundries, and memory manufacturers, with operations spanning Israel, Asia, and the U.S. The firm employs over 1,100 people and is headquartered in Rehovot, Israel.
Key similarities and differences
Both Broadcom and Nova operate in the semiconductor industry, but their business models differ significantly. Broadcom offers a broad portfolio of semiconductors and infrastructure software across multiple technology segments, while Nova focuses on specialized metrology equipment for semiconductor manufacturing process control. Broadcom’s market cap exceeds 1.6T with a large global workforce, contrasting with Nova’s smaller 12B market cap and niche product focus.
Income Statement Comparison
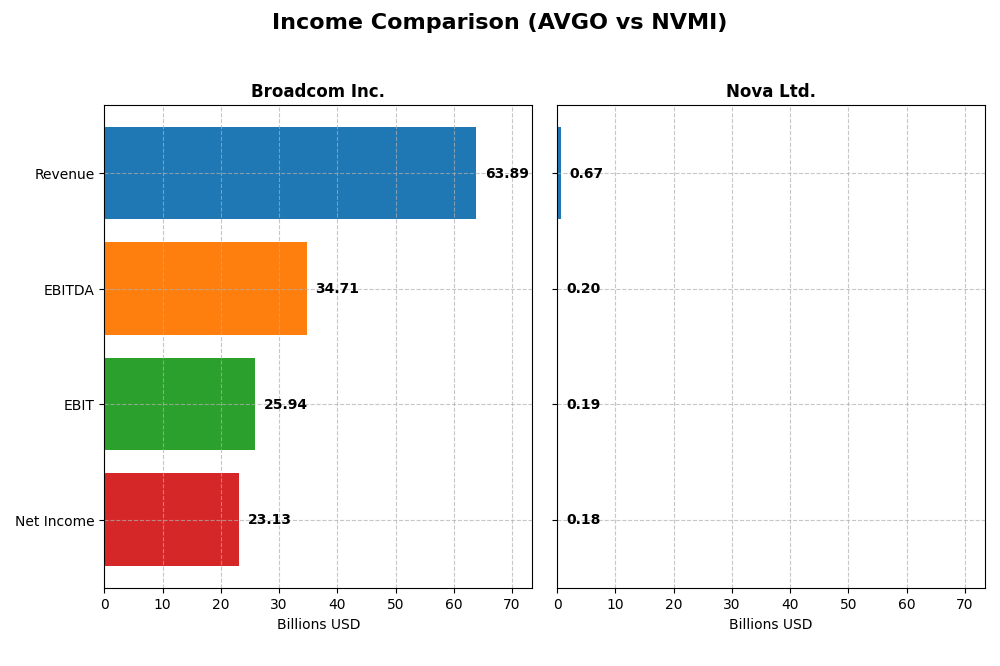
This table presents a side-by-side comparison of key income statement metrics for Broadcom Inc. and Nova Ltd. for their most recent fiscal years.
| Metric | Broadcom Inc. (AVGO) | Nova Ltd. (NVMI) |
|---|---|---|
| Market Cap | 1.6T | 12.2B |
| Revenue | 63.9B | 672M |
| EBITDA | 34.7B | 205M |
| EBIT | 25.9B | 188M |
| Net Income | 23.1B | 184.9M |
| EPS | 4.91 | 6.31 |
| Fiscal Year | 2025 | 2024 |
Income Statement Interpretations
Broadcom Inc.
Broadcom showed strong revenue growth from $27.5B in 2021 to $63.9B in 2025, with net income surging from $6.4B to $23.1B. Margins improved notably, with a gross margin of 67.77% and net margin at 36.2% in 2025. The latest year saw robust margin expansion and a 23.9% revenue increase, signaling accelerating profitability.
Nova Ltd.
Nova’s revenue increased from $416M in 2021 to $672M in 2024, with net income rising from $93M to $185M. Margins remained favorable, including a 57.57% gross margin and 27.33% net margin in 2024. The most recent year reflected solid 29.8% revenue growth and stable net margin, supporting consistent operational efficiency.
Which one has the stronger fundamentals?
Both companies display favorable income trends and margin improvements, but Broadcom leads with higher absolute revenue and net income growth, alongside stronger margins. Nova also exhibits significant growth and margin stability but on a smaller scale. Broadcom’s scale and margin expansion give it a stronger fundamental income position compared to Nova’s steady performance.
Financial Ratios Comparison
The following table compares key financial ratios for Broadcom Inc. (AVGO) and Nova Ltd. (NVMI) based on their most recent fiscal year data available for 2025 and 2024 respectively.
| Ratios | Broadcom Inc. (2025) | Nova Ltd. (2024) |
|---|---|---|
| ROE | 28.4% | 19.8% |
| ROIC | 16.4% | 13.4% |
| P/E | 73.9 | 31.2 |
| P/B | 21.0 | 6.18 |
| Current Ratio | 1.71 | 2.32 |
| Quick Ratio | 1.58 | 1.92 |
| D/E (Debt to Equity) | 0.80 | 0.25 |
| Debt-to-Assets | 38.1% | 17.0% |
| Interest Coverage | 7.94 | 116.2 |
| Asset Turnover | 0.37 | 0.48 |
| Fixed Asset Turnover | 25.3 | 5.06 |
| Payout Ratio | 48.2% | 0% |
| Dividend Yield | 0.65% | 0% |
Interpretation of the Ratios
Broadcom Inc.
Broadcom shows strong profitability ratios with a net margin of 36.2% and a return on equity of 28.45%, indicating efficient management and solid earnings generation. However, its high price-to-earnings (P/E) ratio of 73.87 and price-to-book (P/B) ratio of 21.01 raise valuation concerns. The company pays dividends with a modest yield of 0.65%, supported by free cash flow, though the yield is considered low.
Nova Ltd.
Nova Ltd. reports favorable profitability with a 27.33% net margin and a 19.81% return on equity, reflecting sound operational performance. Its weighted average cost of capital (WACC) is high at 12.21%, which could impact valuation. Nova does not pay dividends, focusing likely on reinvestment and growth, while maintaining strong liquidity and low debt levels, with a current ratio of 2.32 and debt-to-equity of 0.25.
Which one has the best ratios?
Nova Ltd. has a higher proportion of favorable ratios at 64.29% compared to Broadcom’s 50%, reflecting better balance sheet strength and operational efficiency. Broadcom excels in profitability but faces valuation and dividend yield challenges. Nova’s focus on reinvestment and lower leverage suggests a more favorable overall financial profile based on the given metrics.
Strategic Positioning
This section compares the strategic positioning of Broadcom Inc. and Nova Ltd. including market position, key segments, and exposure to technological disruption:
Broadcom Inc.
- Leading global semiconductor and infrastructure software company with large market cap and NASDAQ listing.
- Operates four segments: Wired Infrastructure, Wireless Communications, Enterprise Storage, Industrial & Other.
- Exposure through diverse semiconductor and infrastructure software products used in multiple industries and applications.
Nova Ltd.
- Smaller semiconductor process control systems provider focused on metrology platforms worldwide.
- Focused on semiconductor manufacturing process control systems, serving logic, foundries, and memory sectors.
- Exposure concentrated in specialized semiconductor metrology solutions, critical to manufacturing process control.
Broadcom Inc. vs Nova Ltd. Positioning
Broadcom shows a diversified approach with multiple business segments and a large product portfolio, offering broad market exposure. Nova is more concentrated on semiconductor process control systems, targeting niche manufacturing steps with a specialized product line.
Which has the best competitive advantage?
Broadcom holds a very favorable moat with value creation and growing ROIC, indicating a durable competitive advantage. Nova shows slightly favorable moat status with improving profitability but currently lacks a strong competitive advantage.
Stock Comparison
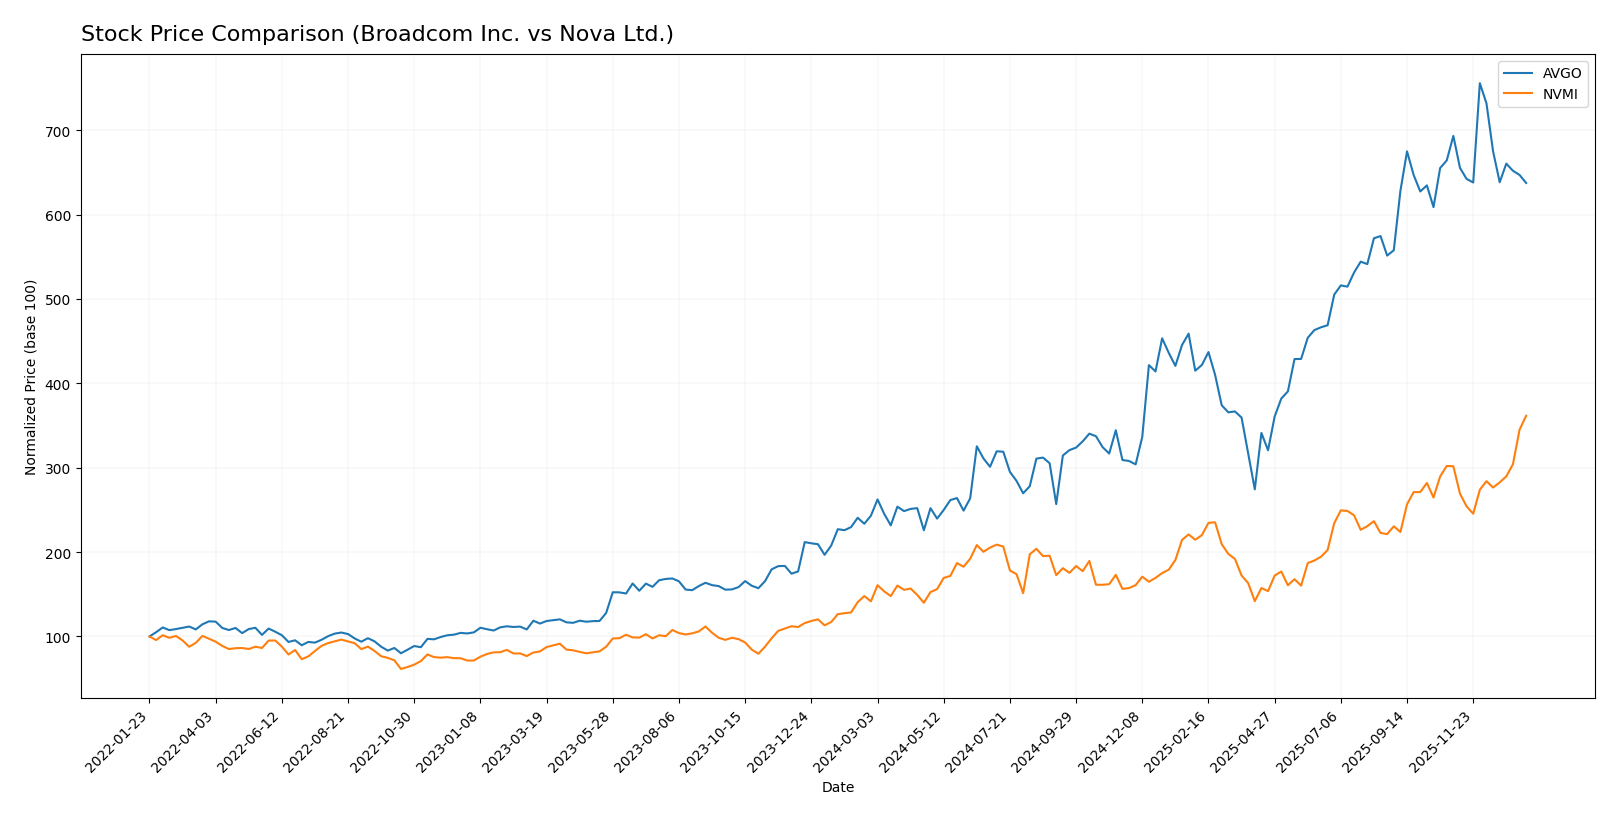
The past year has seen Broadcom Inc. (AVGO) and Nova Ltd. (NVMI) both deliver strong bullish trends with significant price gains, although Broadcom shows signs of decelerating momentum while Nova exhibits accelerating growth and contrasting recent trading dynamics.
Trend Analysis
Broadcom Inc. (AVGO) experienced a 162.18% price increase over the past 12 months, indicating a bullish trend with decelerating momentum. The stock reached a high of 402.96 and a low of 120.47, with high volatility (std deviation 78.56). Recent weeks show a slight bearish correction of -8.05%.
Nova Ltd. (NVMI) posted a 155.25% gain over the same period, confirming a bullish trend with accelerating momentum. The price ranged from 159.92 to 413.04, with moderate volatility (std deviation 55.12). Recently, the stock gained 19.85%, continuing its upward slope.
Comparing both, Broadcom delivered the highest overall market performance with a 162.18% increase versus Nova’s 155.25%, despite recent deceleration and volume patterns differing between the two stocks.
Target Prices
The current analyst consensus indicates positive upside potential for both Broadcom Inc. and Nova Ltd.
| Company | Target High | Target Low | Consensus |
|---|---|---|---|
| Broadcom Inc. | 510 | 370 | 454.8 |
| Nova Ltd. | 390 | 335 | 362.5 |
Analysts expect Broadcom’s stock to appreciate significantly from the current price of $339.89, with a consensus target near $455. Nova Ltd.’s consensus target at $362.5 is below its current price of $413.04, suggesting a more cautious outlook.
Analyst Opinions Comparison
This section compares analysts’ ratings and grades for Broadcom Inc. and Nova Ltd.:
Rating Comparison
Broadcom Inc. Rating
- Rating: B, considered Very Favorable by analysts.
- Discounted Cash Flow Score: 3, reflecting Moderate valuation based on future cash flows.
- ROE Score: 5, indicating very favorable profit generation from shareholders’ equity.
- ROA Score: 5, very favorable asset utilization for earnings.
- Debt To Equity Score: 1, indicating very unfavorable financial leverage risk.
- Overall Score: 3, reflecting a moderate overall financial standing.
Nova Ltd. Rating
- Rating: B-, also considered Very Favorable.
- Discounted Cash Flow Score: 3, also Moderate valuation.
- ROE Score: 4, showing favorable profit generation efficiency.
- ROA Score: 5, equally very favorable asset use.
- Debt To Equity Score: 1, also very unfavorable leverage risk.
- Overall Score: 3, similarly moderate overall standing.
Which one is the best rated?
Broadcom Inc. holds a slightly better rating of B compared to Nova Ltd.’s B-, with a higher ROE score. Both share identical scores for DCF, ROA, debt-to-equity, and overall scores, making Broadcom marginally better rated strictly on the provided data.
Scores Comparison
Here is a side-by-side comparison of the Altman Z-Score and Piotroski Score for Broadcom Inc. and Nova Ltd.:
Broadcom Inc. Scores
- Altman Z-Score: 12.13, indicating a safe zone with very low bankruptcy risk.
- Piotroski Score: 8, classified as very strong financial health.
Nova Ltd. Scores
- Altman Z-Score: 7.76, also in the safe zone with low bankruptcy risk.
- Piotroski Score: 7, classified as strong financial health.
Which company has the best scores?
Broadcom Inc. shows higher Altman Z-Score and Piotroski Score values than Nova Ltd., suggesting comparatively stronger financial stability and health based on these metrics.
Grades Comparison
Here is the recent grades comparison for Broadcom Inc. and Nova Ltd.:
Broadcom Inc. Grades
The table below summarizes recent grades from reputable grading companies for Broadcom Inc.:
| Grading Company | Action | New Grade | Date |
|---|---|---|---|
| Mizuho | Maintain | Outperform | 2026-01-09 |
| Truist Securities | Maintain | Buy | 2025-12-19 |
| UBS | Maintain | Buy | 2025-12-15 |
| Benchmark | Maintain | Buy | 2025-12-12 |
| Rosenblatt | Maintain | Buy | 2025-12-12 |
| Piper Sandler | Maintain | Overweight | 2025-12-12 |
| TD Cowen | Maintain | Buy | 2025-12-12 |
| B of A Securities | Maintain | Buy | 2025-12-12 |
| JP Morgan | Maintain | Overweight | 2025-12-12 |
| Mizuho | Maintain | Outperform | 2025-12-12 |
Broadcom’s grades show a strong consensus with multiple “Buy” and “Outperform” ratings consistently maintained over recent months.
Nova Ltd. Grades
The following table displays recent grades from credible grading firms for Nova Ltd.:
| Grading Company | Action | New Grade | Date |
|---|---|---|---|
| B of A Securities | Maintain | Buy | 2026-01-13 |
| Jefferies | Maintain | Buy | 2025-12-15 |
| Evercore ISI Group | Maintain | Outperform | 2025-11-07 |
| Benchmark | Maintain | Buy | 2025-11-07 |
| Cantor Fitzgerald | Maintain | Overweight | 2025-06-24 |
| B of A Securities | Maintain | Buy | 2025-06-24 |
| Benchmark | Maintain | Buy | 2025-05-09 |
| Citigroup | Maintain | Buy | 2025-05-09 |
| B of A Securities | Maintain | Buy | 2025-04-16 |
| Cantor Fitzgerald | Maintain | Overweight | 2025-03-14 |
Nova Ltd.’s grades also reflect a solid “Buy” and “Outperform” consensus, with consistent maintenance of positive ratings from well-known firms.
Which company has the best grades?
Both Broadcom Inc. and Nova Ltd. have received predominantly “Buy” and “Outperform” grades from respected grading companies, indicating favorable analyst sentiment. Broadcom exhibits a higher volume of recent ratings, reflecting strong and stable confidence, which could influence investor perception of consistent performance.
Strengths and Weaknesses
Below is a comparative table outlining the key strengths and weaknesses of Broadcom Inc. (AVGO) and Nova Ltd. (NVMI) based on their latest financial and strategic data.
| Criterion | Broadcom Inc. (AVGO) | Nova Ltd. (NVMI) |
|---|---|---|
| Diversification | High: Two major segments, Infrastructure Software ($27B) and Semiconductor Solutions ($37B) revenue in 2025 | Low: Single product line with $538M revenue in 2024 |
| Profitability | Very strong: Net margin 36.2%, ROIC 16.36%, ROE 28.45% | Strong: Net margin 27.33%, ROIC 13.39%, ROE 19.81% |
| Innovation | High: Durable competitive advantage with growing ROIC (34.4% increase) | Moderate: Growing ROIC (70.1% increase) but currently shedding value |
| Global presence | Extensive global reach across multiple industries | More limited, focused niche market presence |
| Market Share | Large, leading player in semiconductor solutions and infrastructure software | Smaller, niche market player with growth potential |
In summary, Broadcom exhibits solid diversification, high profitability, and a durable competitive moat, making it a robust value creator. Nova shows promising growth with improving profitability but remains less diversified and currently lacks a strong economic moat. Investors should weigh Broadcom’s stability against Nova’s growth potential and higher risk.
Risk Analysis
Below is a comparative overview of key risks for Broadcom Inc. (AVGO) and Nova Ltd. (NVMI) as of the most recent fiscal years.
| Metric | Broadcom Inc. (AVGO) | Nova Ltd. (NVMI) |
|---|---|---|
| Market Risk | Beta 1.22, high valuation multiples increase volatility risk | Beta 1.83, higher volatility due to smaller market cap and exposure to niche semiconductor segment |
| Debt level | Debt-to-Equity 0.8 (neutral), interest coverage 8.08 (favorable) | Debt-to-Equity 0.25 (favorable), very strong interest coverage 116.2 |
| Regulatory Risk | Moderate, US tech sector scrutiny and export controls | Elevated, Israeli base and exposure to international semiconductor regulation |
| Operational Risk | Complex supply chain for diverse product portfolio | Concentrated product focus, risk in production disruptions |
| Environmental Risk | Moderate, semiconductor manufacturing impacts and sustainability efforts ongoing | Moderate, semiconductor process controls involve chemical handling risks |
| Geopolitical Risk | Exposure to US-China trade tensions impacting supply chains | Higher, due to Israel location and global semiconductor market tensions |
Broadcom faces significant market and geopolitical risks given its size and global footprint, with valuation concerns adding market risk. Nova, though smaller and less leveraged, carries elevated geopolitical and regulatory risks linked to its Israeli base and semiconductor niche. Both companies remain financially stable with strong interest coverage, but valuation and external factors are key risk drivers.
Which Stock to Choose?
Broadcom Inc. (AVGO) shows strong income growth with a 23.87% revenue increase last year and consistently favorable margins. Its profitability ratios like ROE at 28.45% and ROIC at 16.36% are robust, supported by moderate debt levels and a very favorable overall rating.
Nova Ltd. (NVMI) exhibits solid income growth with a 29.83% revenue rise last year and favorable profitability metrics, including a 19.81% ROE and 13.39% ROIC. The company maintains low debt and a favorable rating, though its cost of capital is higher than AVGO’s.
For investors, AVGO’s very favorable moat and higher profitability ratios could appeal to those prioritizing quality and durable competitive advantages. Conversely, NVMI’s favorable financials and accelerating price trend might be more attractive to growth-oriented, risk-tolerant profiles seeking improving profitability.
Disclaimer: Investment carries a risk of loss of initial capital. The past performance is not a reliable indicator of future results. Be sure to understand risks before making an investment decision.
Go Further
I encourage you to read the complete analyses of Broadcom Inc. and Nova Ltd. to enhance your investment decisions: